These metrics reflect user behavior patterns that help you improve product offerings and campaigns that enhance the customer search experience and increase conversions. For example, a significant increase during a promotional campaign helps confirm the success of the event, and lets you adjust the campaign to increase conversions.
The Signal Usage screen helps your organization monitor data flow and identify ingestion and other issues quickly, which enhances the ability to maintain operational efficiency. For example, if a significant decrease in signals occurs, you can troubleshoot automated workflows and other areas to determine the cause.
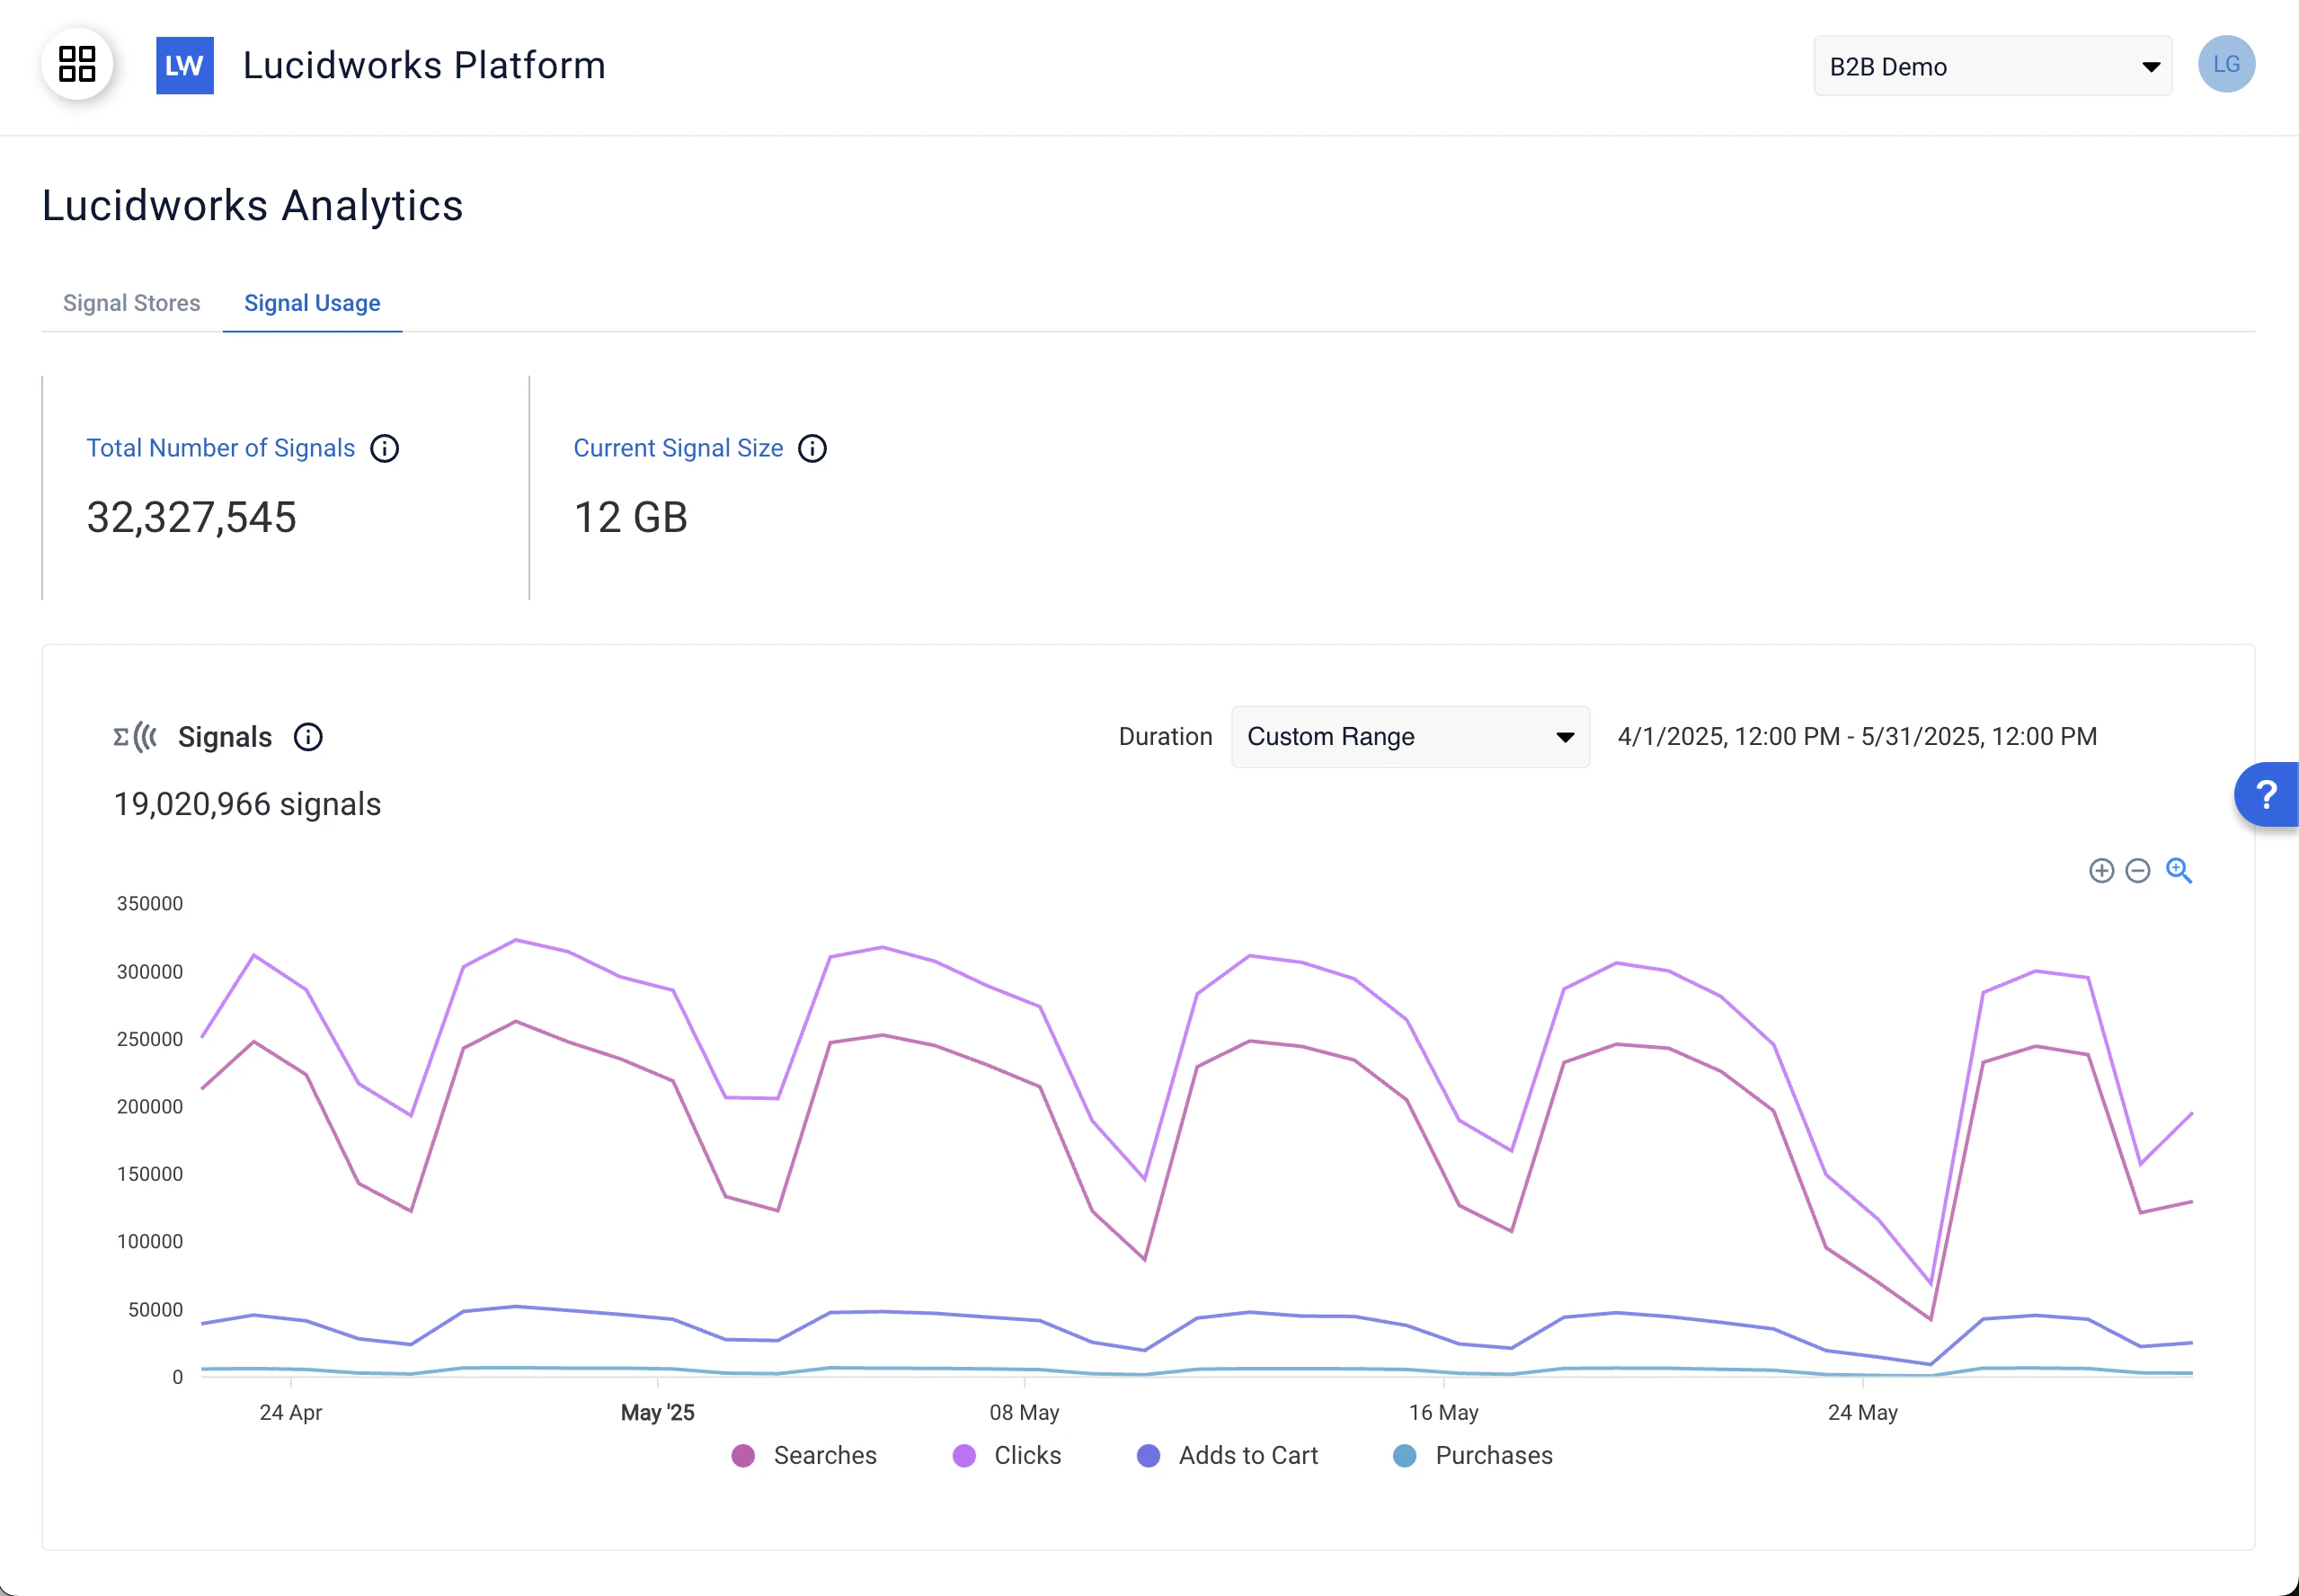
Signal usage metrics provide information about relevance, ranking, and discoverability of site content. For example, a decrease in signals can indicate users may not be finding the information they need. A review of relevance settings and potential content gaps could help resolve any issues.