Signals analytics
The Signals analytics dashboard displays detailed information about user interactions on your site. You can view metrics across different date ranges and click Customize to edit dashboard contents.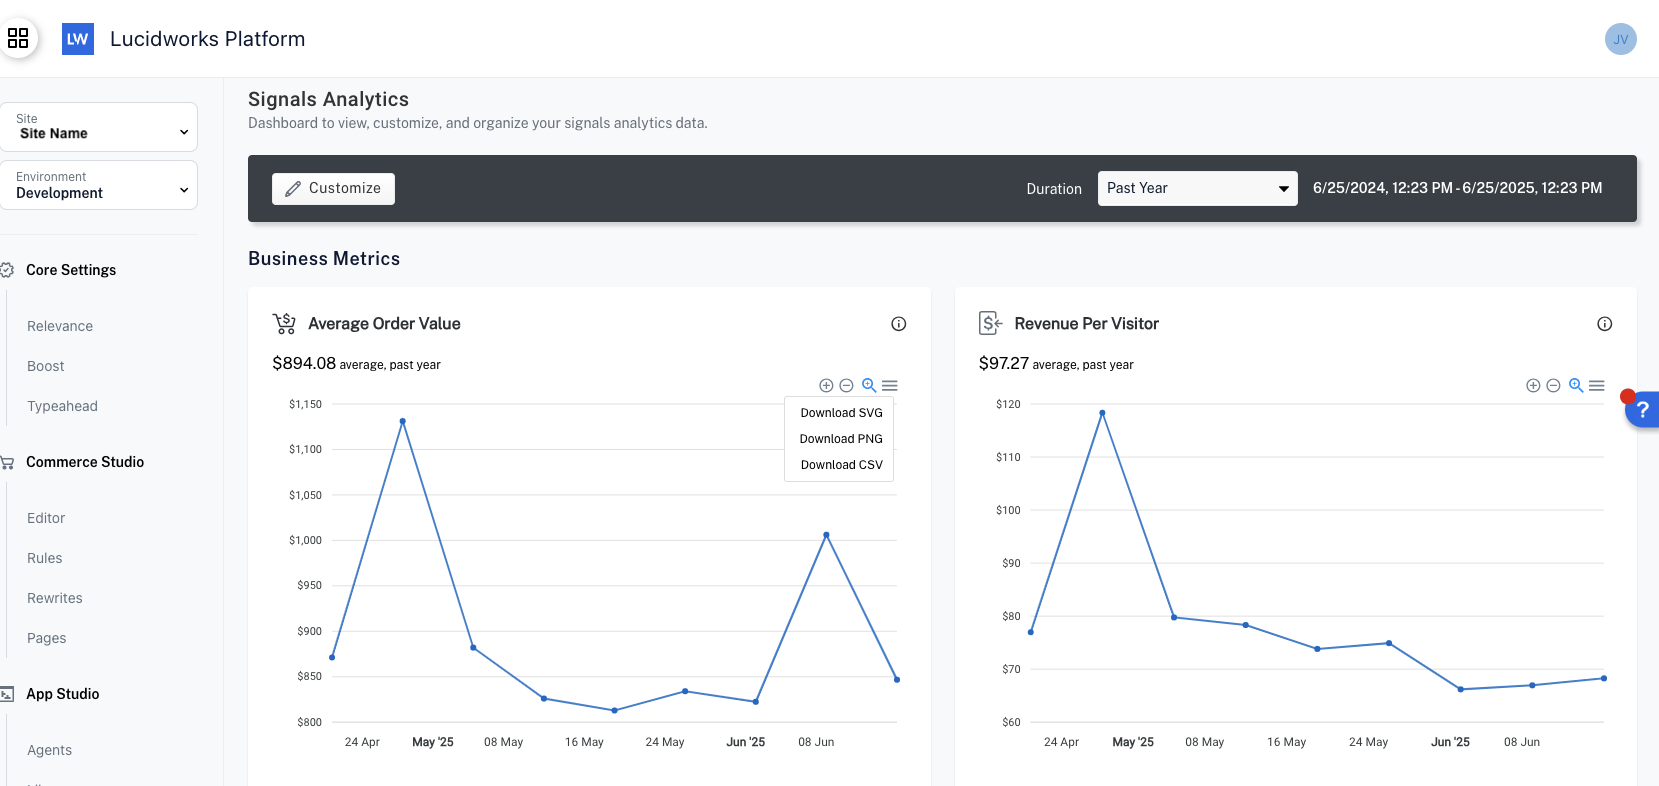
Customize metrics dashboards
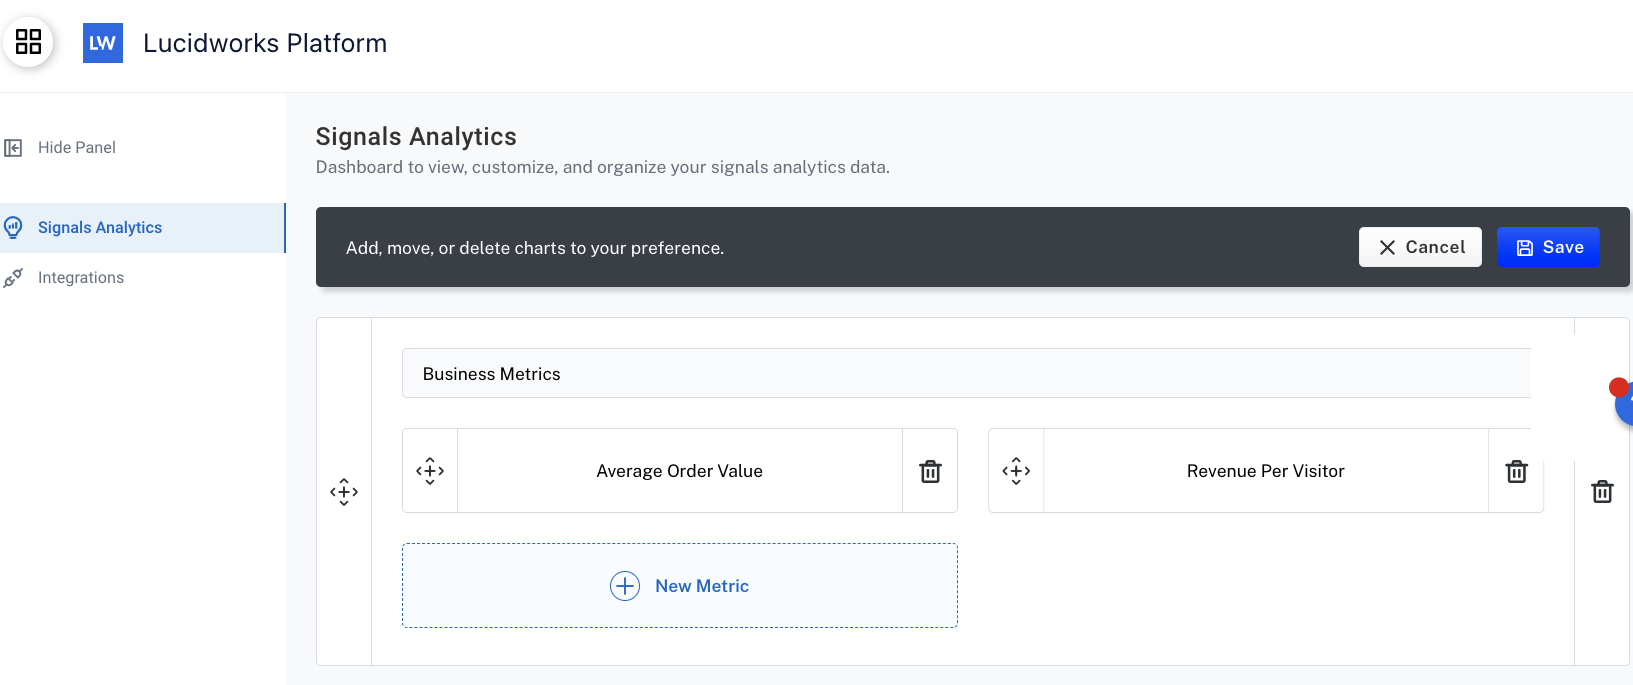
You can customize your dashboard by editing sections and charts. Your customizations will not affect other users. To learn more about charts, see Types of metrics. To customize your dashboard, complete the following steps:-
From the Signals Analytics screen, click Customize.
-
Click + New Metric in the section where you want to add charts.
-
Select the checkbox for each chart, and then click Insert.
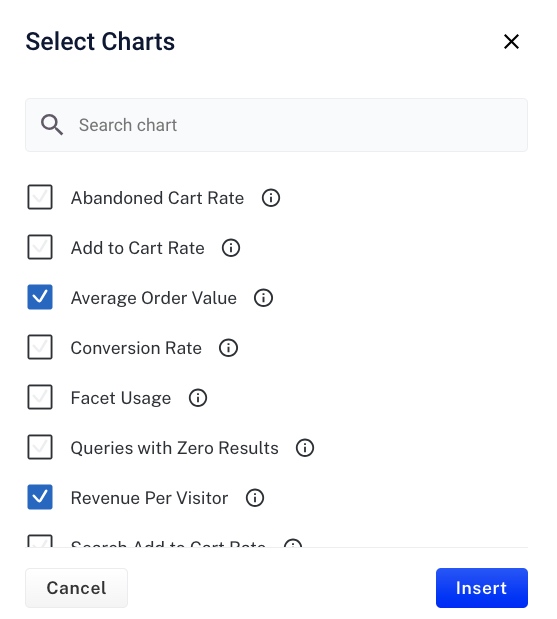
- When you’re finished adding charts and customizing sections, click Save.
Types of metrics
The Signals analytics dashboard supports these metrics:
The Signals analytics dashboard supports these metrics:
Abandoned Cart Rate
Measures the percentage of shopping carts that are created but not converted into purchases. This metric is crucial for understanding issues in the checkout process. For example, if the abandoned cart rate increases significantly after a sales promotion ends, you may want to create another offer where the item no longer on sale is paired with a related, discounted item.Calculated using:
Add to Cart Rate
Measures the percentage of clicks that result in an item being added to the shopping cart. This metric highlights the effectiveness of product pages and user readiness to purchase. For example, a cart add rate of 2.0% indicates that for every 100 product clicks, 2 items are added to the cart. Monitoring this metric can help identify areas where improvements in product descriptions, images, or pricing strategies could drive better results.Calculated using:
Average Click Position
Measures the average ranking position where customers click to select a product from the results, providing critical visibility into ranking effectiveness. This metric helps ecommerce teams validate merchandising rules, optimize product visibility, and measure the impact of search configuration changes on customer engagement and conversion rates. A lower average click position is better, because it means customers are finding the product they seek quickly, which can increase conversion rates and minimize cart abandonment and loss of sales to competitors.Calculated using:
Average Order Value
Displays the average price value of orders for the selected time period. This metric is crucial for understanding how much revenue is generated per order, which helps in evaluating pricing strategies and customer spending behavior. For example, if a B2B organization tracks replenishment orders from existing distributors and the average order value isn’t as high for a particular reorder as it has been in the past, one way to enhance sales and revenue per sale may be to bundle the order items with other items, services, or extended warranties.Calculated using:
Conversion Rate
Measures the effectiveness of a website, campaign, or action in achieving a specific goal, such as purchases, sign-ups, or downloads. It reflects how well you convert visitors or actions into successful outcomes. For example, if conversions are low even though searches are tuned to provide recommendations for top-selling items, you may need to create a campaign or more specifically define the search results.Calculated using:and
Facet Usage
Measures facet usage over time for the given period. Shows how many of each facet were selected for the given period. For example, if the facet for the most recent version of an item is heavily used, you can use this to ensure that the item is always stocked and the ability to replenish the supply is consistent and secure.Calculated using:
Queries with Zero Results
List of query terms that were searched and yielded no results the most frequently. For example, if misspelled terms net zero results, organizations can add spelling corrections or synonyms for those terms to improve discoverability.Ranked according to frequency.
Revenue Per Visitor
Average revenue generated by each visitor to your site over time, for the given period. It is a combination metric of conversion rate and average order value. For example, if revenue per visitor decreases even though site traffic has increased, you may want to focus on boosting or running promotions on items most searched.Calculated using:
Search Add to Cart Rate
Measures the percentage of visitors who add a product to their cart after finding it through the site’s search function. A high search add-to-cart rate indicates that the search function is successfully leading users to products they are interested in. For example, if search add to cart rate is lower for certain parts or components, you may want to make recommendations that bundle those parts with other essential components in an “all parts included” installation kit.Calculated using:
Search Click Through Rate
Measures the percentage of clicks per number of queries. This metric is a direct indicator of how well your search results align with user intent and the relevance of your content. A high CTR suggests that users find the results appealing and useful. For example, if a low search CTR occurs for searches based on the part numbers of items in the product catalog, you may need to add spelling corrections, synonyms, or recommendations for similar numbers for greater discoverability.Calculated using:
Search Conversion Rate
Measures the percentage of searches that result in a completed purchase. This metric represents the final step in the user journey from query to conversion, offering a clear indicator of overall search effectiveness and customer satisfaction. For example, if the rate is higher in one geographic region than another for certain automotive parts, determine buying patterns in other areas, and then modify items offered or promotions to improve conversions in those regions.Calculated using:
Search Exit Rate
The percentage of traffic where the customer exits the search without clicking a result, adding items to the cart, or purchasing items. For example, if a search exit rate is high for certain component specifications, it could mean information is missing, or synonyms and other rewrites are needed to return results that are more relevant, which can increase customer interest and conversions.Calculated using:
Top Performing Products
Products with the most impressions (default sort) display with the corresponding clicks, cart adds, conversions, and revenue. This metric reflects what products are being returned in search results most often and how those products perform. For example, you can boost top performing items, or bundle them with lower selling items to enhance overall conversions. For more information about how to use impressions metrics to enhance conversions, see Impressions metrics.Ranked by highest number of impressions descending.
Top Search Terms
Shows the terms or phrases searched most often over the selected time period. It also provides the corresponding click rate, cart rate, purchase rate, and revenue, helping you identify high-performing queries and trends in user interest. For example, you can create a campaign or a promotion for top search items to generate more interest and increase the potential for conversions.Ranked according to search frequency.
Total Searches
Shows the total number of searches over the selected time period. This metric highlights user engagement with the search functionality and can guide improvements in content and indexing. For example, a significant increase in searches for a particular item or service may prompt you to offer a promotion on the items searched.Calculated using:
Underperforming Products
Products with the most clicks but lowest conversions (greater than 0). Useful for identifying products that may need attention beyond superficial product information, such as description, images, reviews, and ratings. For example, an installation kit may need to be offered with detailed specifications and instructions, as well as equipment necessary to complete the installation.Ranked by total revenue ascending.
Zero Result Search Rate
Displays the average percentage of searches that returned zero results for the selected time period. This metric helps you identify gaps in content or product availability. For example, if the search percentage of zero results increases for the most powerful computer memory chip, you need to determine if the search terms need misspelling corrections, synonyms, or other rewrites. It may also mean you need to carry the products being searched, or suggest similar items your organization already carries.Calculated using:
To view global signal usage metrics for a specified date range, see Signal usage.