Managed Fusion Admin UI events are included in the Request Log Viewer dashboard.
Grafana for Managed Fusion
The course for Grafana for Managed Fusion focuses on the best practices for utilizing the Grafana dashboard.
Filter tools
Use the top level controls to apply labels, search, and filter the data by time range in each panel. Labels are similar to facets or filters. Adding a label defines the stream of logs. Adding or removing a label affects the label options available to other parameters. Use the Search control to find log data that matches the query keyword. Search is case insensitive. The queryerror matches error, Error, ERROR, and other variants of the keyword.
Set the time range controls to focus your data stream on a specific time range. For example, you can view data from the last 15 minutes or you can view a 12-hour time range from last week. For more information, see Set dashboard time range.
For more information about the components used in the Fusion Log Viewer dashboard, see the Grafana documentation on Dashboards and Panels and visualizations.
Panels
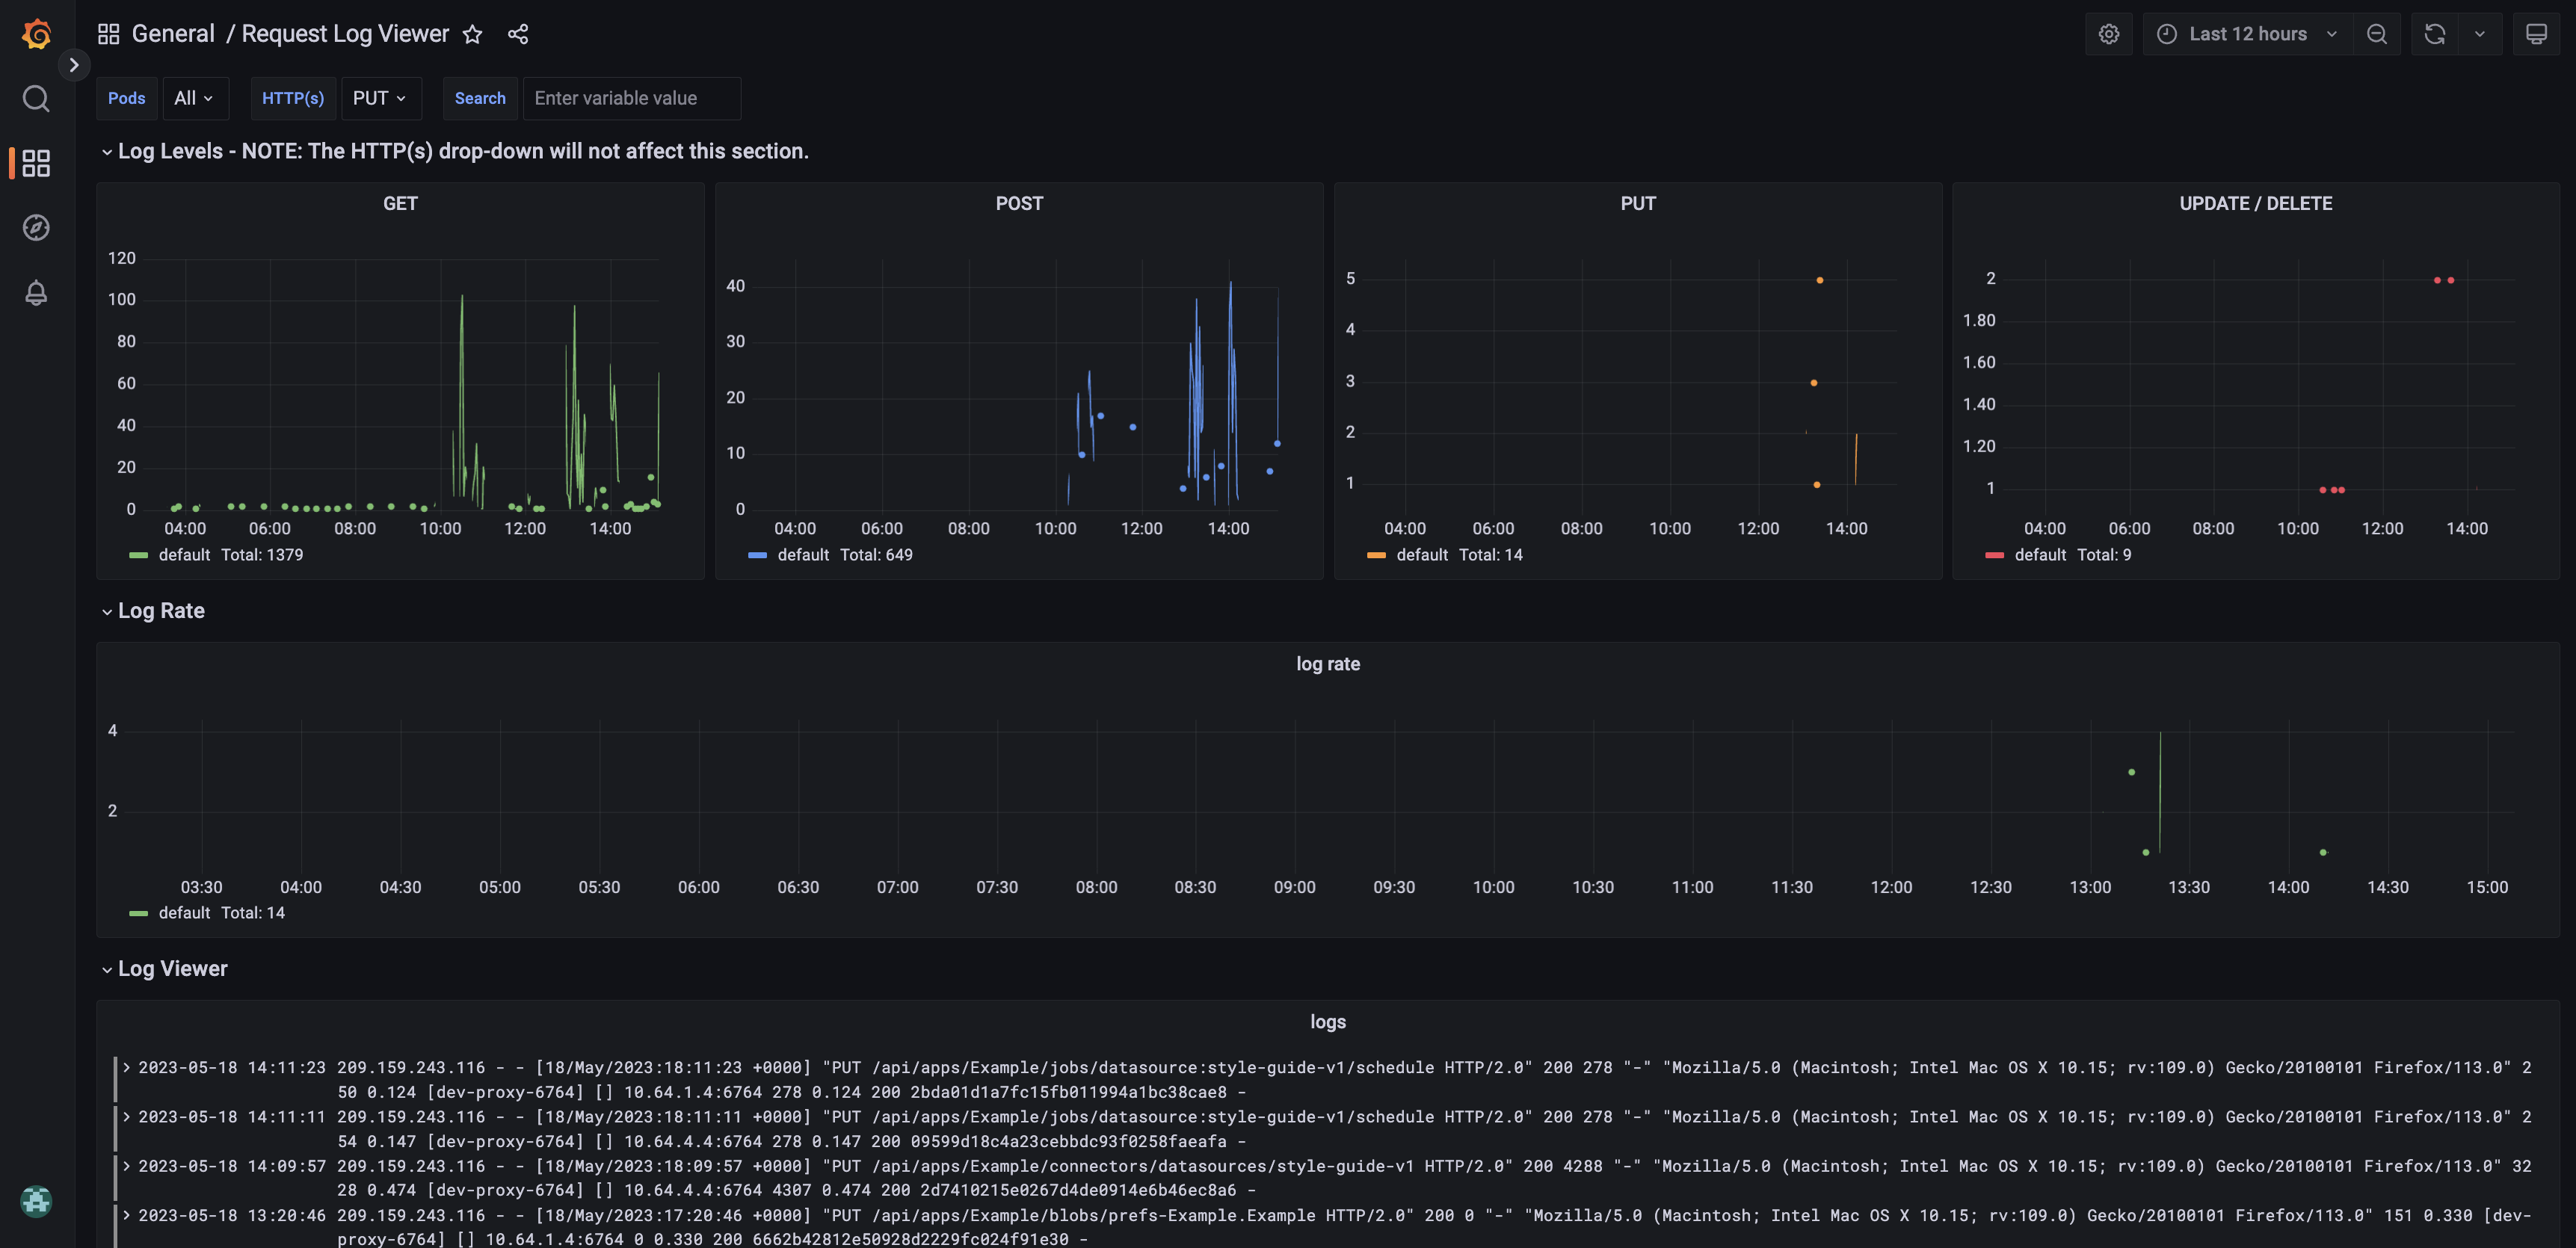
Log Levels
The panels in the Log Levels section display data about the following HTTP methods and CRUD operations:- GET. Retrieve a resource.
- POST. Create a resource.
- PUT. Replace a resource.
- UPDATE. Update a resource.
- DELETE. Delete a resource.
In the Request Log viewer, the UPDATE and DELETE operations share a panel.
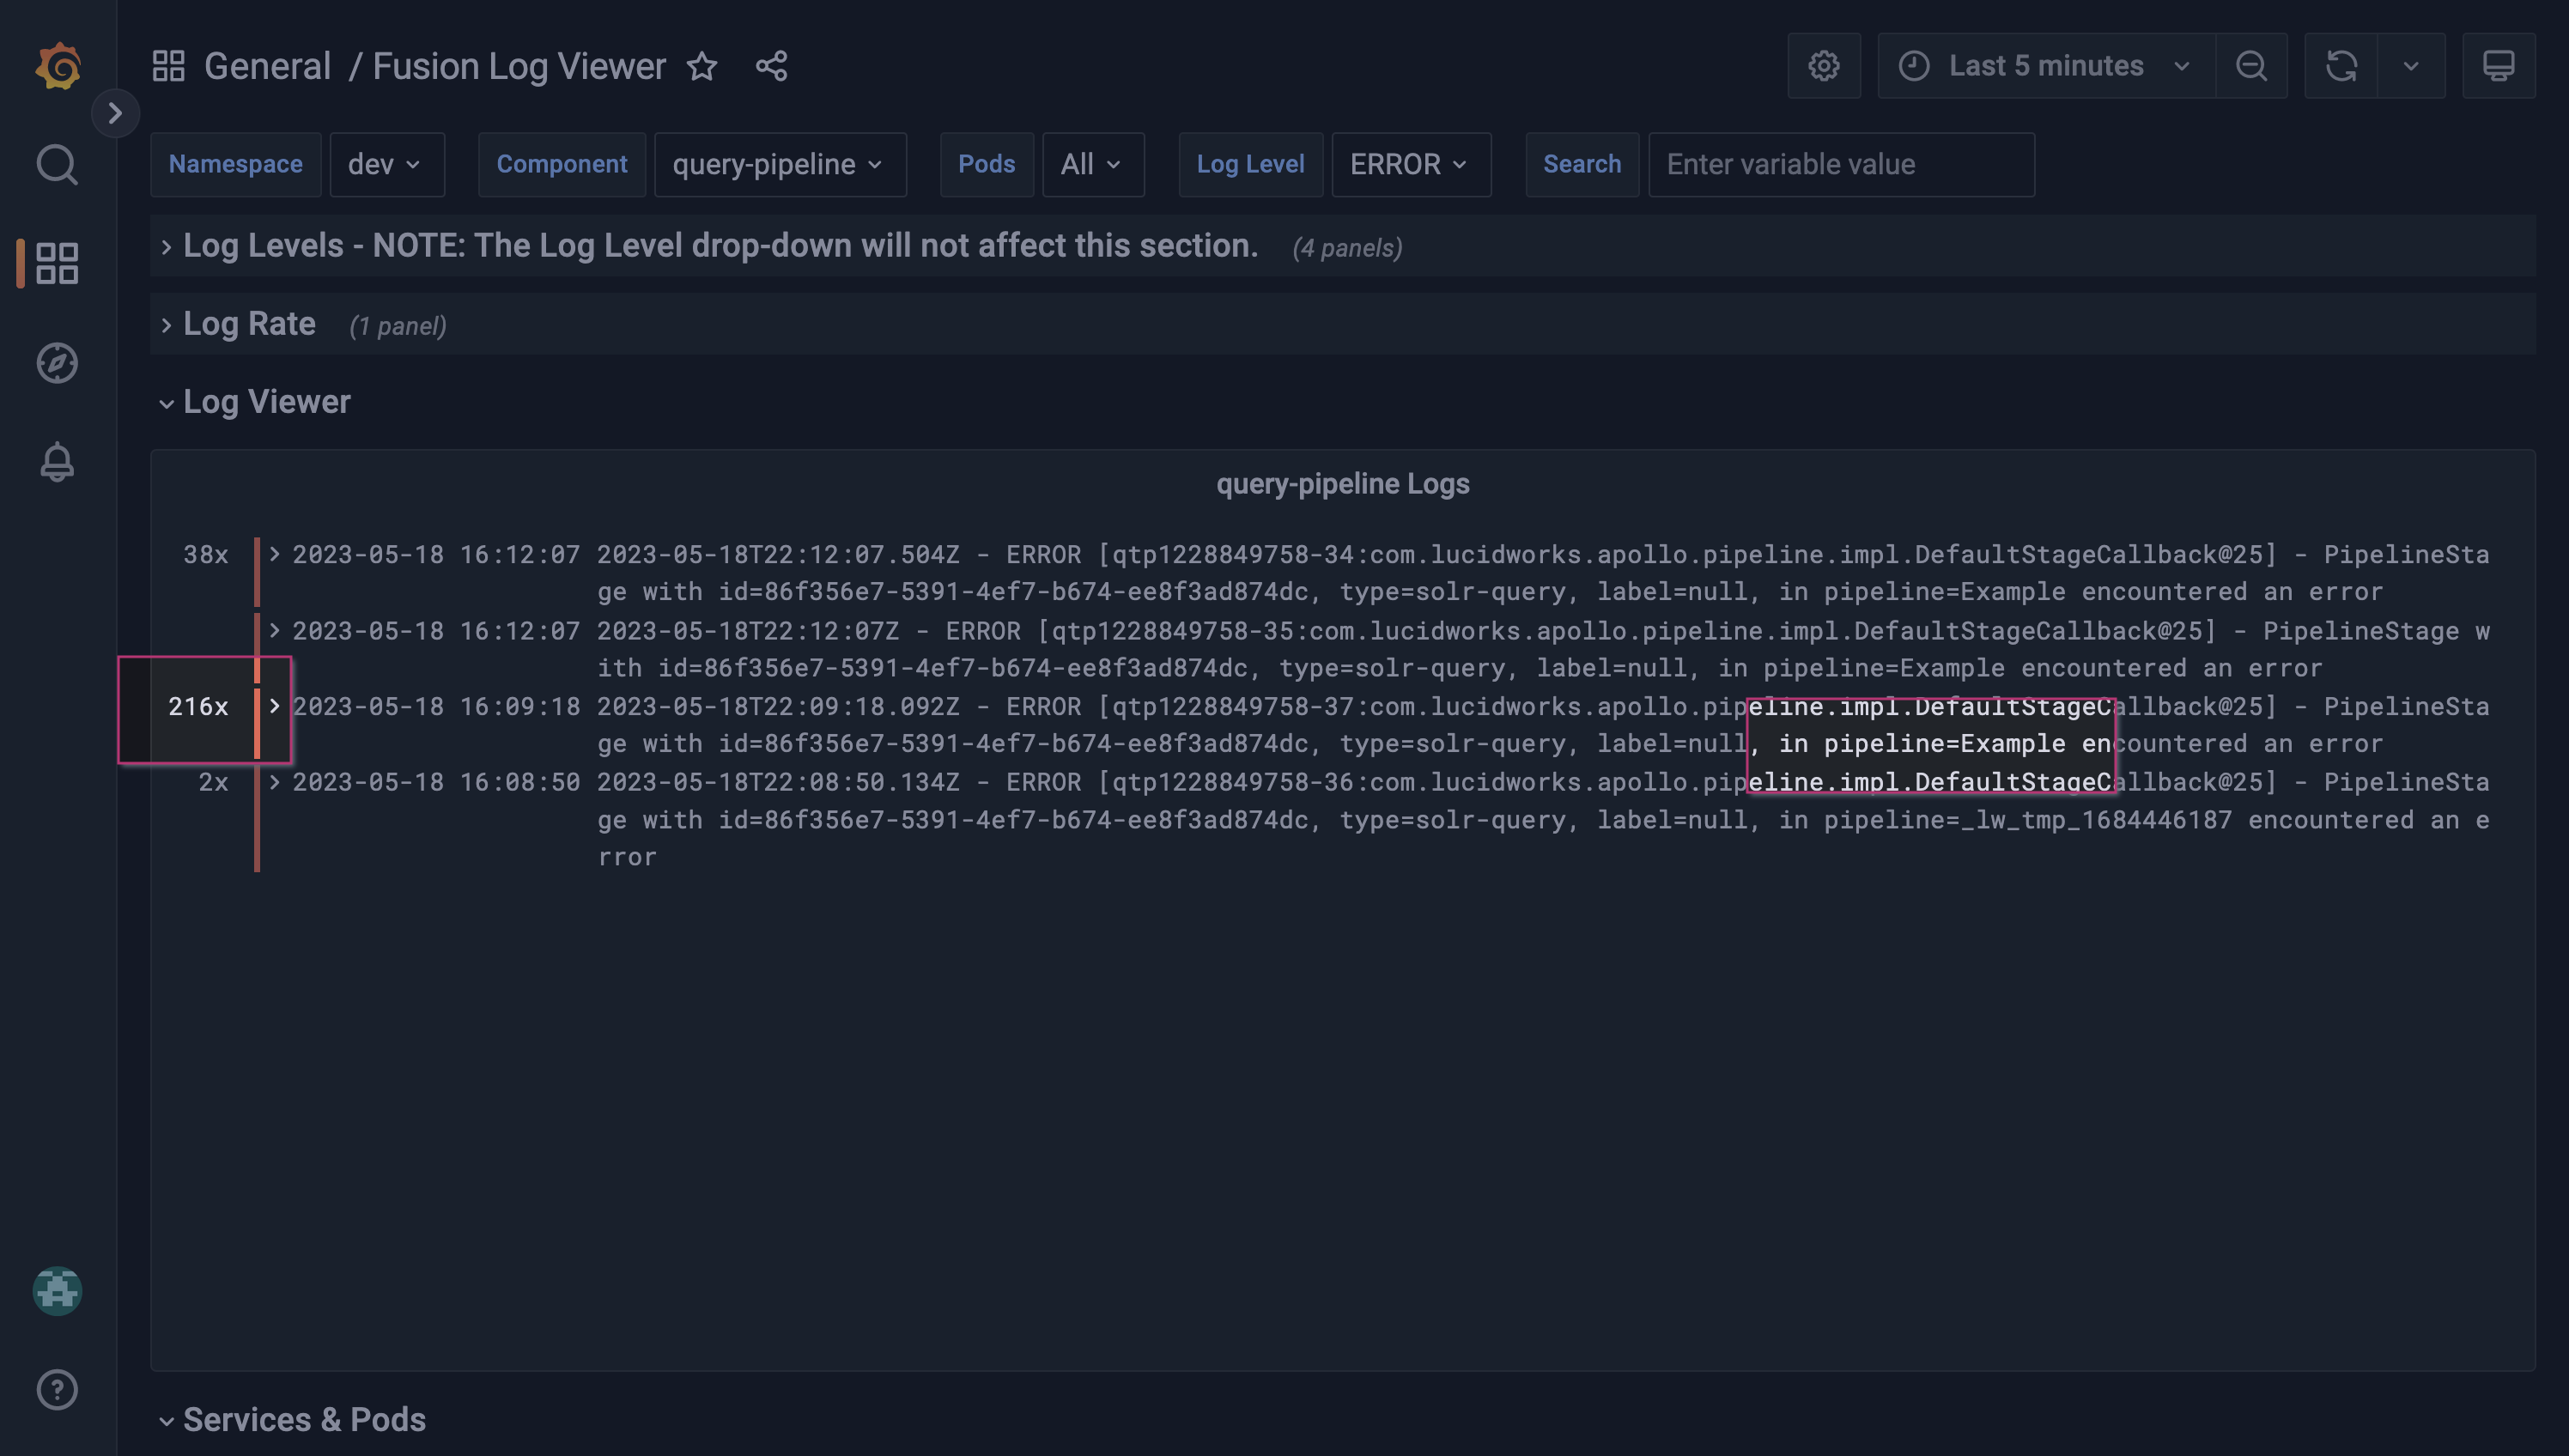
Log Viewer
The log viewer panel displays the log stream, filtered according to your label configurations. Click a log entry to view more information.Log Rate
The log rate panel displays the number of logs created by the selected components during the specified time range. This panel can help you identify the most active components and when a component creates an unusually high number of logs, which may indicate an error.Example workflow
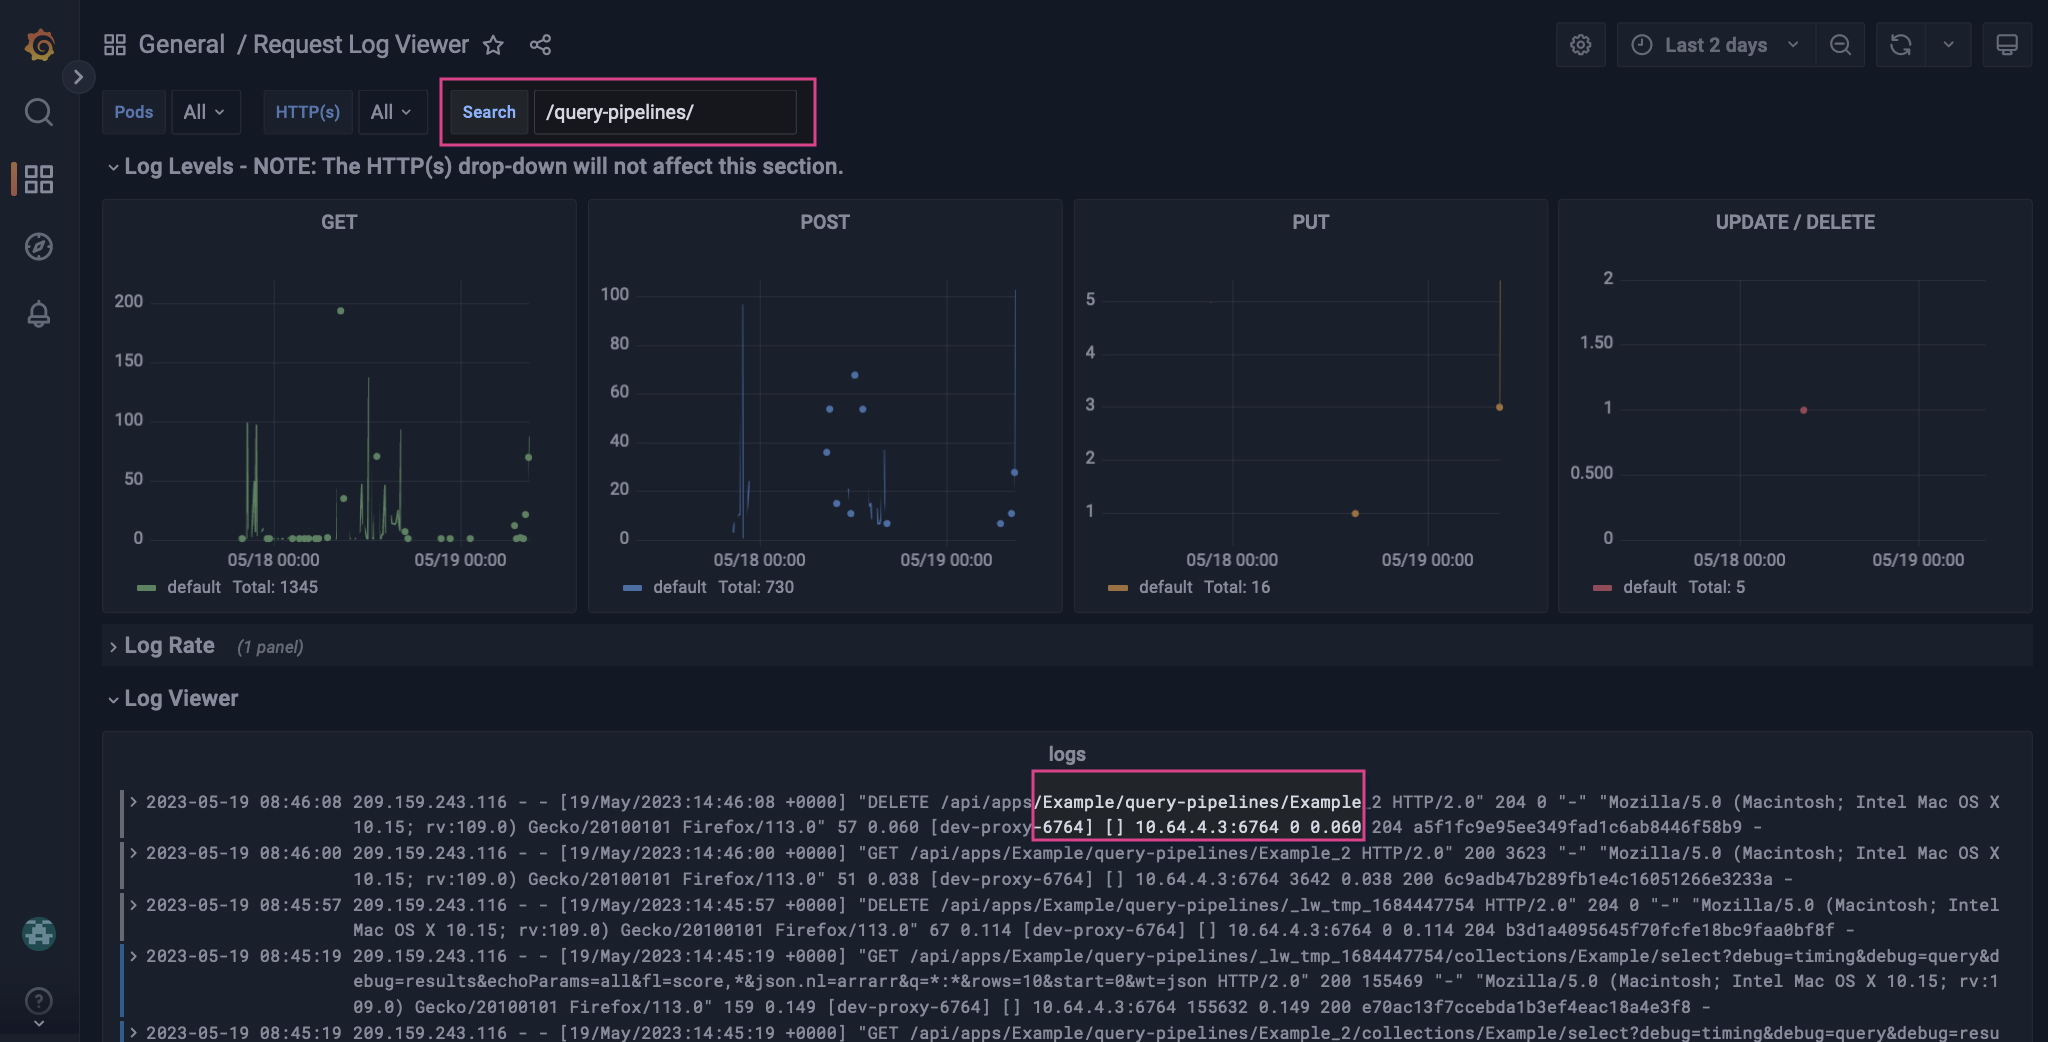
This example illustrates basic monitoring of HTTP methods and CRUD operations to learn more about recent changes to an application’s query pipelines.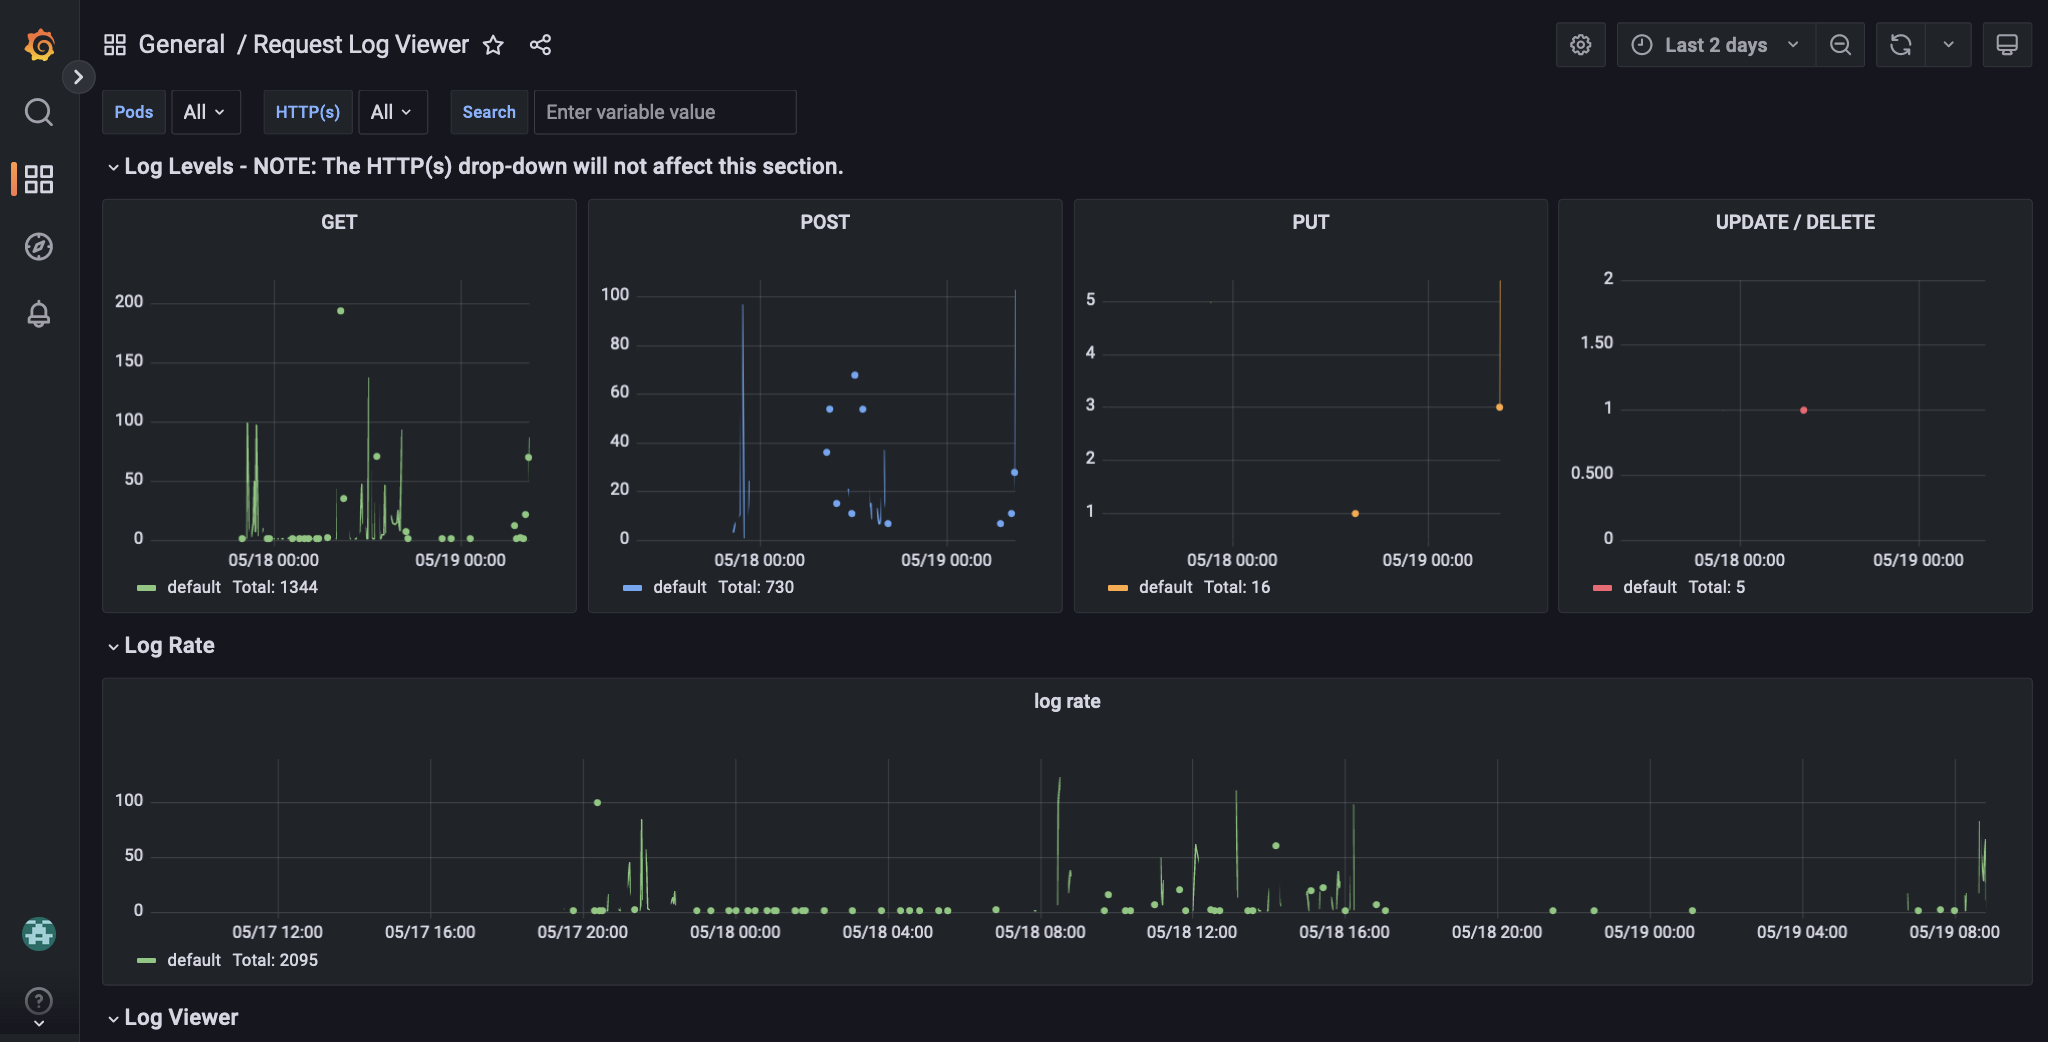
Remove some logs from the stream
The log stream includes details from all requests. To focus your log stream on API calls to the query pipeline service, add the query term/query-pipelines/. This filters the logs to show requests containing that string.
Apply an HTTP(s) label
The current stream includes all methods and operations, including GET. To focus the log stream on changes to query pipelines, apply the HTTP(s) labelPUT.
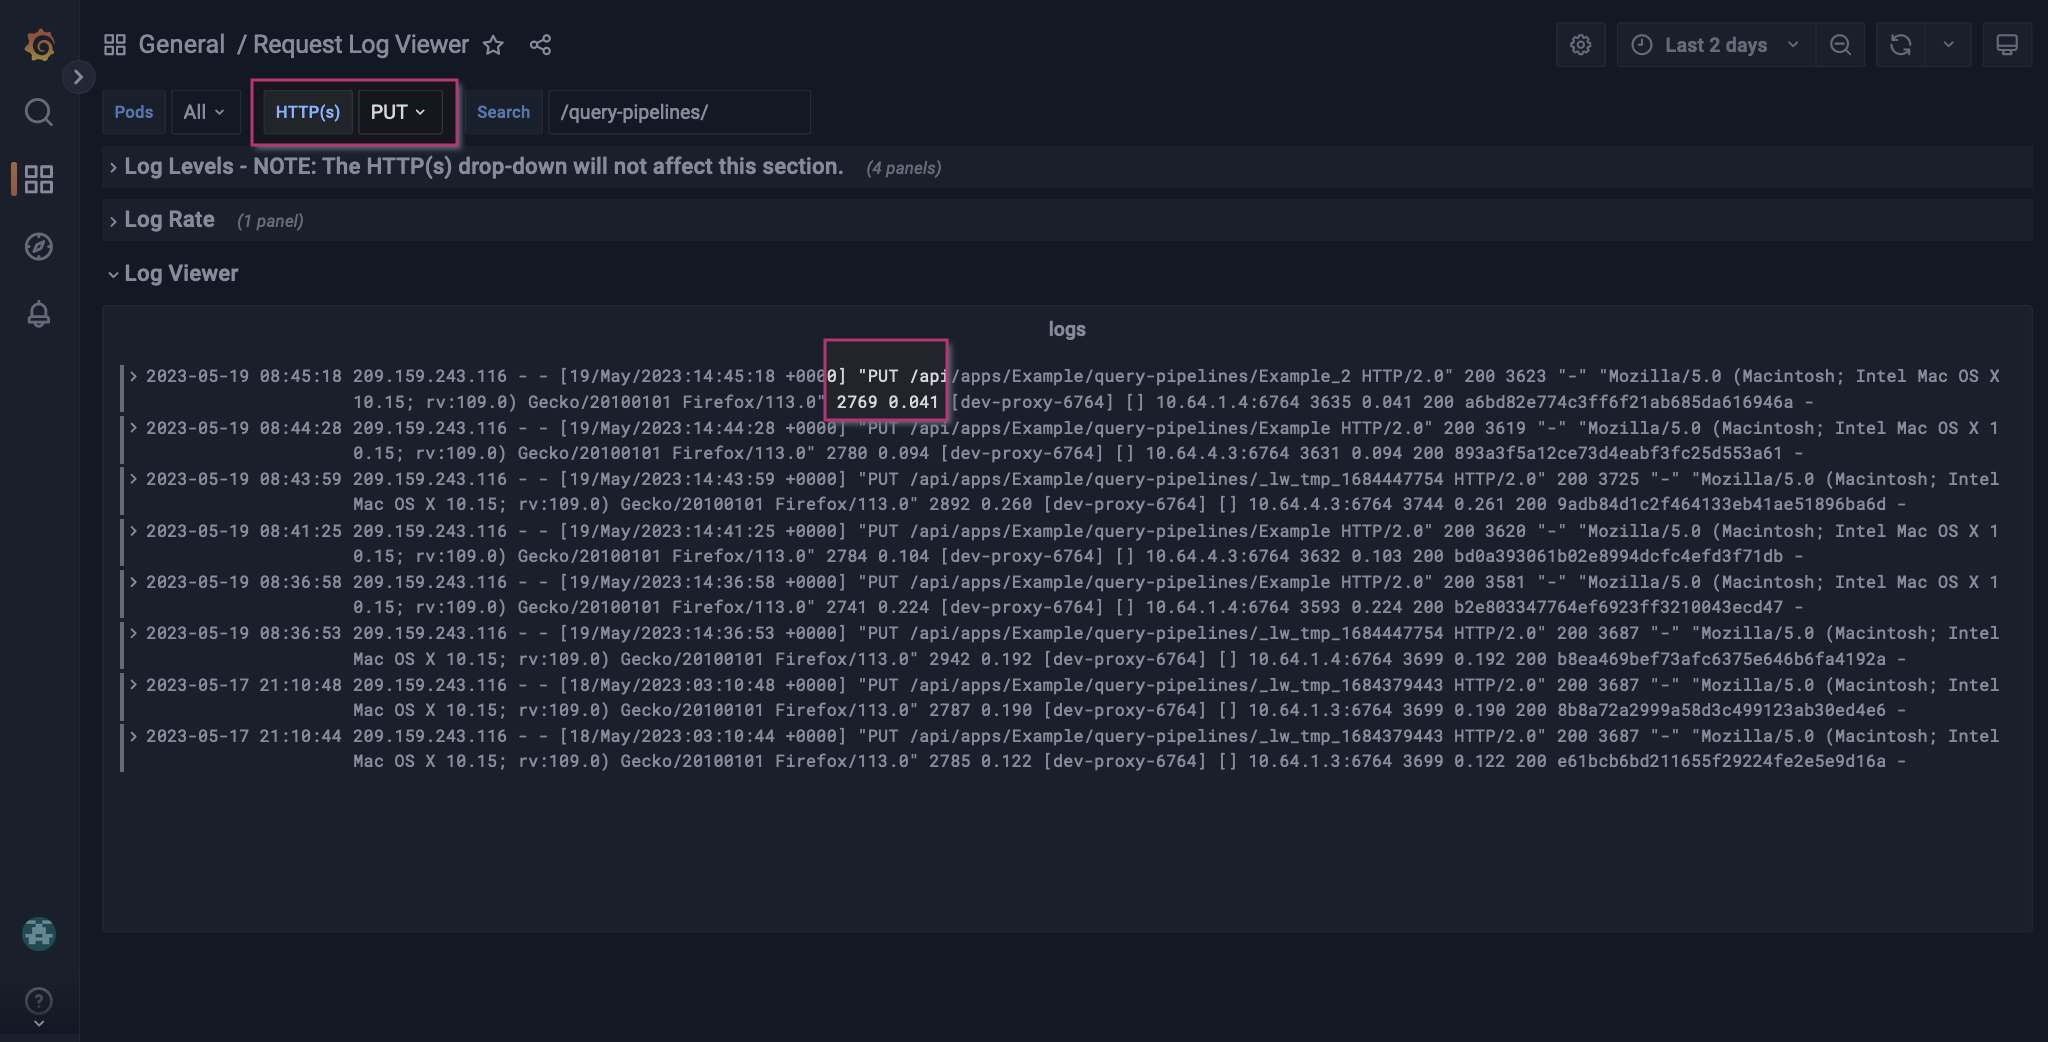
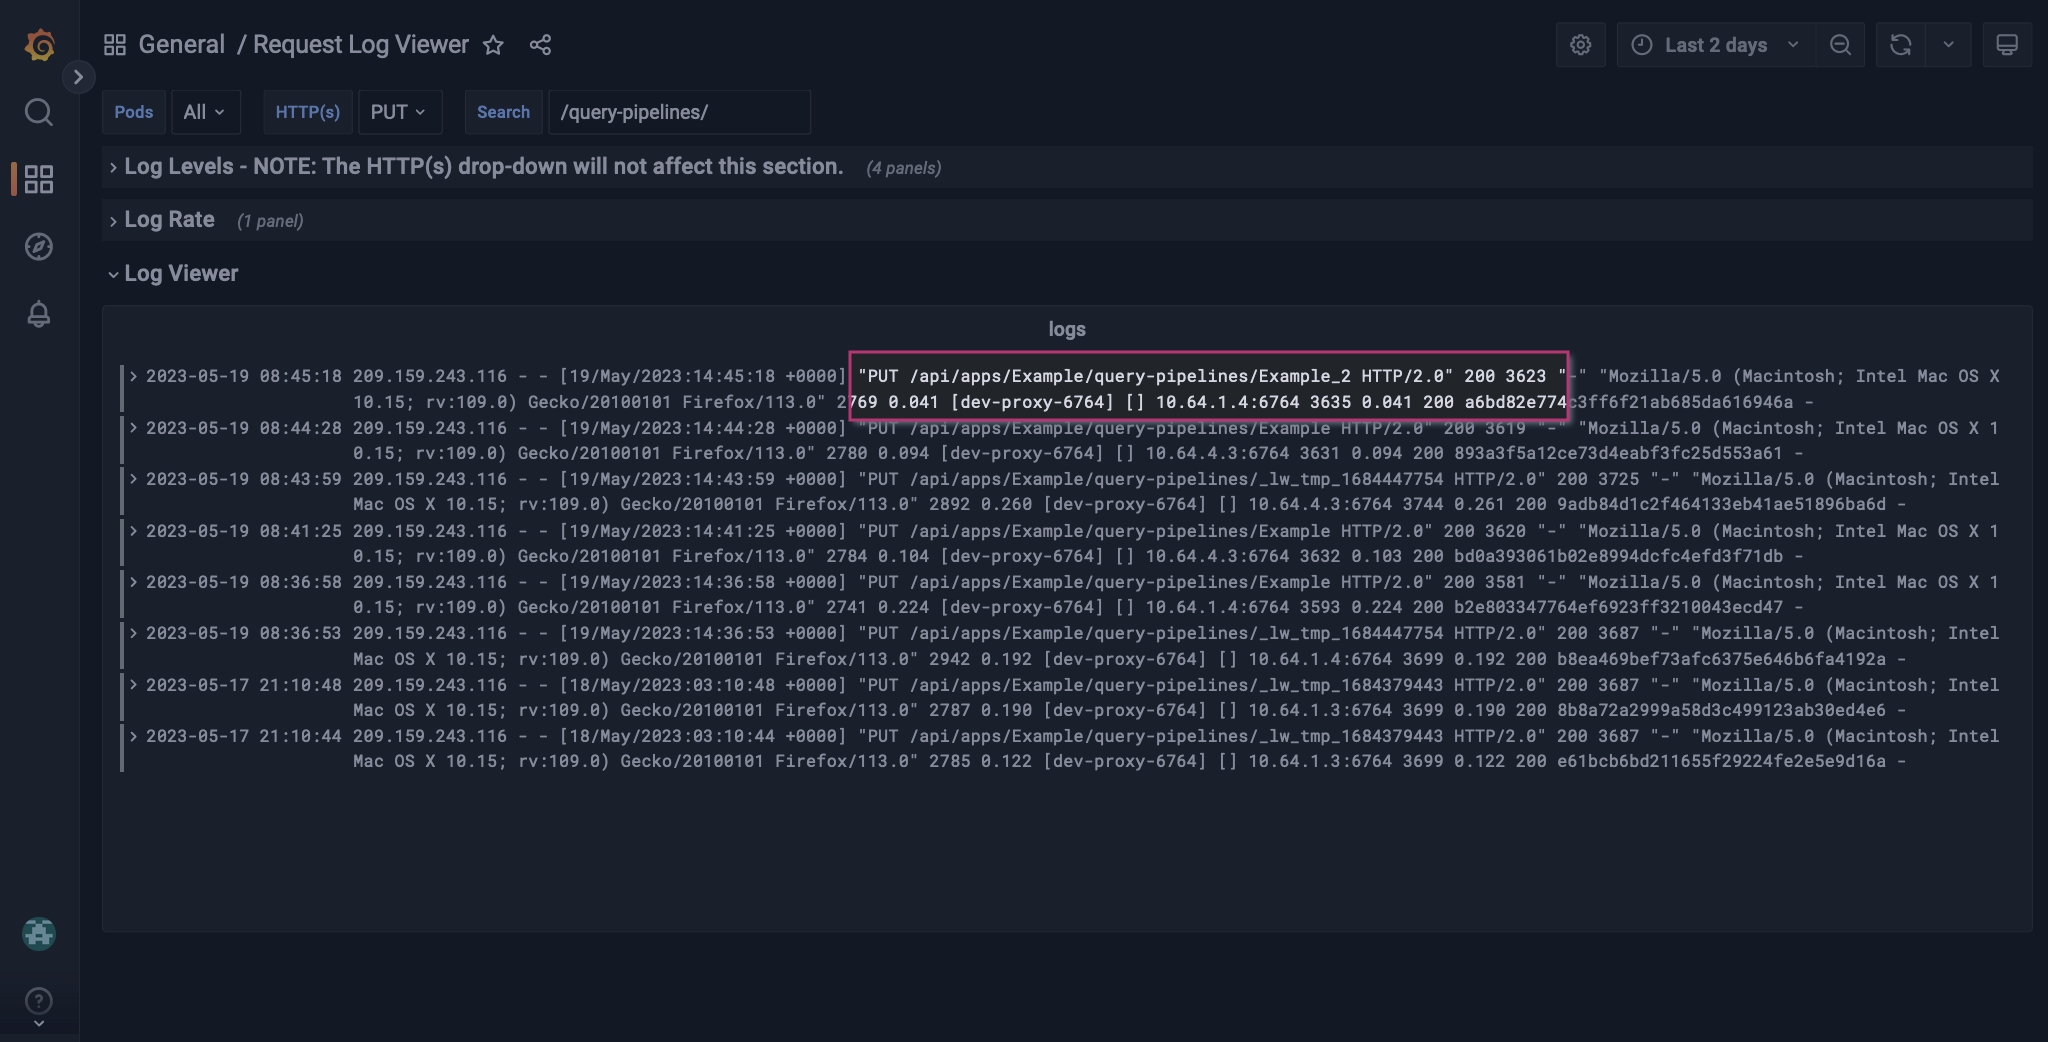
_lw_tmp indicate changes were made. The logs without the _lw_tmp indicate the changes were saved, overwriting the existing Example query pipeline configuration.
One log shows references an unknown query pipeline, Example_2. Based on your analysis, you suspect this was a temporary addition, so you need to verify it was removed.
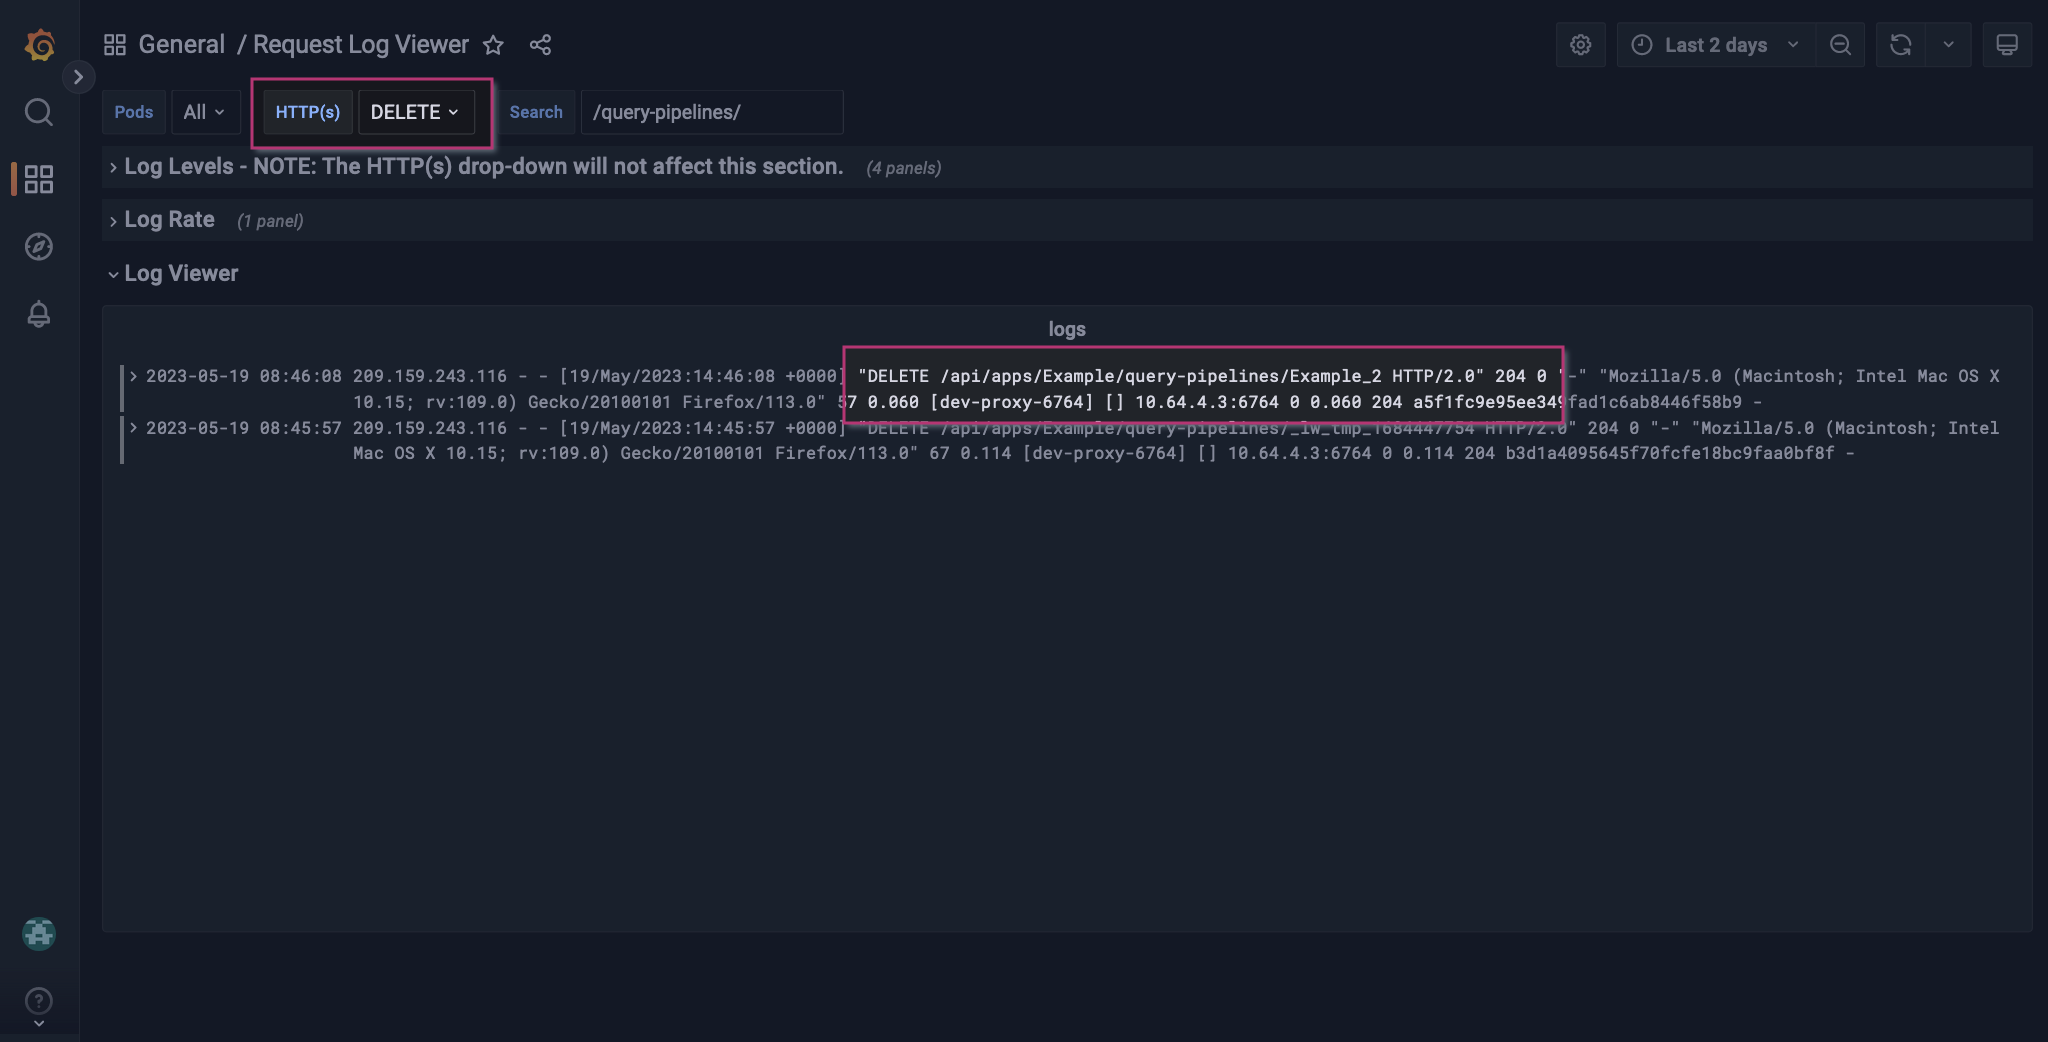
Apply a different HTTP(s) label
To verify that the temporary query pipeline was removed, change the HTTP(s) label fromPUT to DELETE.
Explore further