Grafana Loki is a log aggregation system designed to store and query logs. Loki is available for Managed Fusion deployments as part of the Prometheus and Grafana integration. It is a powerful tool that can be adapted for your unique logging requirements.
With Loki, you can define a log stream from Managed Fusion namespaces, services, pods, and more. Then, you can filter the log stream for key data, such as keyword matches for “error.”
For more information, see the Grafana’s Loki documentation.
To begin:
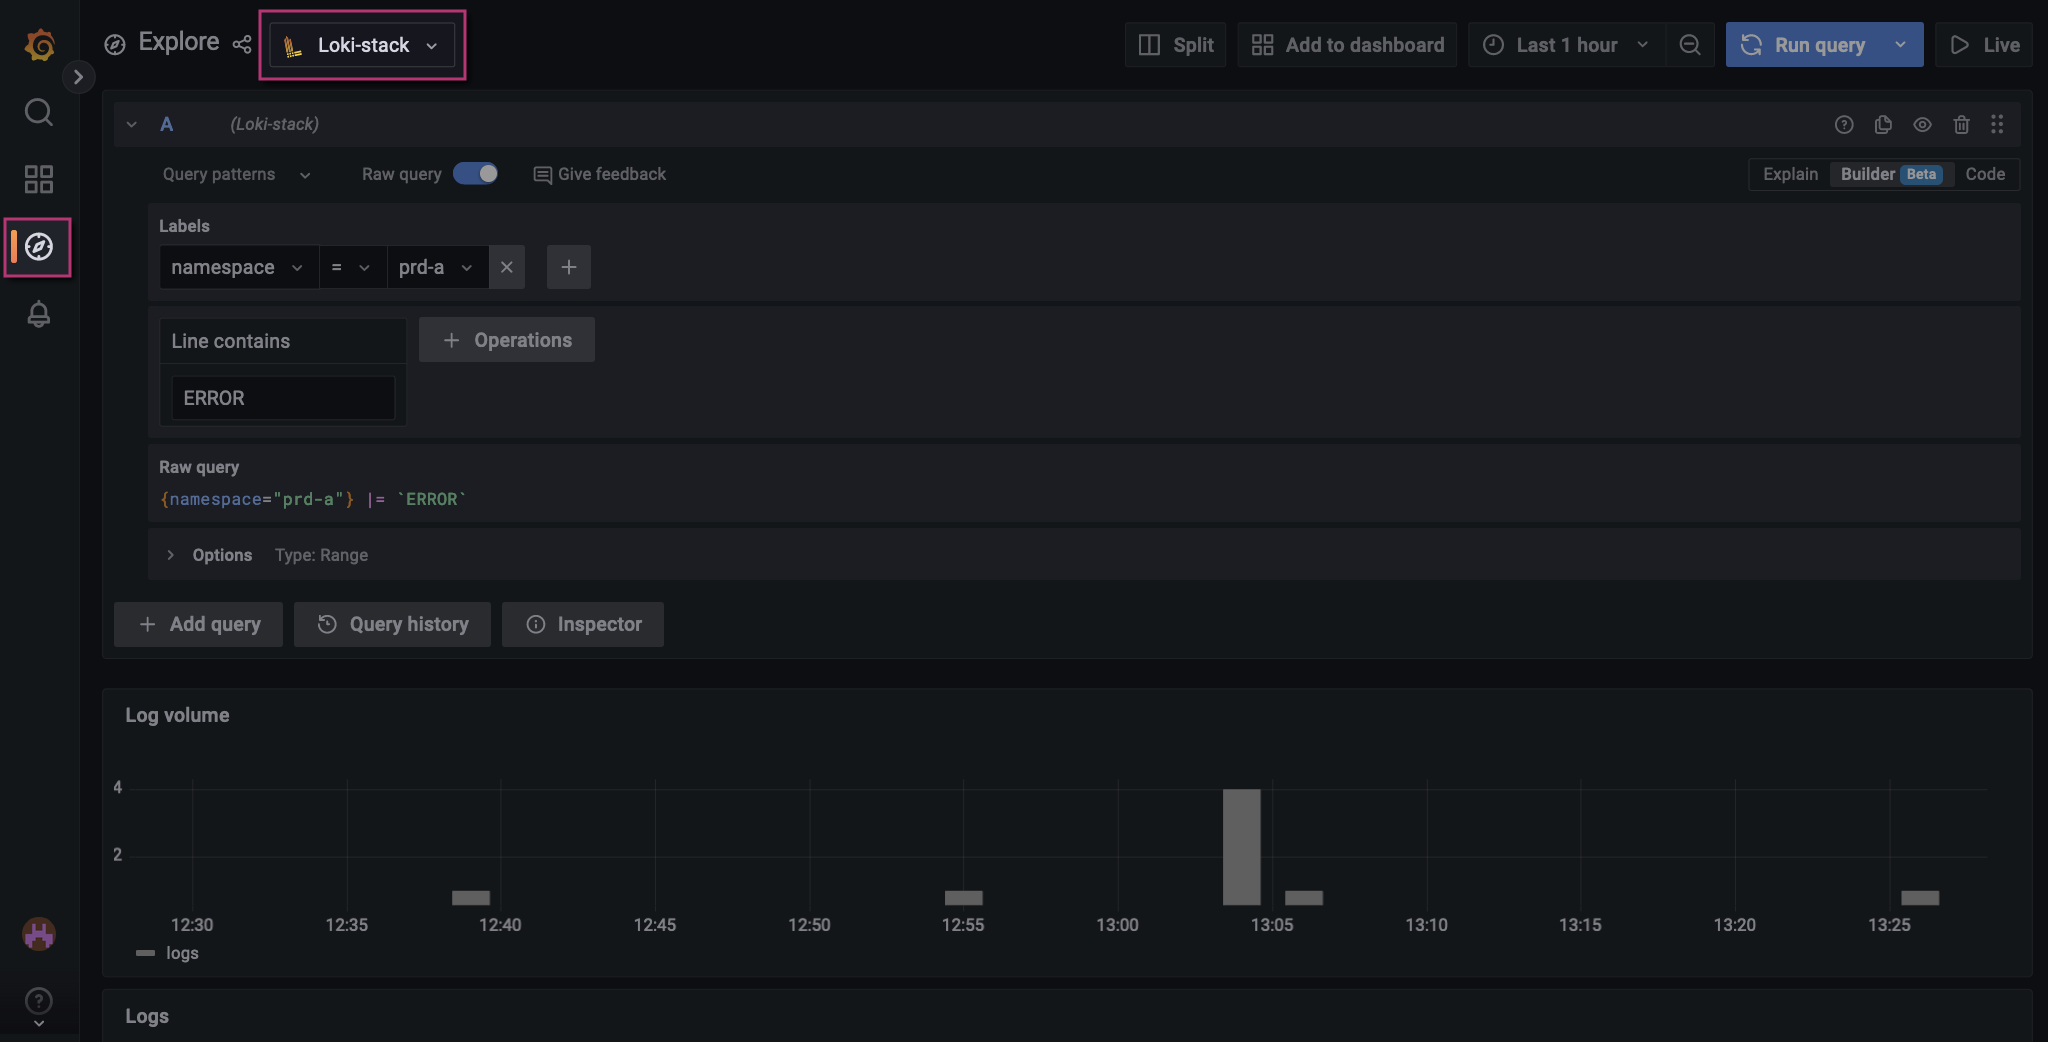
- Sign in to your Grafana environment.
- Navigate to Explore.
- Change your data source to Loki.
The name of your Loki data source may be different in your deployment.
Log exploration
Build queries in Explore using labels and operations. Labels are similar to facets or filters. Adding a label defines the stream of logs. Operations filter the stream for specific information. There are many types of operations, including aggregations, range functions, and filters. For example, you can apply a line filter to the log stream to ensure lines contain a string or match a RegEx pattern.
You can further customize the output using the Options menu.
See the following examples for common log queries you can adapt for your unique requirements. For more information on Loki queries, see Grafana’s documentation on the Loki query editor.
Try the Code toolThe examples in this article use the Builder tool. Alternatively, you can use the Code tool, which lets you build queries using LogQL. For more information, see Grafana’s documentation on LogQL. Example workflow
These examples illustrate how to build a query that drills down to your area of interest. The values are for example purposes only and may not reflect your own environmental values.
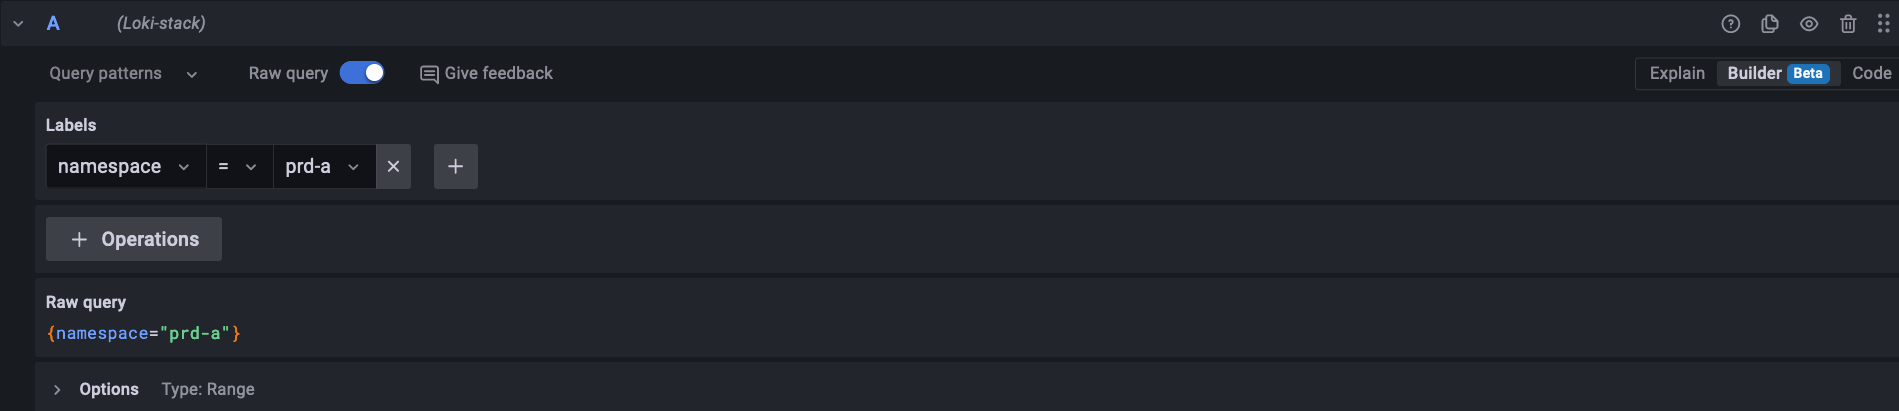
Query all logs in a namespace
Add a label to filter for logs in the production namespace, prd-a. This focuses your stream to return all logs, regardless of context.
Configuration
| Type | Field | Value |
|---|
| Label | namespace | prd-a |
Screenshot
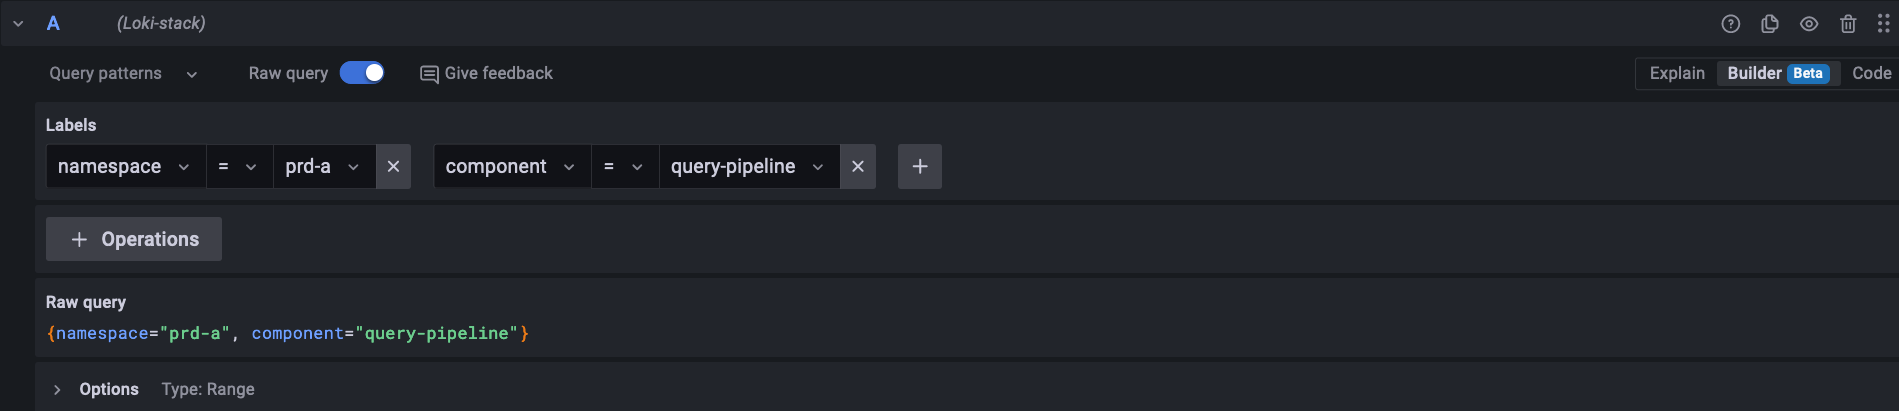
Query a specific service within the namespace
Add a label to examine logs for the Managed Fusion query pipeline service. This focuses your stream on query pipeline operations and excludes other service operations.
Configuration
| Type | Field | Value |
|---|
| Label | namespace | prd-a |
| Label | component | query-pipeline |
fusion-indexing, connector-plugin, and connectors components provide logs related to the indexing service.
FAQWhen should I use the component label instead of container?The values available for the component label are also found for container, and the logs are identical. However, component values can be used for examining logs and metrics.In general, prefer using the component label, so you can reuse the query for viewing metrics. Use the container label when you need logs for a value not associated with the component label.
Screenshot
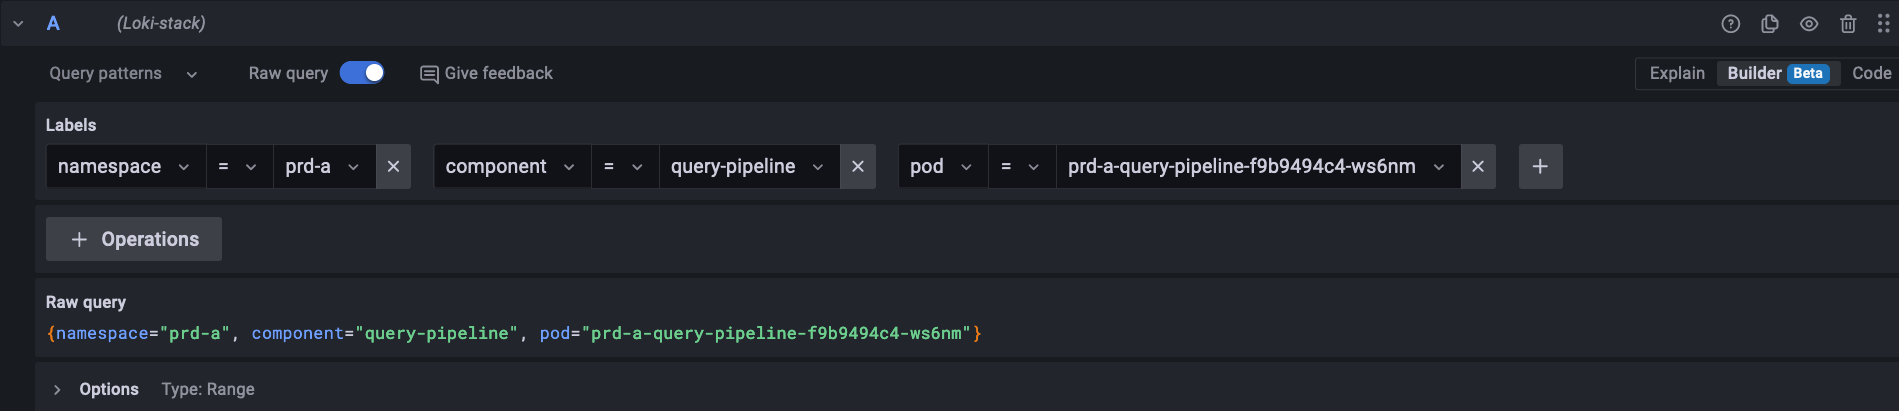
Query a specific host for the query pipeline service
Add a label to focus the stream on a specific query pipeline service host by creating the pod label and finding the host in the list.
Configuration
| Type | Field | Value |
|---|
| Label | namespace | prd-a |
| Label | component | query-pipeline |
| Label | pod | prd-a-query-pipeline-f9b9494c4-ws6nm |
Screenshot
Basic query for errors
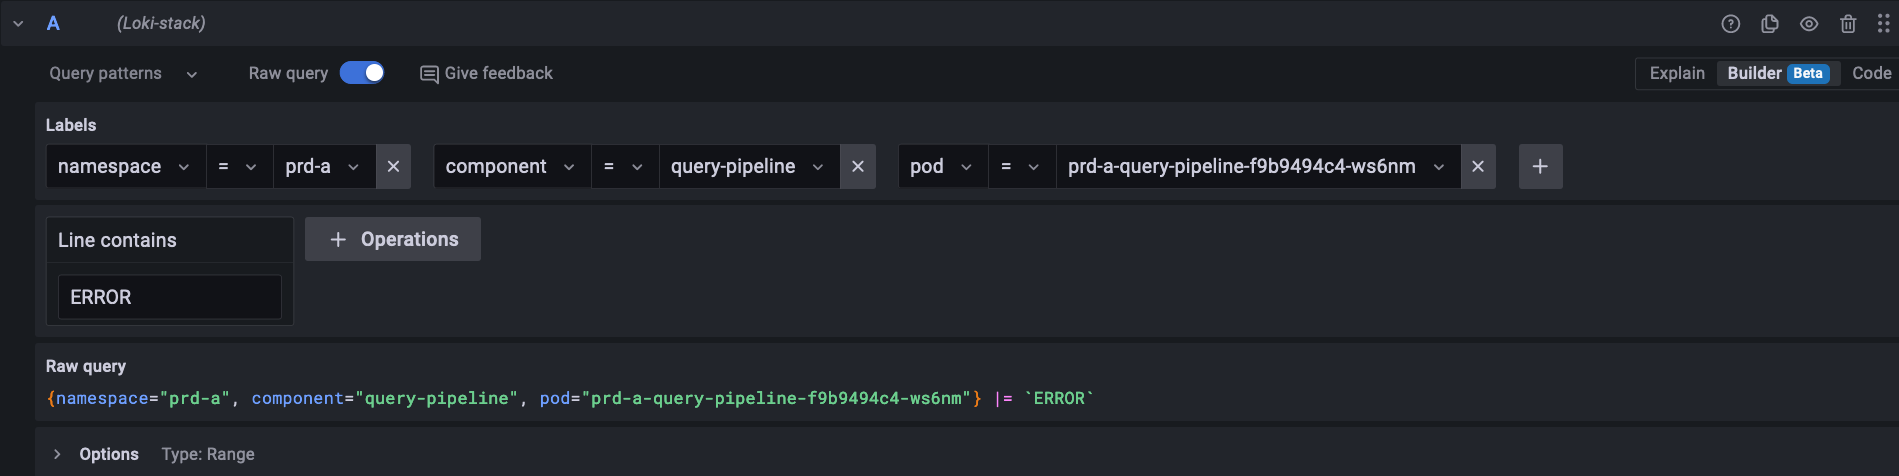
Look for errors with the query pipeline service by adding an operation that checks for lines containing the keyword “ERROR”.
Configuration
| Type | Field | Value |
|---|
| Label | namespace | prd-a |
| Label | component | query-pipeline |
| Label | pod | prd-a-query-pipeline-f9b9494c4-ws6nm |
| Operations | Line contains | ERROR |
Screenshot
Matches are case-sensitiveThe Line contains operation is case-sensitive and matches the value exactly. If you want ERROR to match the term “error” as well, use the Line contains regex match operation, and prefix the query term with (?i), which ignores the case. For example, (?i)ERROR will match “ERROR”, “error”, “Error”, and other variants.
Remove some logs from the stream
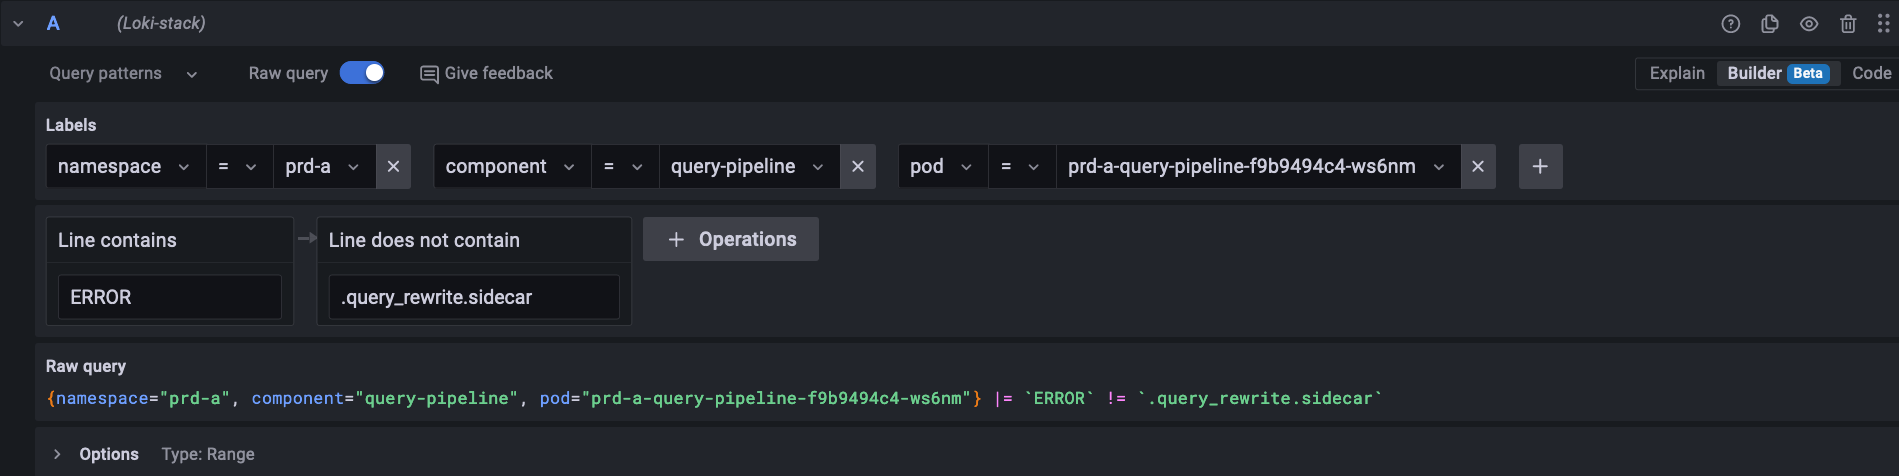
From the logs discovered so far, you may find a frequent error that you have confirmed is not the issue. That frequent error contains the text .query_rewrite.sidecar. Remove those errors from the log stream by adding a Line does not contain operation.
Configuration
| Type | Field | Value |
|---|
| Label | namespace | prd-a |
| Label | component | query-pipeline |
| Label | pod | prd-a-query-pipeline-f9b9494c4-ws6nm |
| Operations | Line contains | ERROR |
| Operations | Line does not contain | .query_rewrite.sidecar |
Screenshot
 You have now focused your log stream on a specific namespace, service, service host, and keyword, and you have removed logs irrelevant to your interests.
Analyzing logs
Once you have created a log stream and filtered it to show the logs you are interested in, you can explore individual logs.
- Locate an individual log record in the list of logs.
- Point to the log record, and a Show context option appears.
- Click Show context to launch the context modal and view more messages from the log.
- Close the modal and return to the list of logs.
- Click a log record to expand key details.
From this view, you can select:
Labels:
- Ad-hoc statistics. View how frequently the label is found in the list of logs.
- Filter for value. Add the label field and value to your query.
- Filter out value. Remove the label field and value from your query.
Detected fields:
- Ad-hoc statistics. View how frequently the label is found in the list of logs.
- Show this field instead of the message. This multi-select option replaces the title of individual logs with the selected values.
Saving Loki queries
Starred queries
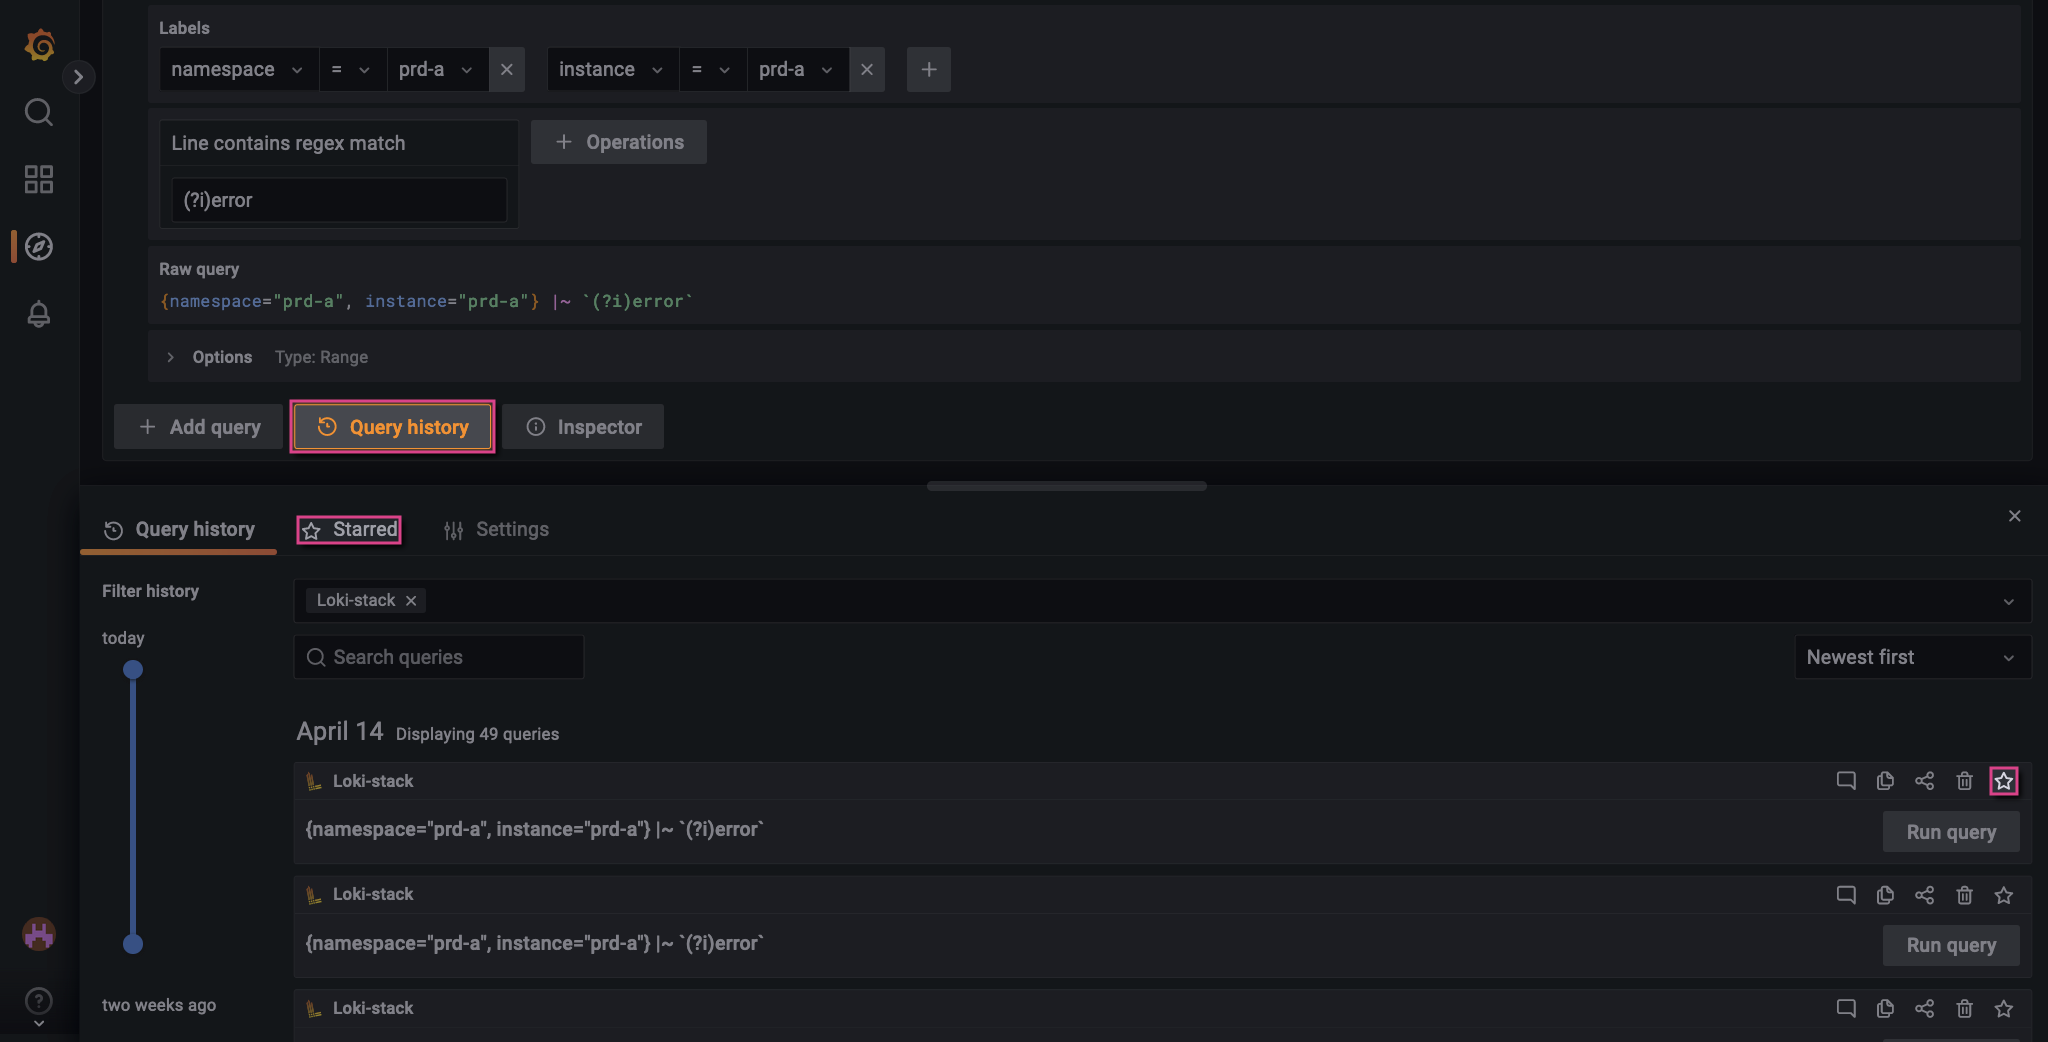 t, Loki stores your queries in Query History for 2 weeks. However, you can save queries indefinitely by clicking the star icon next to your query. These queries are found under Starred.
For more information, see Grafana’s documentation on Query history.
t, Loki stores your queries in Query History for 2 weeks. However, you can save queries indefinitely by clicking the star icon next to your query. These queries are found under Starred.
For more information, see Grafana’s documentation on Query history.
Custom dashboards
Managed Fusion deployments provide pre-configured Grafana dashboards with read-only access. Custom dashboards cannot be created.
-
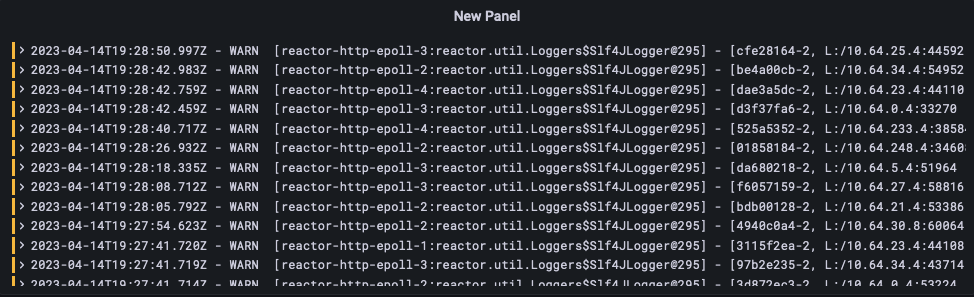
Define and run your query in the Explore UI, then click the Add to dashboard button.
-
Choose the New dashboard option, then click the Open dashboard button. Alternatively, add your query to an existing dashboard.
-
Optional: Click the new panel title, then select Edit. Edit the panel and save your changes.
-
Click the Save dashboard button.