Description
The chart gauge directive generates a gauge, you can also use the chart export and chart credit directives to add this functionality to your gauge.Usage
as element:Directive info
- This directive creates new scope.
Parameters
| Param | Type | Details |
|---|---|---|
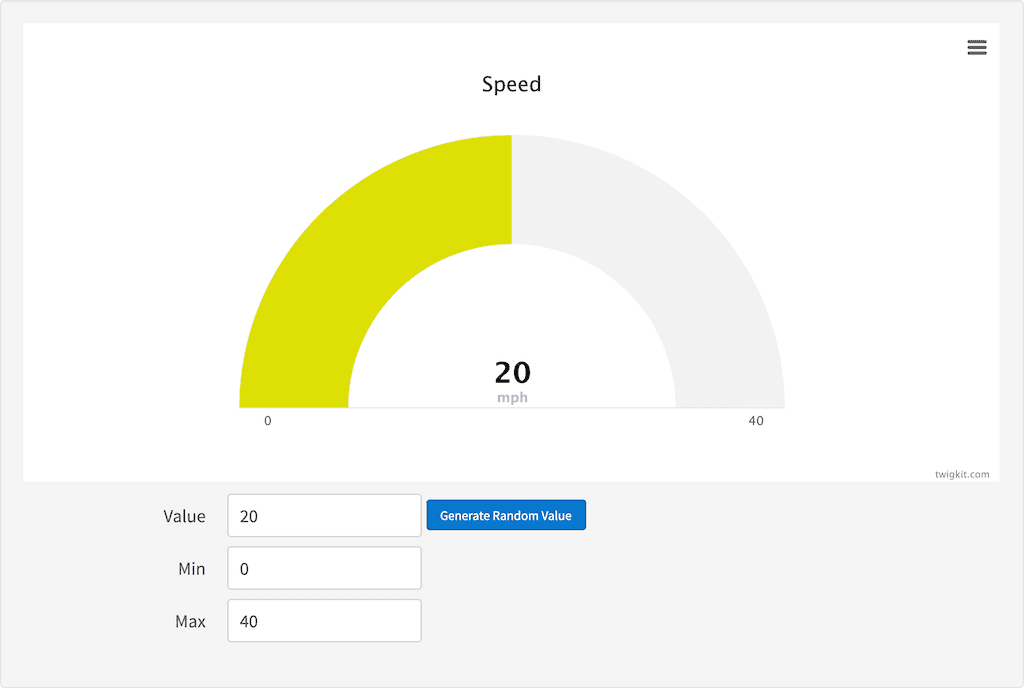
| value | number | Value to be displayed on the gauge. |
| min | number | The smallest number that can be displayed on the gauge. |
| max | number | The highest number that can be displayed on the gauge. |
| stops (optional) | array | The colours to render at each stop measured from 0 to 1. Default [ [0.1, ‘#DF5353’], // red [0.5, ‘#DDDF0D’], // yellow [0.9, ‘#55BF3B’] // green ] |
| title (optional) | string | The title of the chart. |
| value-suffix (optional) | string | Suffix for the value on the gauge. |
| height (optional) | string | Chart height. Default:400 (400px but px is not required!) |
| options (optional) | object | Extend the current options. Options can be found here. |
Example
Source
Result