Perform head/tail analysis of queries from collections of raw or aggregated signals, to identify underperforming queries and the reasons. This information is valuable for improving overall conversions, Solr configurations, auto-suggest, product catalogs, and SEO/SEM strategies, in order to improve conversion rates.Documentation Index
Fetch the complete documentation index at: https://doc.lucidworks.com/llms.txt
Use this file to discover all available pages before exploring further.
This job is deprecated in Fusion 5.9.15 and will be removed in a future release.
Lucidworks recommends migrating to Neural Hybrid Search, which achieves superior relevance compared to legacy machine learning methods.
Resolving Underperforming Queries
The course for Resolving Underperforming Queries focuses on tips for tuning, running, and cleaning up Fusion’s query rewrite jobs.
| Default job name | COLLECTION_NAME_head_tail |
| Input | Raw or aggregated signals (the COLLECTION_NAME_signals or COLLECTION_NAME_signals_aggr collections by default) |
| Output | ● Rewrites for underperforming queries (the _query_rewrite_staging collection by default)● Analytics tables (the COLLECTION_NAME_job_reports collection by default) |
| query | count_i | type | timestamp_tdt | user_id | doc_id | session_id | fusion_query_id | |
|---|---|---|---|---|---|---|---|---|
| Required signals fields: | ✅ | ✅ | ✅ |
A minimum of 10,000 signals is required to successfully run this job.
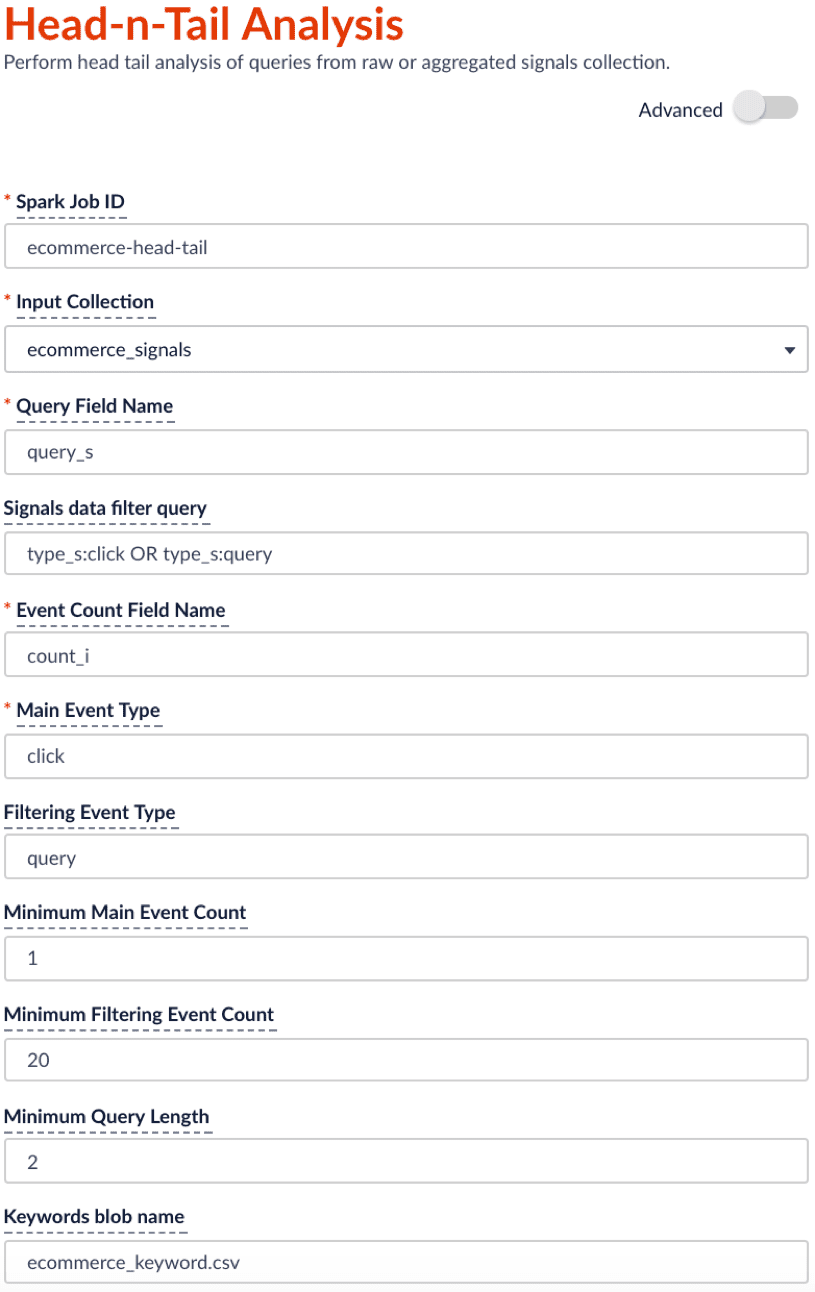
Head/tail analysis configuration
The job configuration must specify the following:- The signals collection (the Input Collection parameter)
Signals can be raw (theCOLLECTION_NAME_signalscollection) or aggregated (the_signals_aggrcollection). - The query string field (the Query Field Name parameter)
- The event count field
For example, if signal data follows the default Fusion setup, thencount_iis the field that records the count of raw signals andaggr_count_iis the field that records the count after aggregation.
- The main event (the
mainType/Main Event Type parameter) - The filtering/secondary event (the
filterType/Filtering Event Type parameter)
If you only have one event type, leave this parameter empty.
The suggested schedule for this head-n-tail analysis job is to run bi-weekly or monthly. You can change schedule under the run panel.
Job output
By default, the output collection is the<input-collection>_job_reports collection. The head/tail job adds a set of analytics results tables to the collection. You can find these table names in the doc_type_s field of each document:
overall_distributionsummary_statqueries_orderedtokens_orderedqueryLengthtail_reasonstail_rewriting
- In the Fusion workspace, navigate to Analytics > App Insights.
The App Insights dashboard appears. - On the left, click Analytics .
- Under Standard Reports, click Head Tail analysis.
The Head/Tail Analysis job output tables appear. These are described in more detail below.
Head/Tail Plot (overall_distribution)
This head/tail distribution plot provides an overview of the query traffic distribution. In order to provide better visualization, the unique queries are in descending order based on traffic and put into bins of 100 queries on the x axis, with the sum of traffic coming from each bin on the y axis.
For example, the head/tail distribution plot below shows a long tail, indicating that the majority of queries produce very little traffic. The goal of analyzing this data is to shorten that tail, so that a higher proportion of your queries produce traffic.
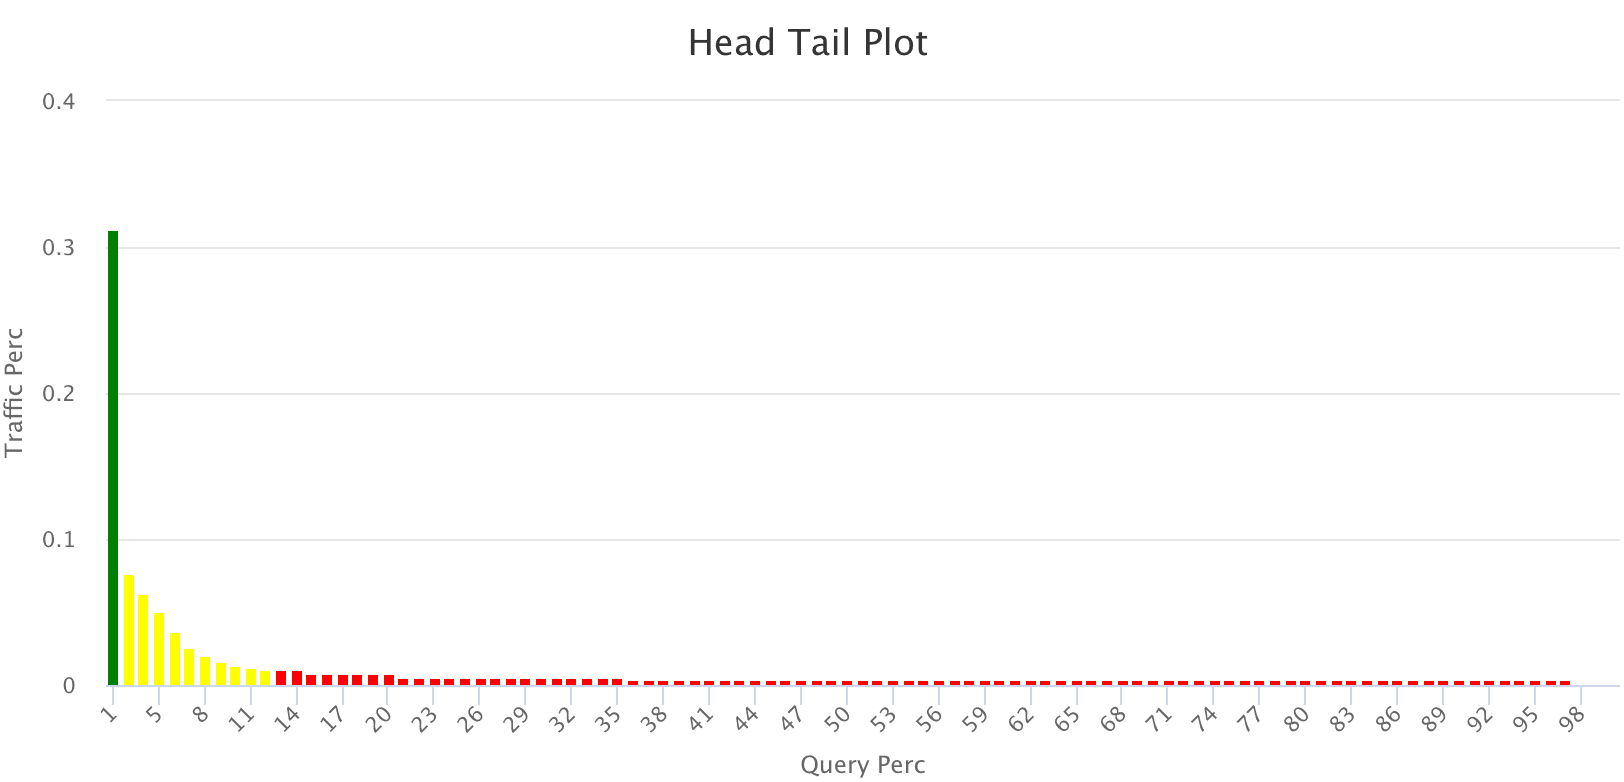
- Green = head
- Yellow = torso
- Red = tail
Summary Stats (summary_stat)
This user-configurable summary statistics table shows how much traffic is produced by various query groups, to help understand the head/tail distribution.
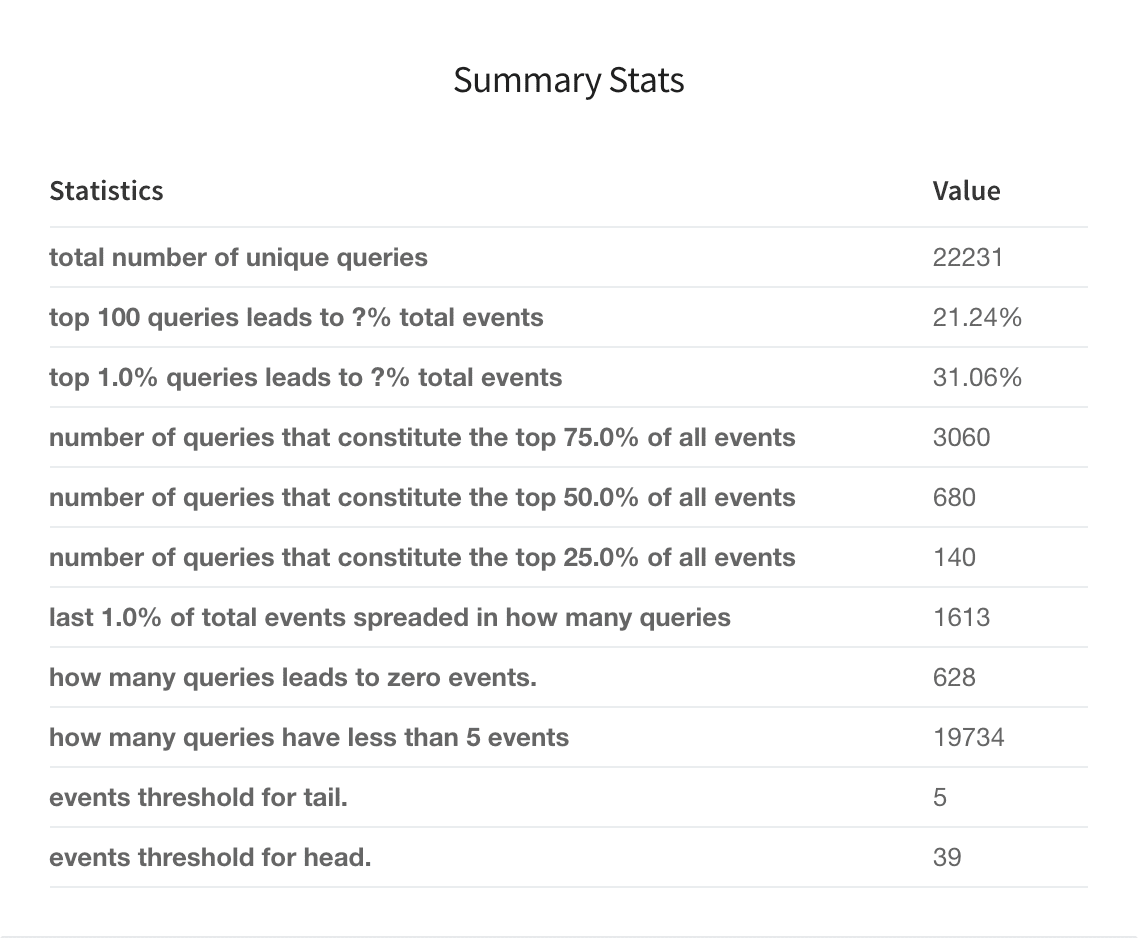
- Top X% Head Query Event Count (
topQ) - Number of Queries that Constitute X% of Total Events (
trafficPerc) - Bottom X% Tail Query Event Count (
lastTraffic) - Event Count Computation Threshold (
trafficCount)
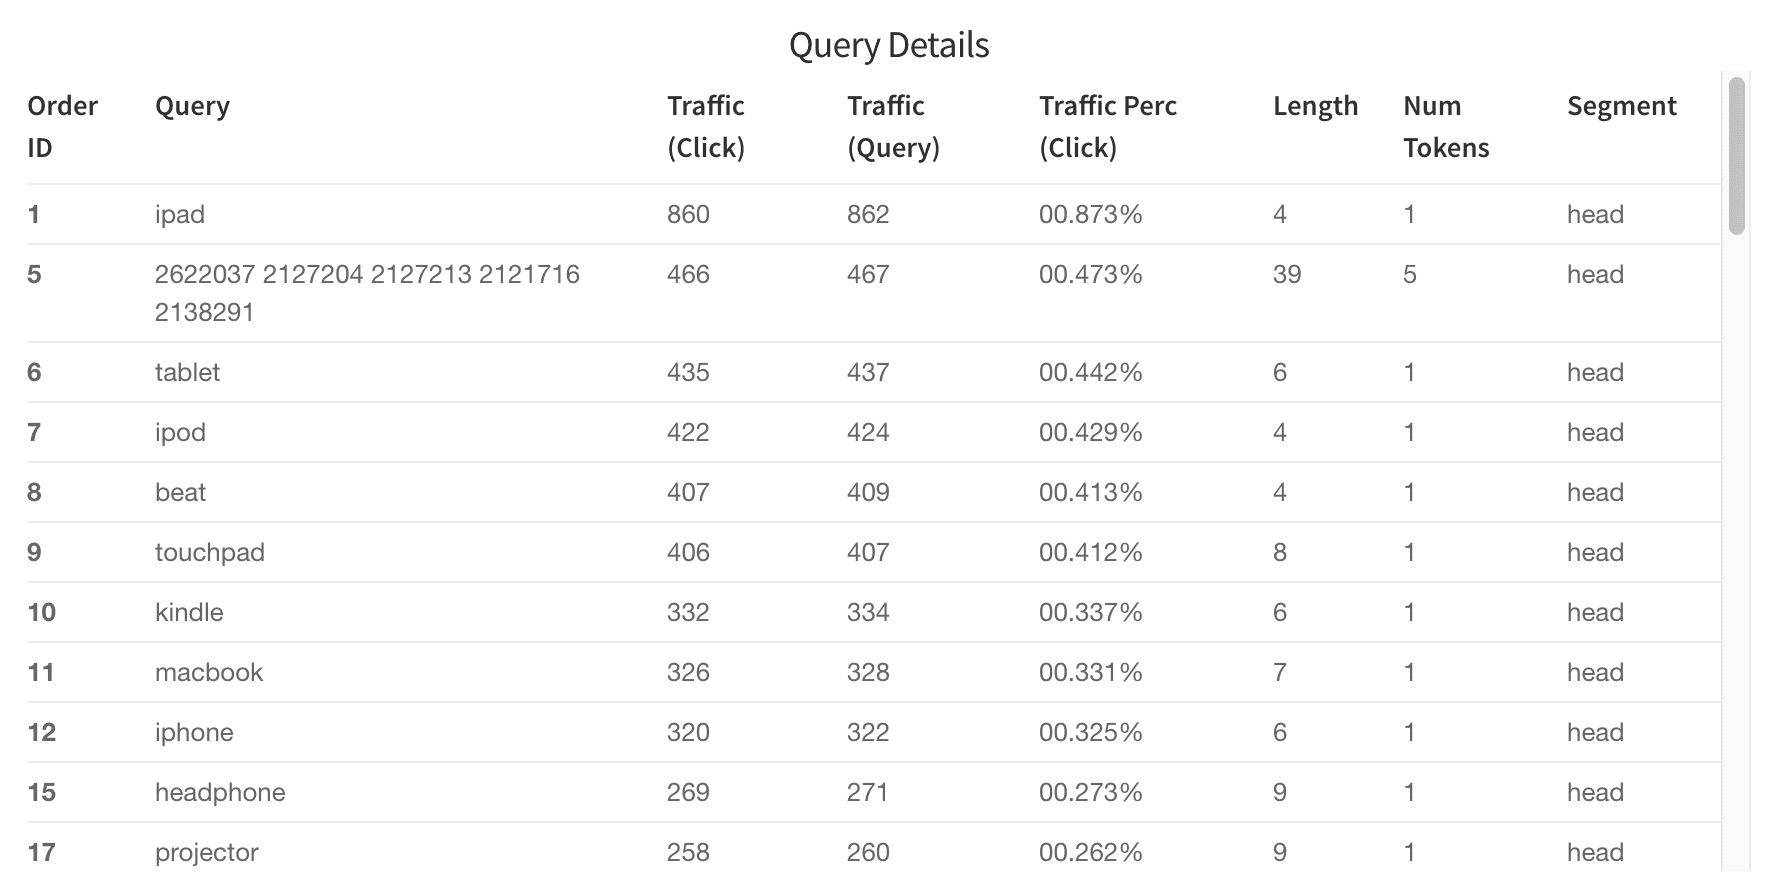
Query Details (queries_ordered)
The Query Details table helps you discover which queries are the best performers and which are worst. You can filter results by issuing a search in the search bar. For example, search “segment_s:tail” to get tail queries or search “num_events_l:0” to get zero results queries. (Note: field names are listed in the “what is this” toolkit).
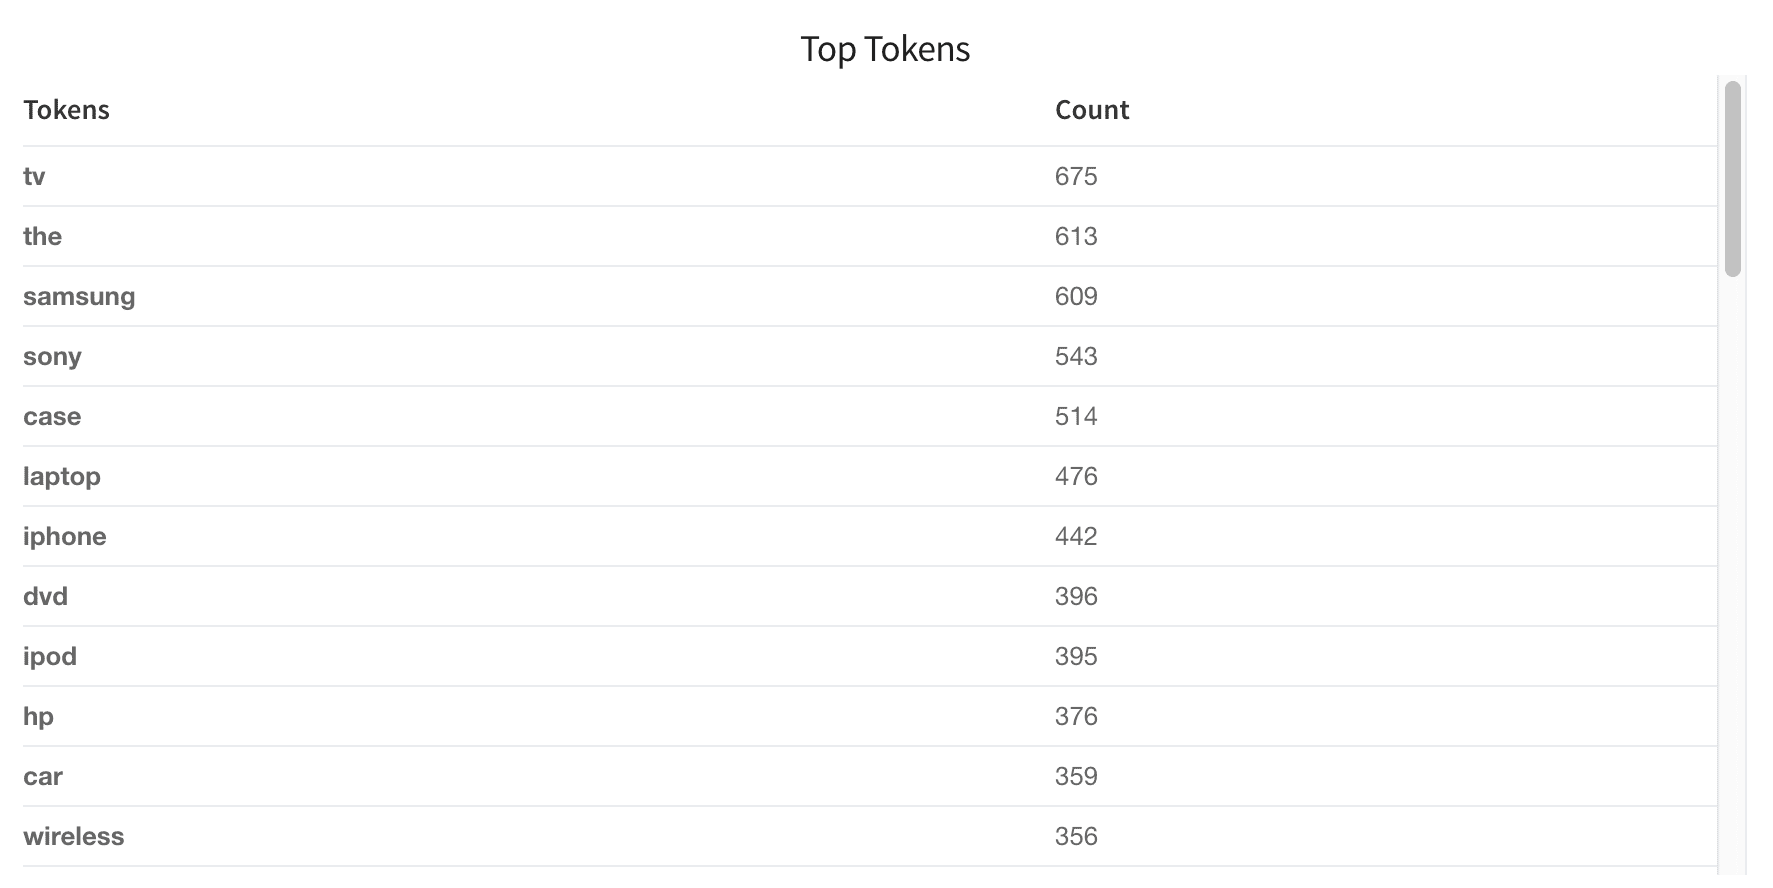
Top Tokens (tokens_ordered)
The “Top Tokens” table lists the number of times each token shown in the queries.
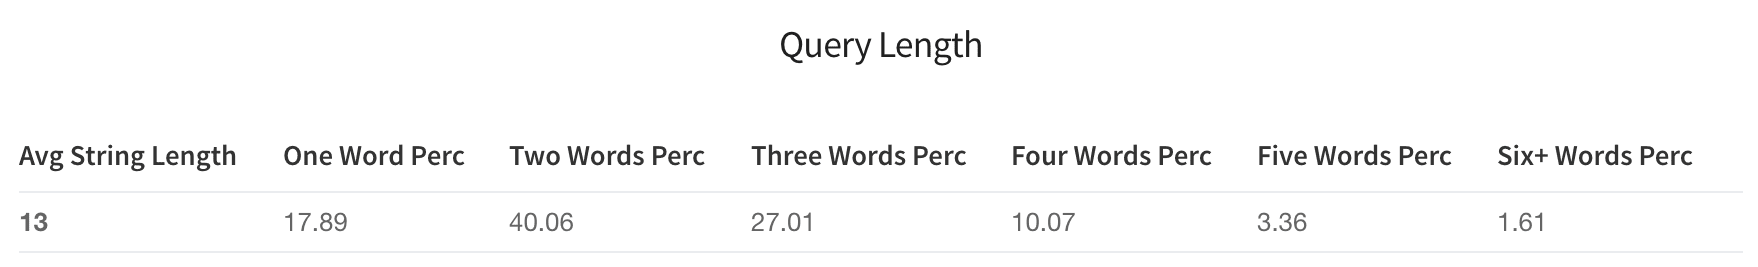
Query Length (queryLength)
This table shows how users are querying your database. Are most people searching very long strings or very short strings? These distributions will give you insight into how to tune your search engine to be performant on the majority of queries.
Tail Reasons table and pie chart (tail_reasons)
Based on the difference between the tail and head queries, the Head/Tail Analysis job assigns probable reasons for why any given query is a tail query. Tail reasons are displayed as both a table and a pie chart:
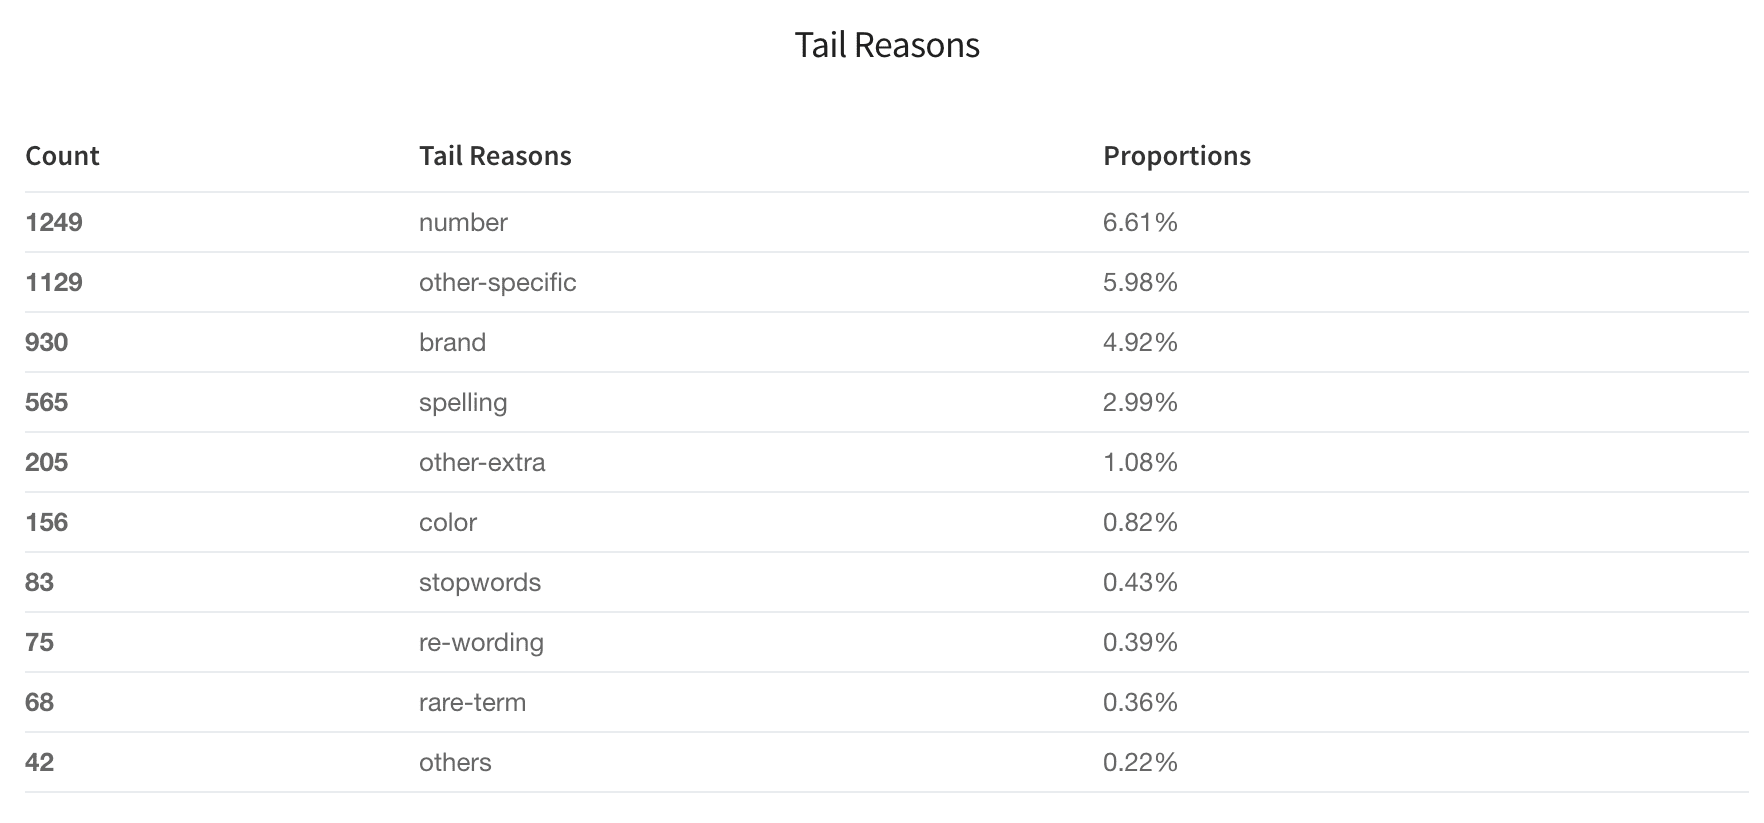
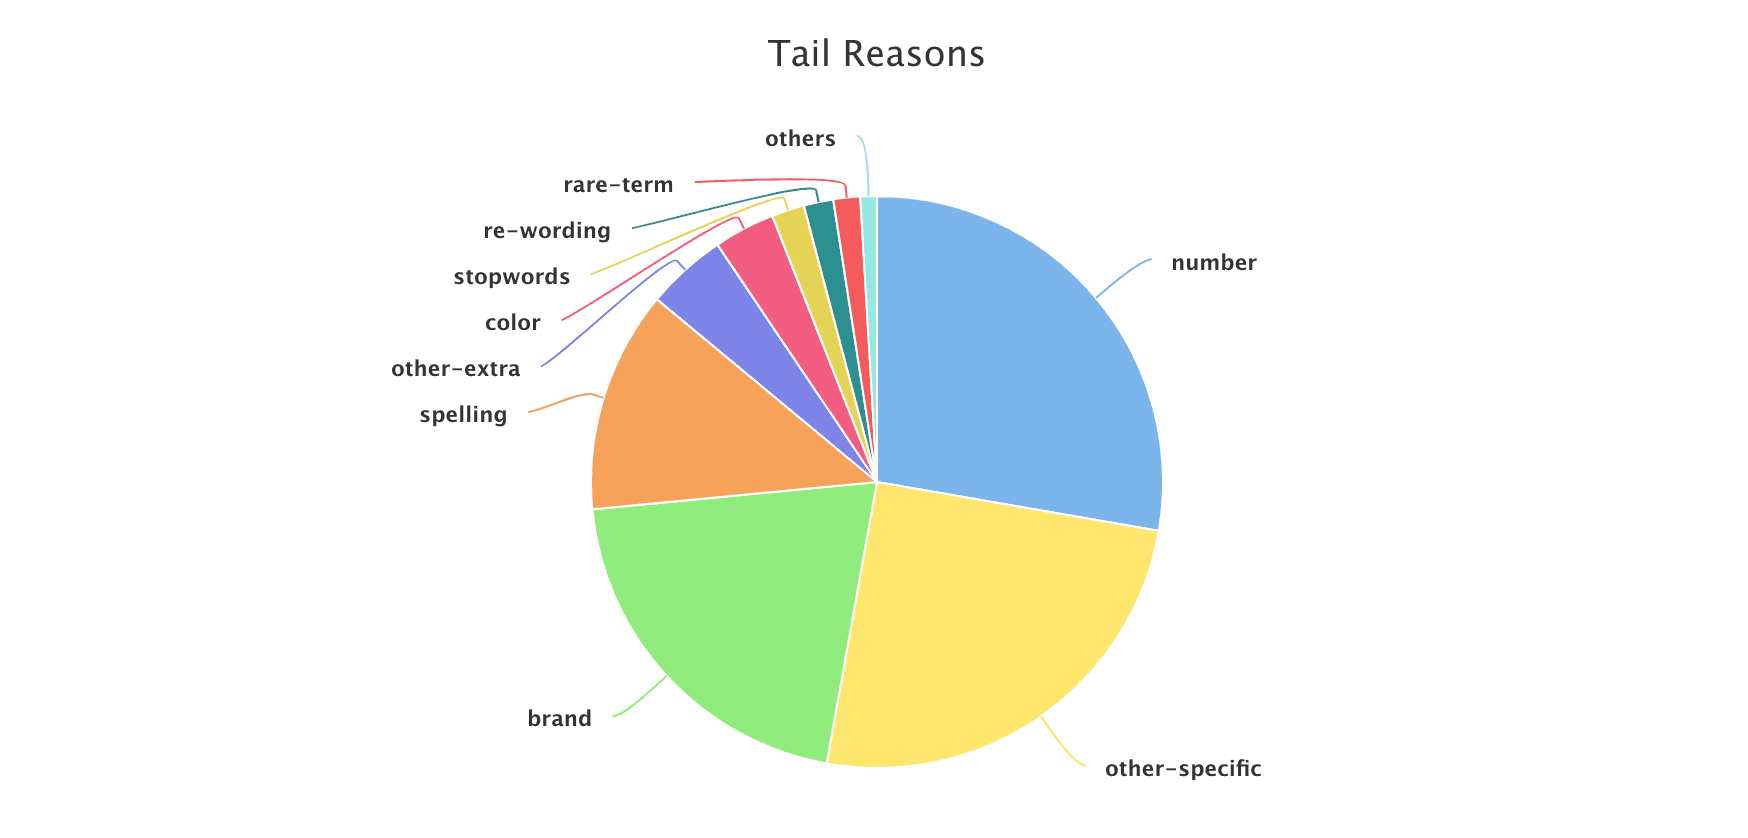
Pre-defined tail reasons
Based on Lucidworks’ observations on different signal datasets, we summarize tail reasons into several pre-defined categories:| spelling | The query contains one or more misspellings; we can apply spelling suggestions based on the matching head. |
| number | The query contains an attribute search on a specific dimension. To normalize these queries we can parse the number to deal with different formatting, and/or pay attention to unit synonyms or enrich the product catalog. For example, “3x5” should be converted to “3’ X 5’” to match the dimension field. |
| other-specific | The query contains specific descriptive words plus a head query, which means the user is searching for a very specific product or has a specific requirement. We can boost on the specific part for better relevancy. |
| other-extra | This is similar to ‘other-specific’ but the descriptive part may lead to ambiguity, so it requires boosting the head query portion of the query instead of the specific or descriptive words. |
| rare-term | The user is searching for a rare item; use caution when boosting. |
| re-wording | The query contains a sequence of terms in a less-common order. Flipping the word order to a more common one can change a tail query to a head query, and allows for consistent boosting on the last term in many cases. |
| stopwords | Query contains stopwords plus head query. We would need to drop stopwords. |
Custom dictionary
You can also specify your own attributes through a keywords file in CSV format. The header of the CSV file must be called “keyword” and “type”, and stopwords must be called “stopword” for the program to recognize them. Below is an example dictionary that defines “color” and “brand” reason types. The job will parse the tail query, assign reasons such as “color” or “brand”, and perform filtering or focused search on these fields. (Note: color and brand are also the field names in your catalog.)- Construct the CSV file as described above.
- Upload the CSV file to the blob store.
Note the blob ID. - In the Head/Tail Analysis job configuration, enter the blob ID in the Keywords blob name (
keywordsBlobName) field.
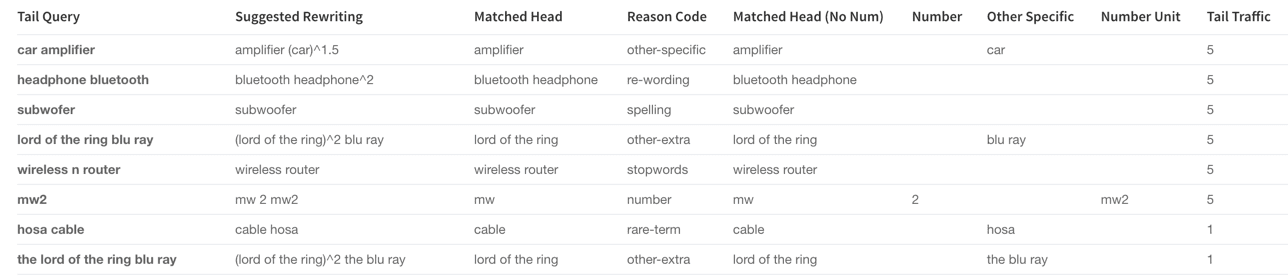
Head Tail Similarity (tail_rewriting)
For each tail query (the tailQuery_orig field), Fusion tries to find its closest matching head queries (the headQuery_orig field), then suggests a query rewrite (the suggested_query field) which would improve the query. The rewrite suggestions in this table can be implemented in a variety of ways, including utilizing rules editor or configuring a query parser that rewrites tail queries.