How MCP usage is measured
All MCP traffic enters Lucidworks Search through the API gateway at the/mcp route.
The gateway records a per-route latency histogram, gateway_request_time_secs, on every request.
The label routeId="mcp-server" isolates MCP traffic from all other gateway routes, providing a clean MCP-only view without touching the MCP server itself.
The histogram carries these labels:
| Label | Meaning |
|---|---|
routeId | Gateway route; mcp-server = MCP traffic |
httpMethod | HTTP method (the MCP server uses POST) |
httpStatusCode | Response status code (200, 202, 404, …) |
outcome | SUCCESSFUL, CLIENT_ERROR, SERVER_ERROR |
status | Spring HTTP status enum (OK, ACCEPTED, …) |
gateway_request_time_secs_count— total number of requestsgateway_request_time_secs_sum— sum of all request durations in secondsgateway_request_time_secs_bucket— histogram buckets that power the latency percentiles
Dashboard overview
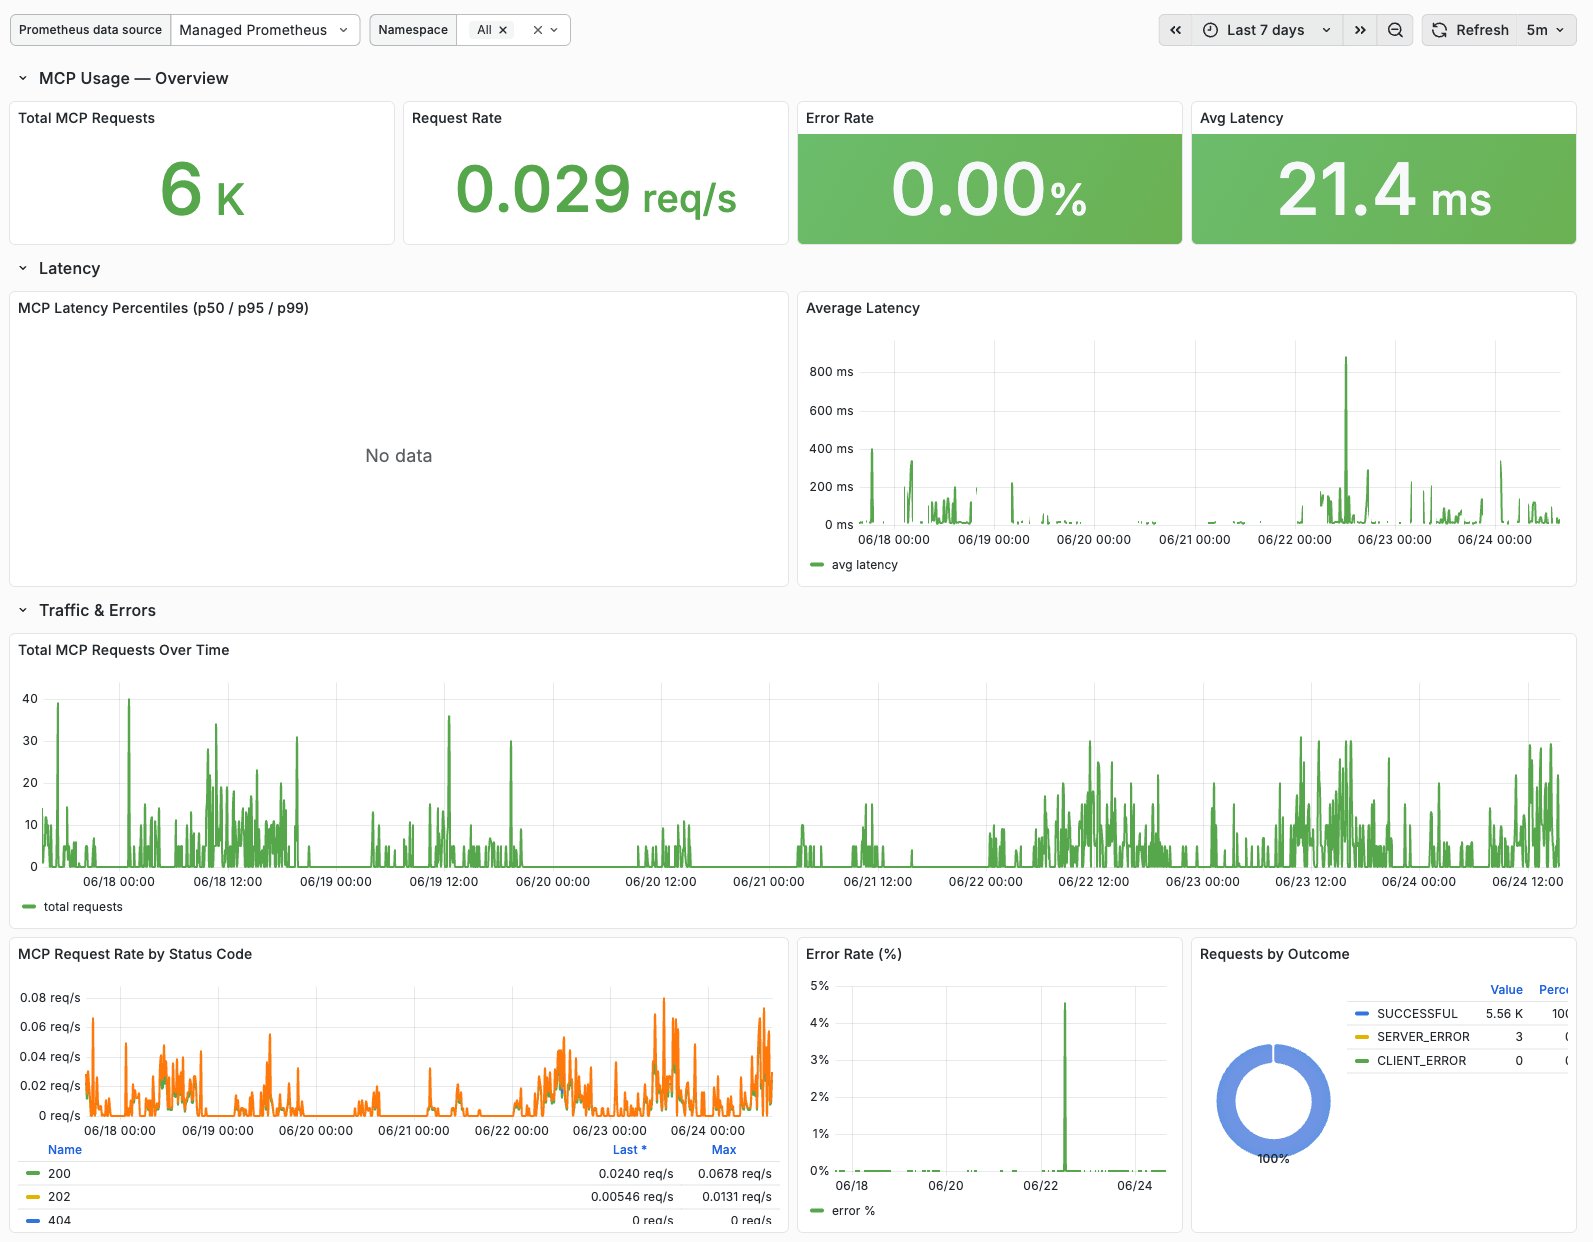
The Lucidworks team configures Grafana dashboards for your Lucidworks Search environment. Contact your Lucidworks representative for dashboard access and customization options. The MCP monitoring dashboard includes panels organized into three sections: overview metrics, latency analysis, and traffic breakdown.
Overview metrics
| Panel | Description |
|---|---|
| Total MCP Requests | Total MCP calls over the selected range |
| Request Rate | Current throughput in requests per second |
| Error Rate | Percent of MCP requests that failed with 4xx or 5xx status codes; green (less than 1%), yellow (1-5%), red (greater than 5%) |
| Avg Latency | Average MCP response time in milliseconds |
Latency metrics
| Panel | Description |
|---|---|
| MCP Latency Percentiles | p50, p95, and p99 latency distribution from the histogram |
| Average Latency | Average response time over time |
Traffic metrics and errors
| Panel | Description |
|---|---|
| MCP Request Rate by Status Code | Throughput split by HTTP status code |
| Error Rate | Failure percentage over time |
| Requests by Outcome | Success versus client and server error breakdown |
| Total MCP Requests Over Time | Single-line graph showing total request volume trend |
Notes
- This dashboard measures MCP usage at the gateway, which is the cleanest signal for request volume, status, and latency.
It does not break usage down per MCP tool (such as
Search_documents,Get_document) — that would require additional instrumentation in the MCP server. - The same metric (
spring_cloud_gateway_requests_seconds) is also emitted by the gateway as a Micrometer summary; the dashboard uses thegateway_request_time_secshistogram because it supports latency percentiles.