ImportantContact your Lucidworks representative if you have questions about your Lucidworks Search license consumption entitlements.
Requests
Request means any GET or POST call against the Lucidworks Search Query Profiles API or Lucidworks Search Query Pipelines API. Requests may be initiated by user actions such as typing in the search bar, executing a search, or clicking a category or facet. Requests may also be triggered by programmatic sources such as web crawlers or loading of pages. If a user interface or program generates multiple requests against the Lucidworks Search Query Profiles API or Lucidworks Search Query Pipelines API, each individual call will be counted against the requests per year and the max queries per second (or hour).Download reports
You can download your data from the consumption dashboard. The data is downloaded as CSV files and displays your data by day for the selected date range. You can export the detailed from the selected date range, all data, or the summary section only. The ZIP file returns eight files:- A CSV file with the requests report per day, which lists the date and the number of requests made that day.
- A CSV file with the records report per day, which lists the date and the maximum number of records stored in Lucidworks Search that day.
- A CSV file with the events that occurred for requests. This file reports only signature mismatches, which indicates that data was modified. Otherwise this file contains only the date and event title columns.
- A CSV file with the events that occurred for records. This file reports only signature mismatches, which indicates that data was modified. Otherwise this file contains only the date and event title columns.
- A signature file to accompany each of the CSV files.
Date range
You may view your consumption over the past week, month, or year. You may also select a custom date range. You may also select a custom date range.Requests chart
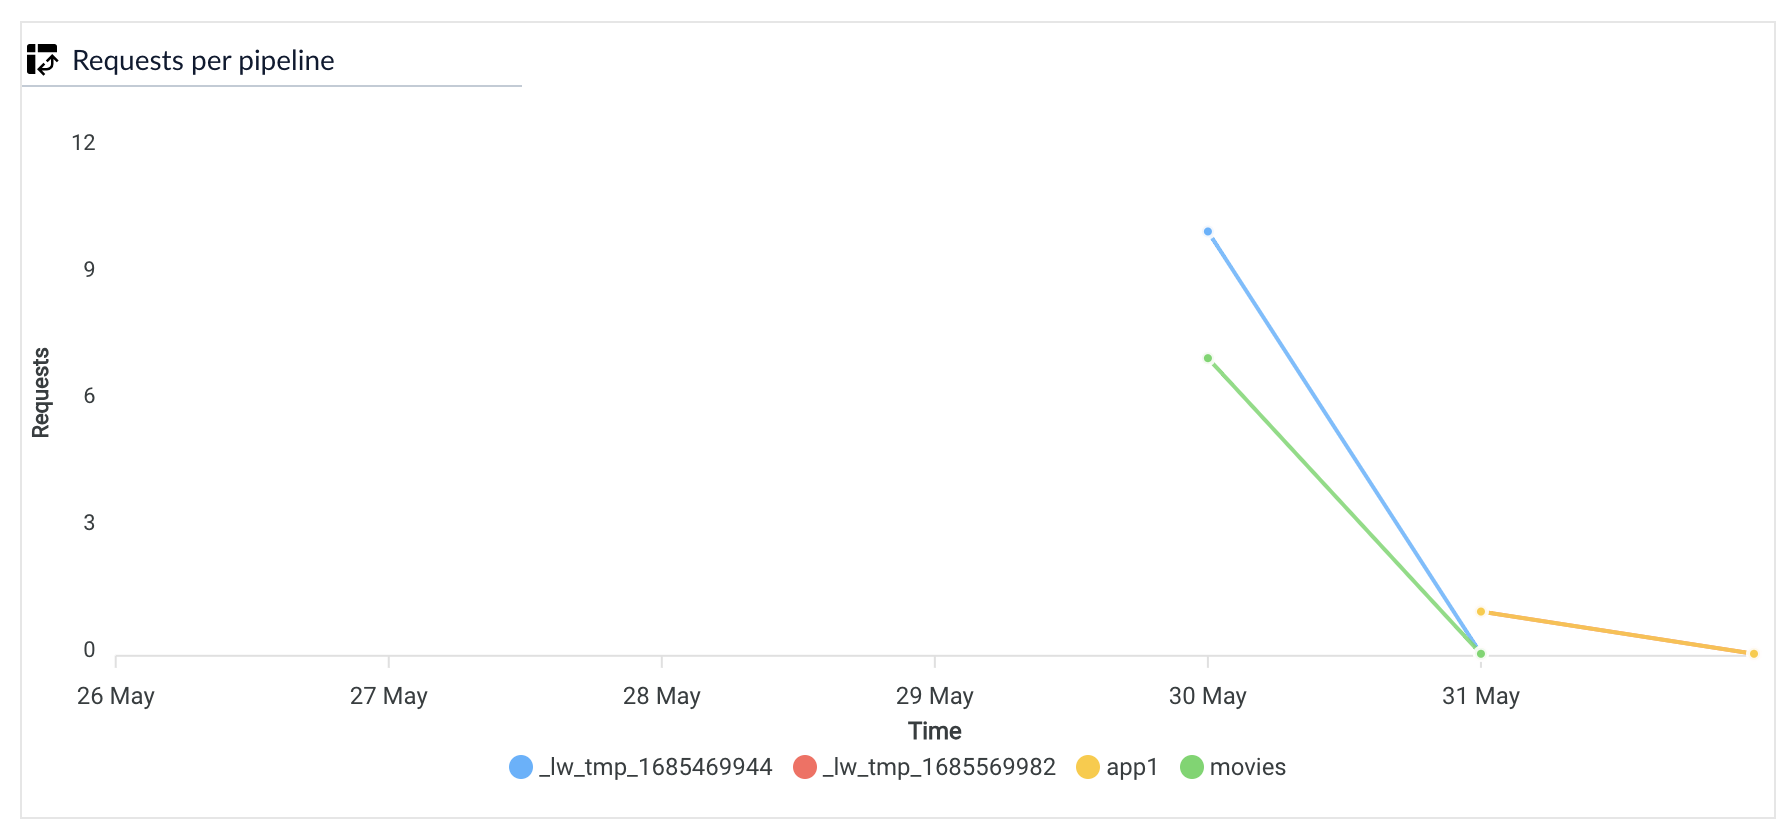
Requests are the HTTP requests sent to Lucidworks Search. Lucidworks Search receives requests through the API and user searches.The requests chart displays the number of requests that Lucidworks Search has processed each day over the given time interval. To view the requests per pipeline, point your mouse over Requests across pipelines and select Requests per pipeline.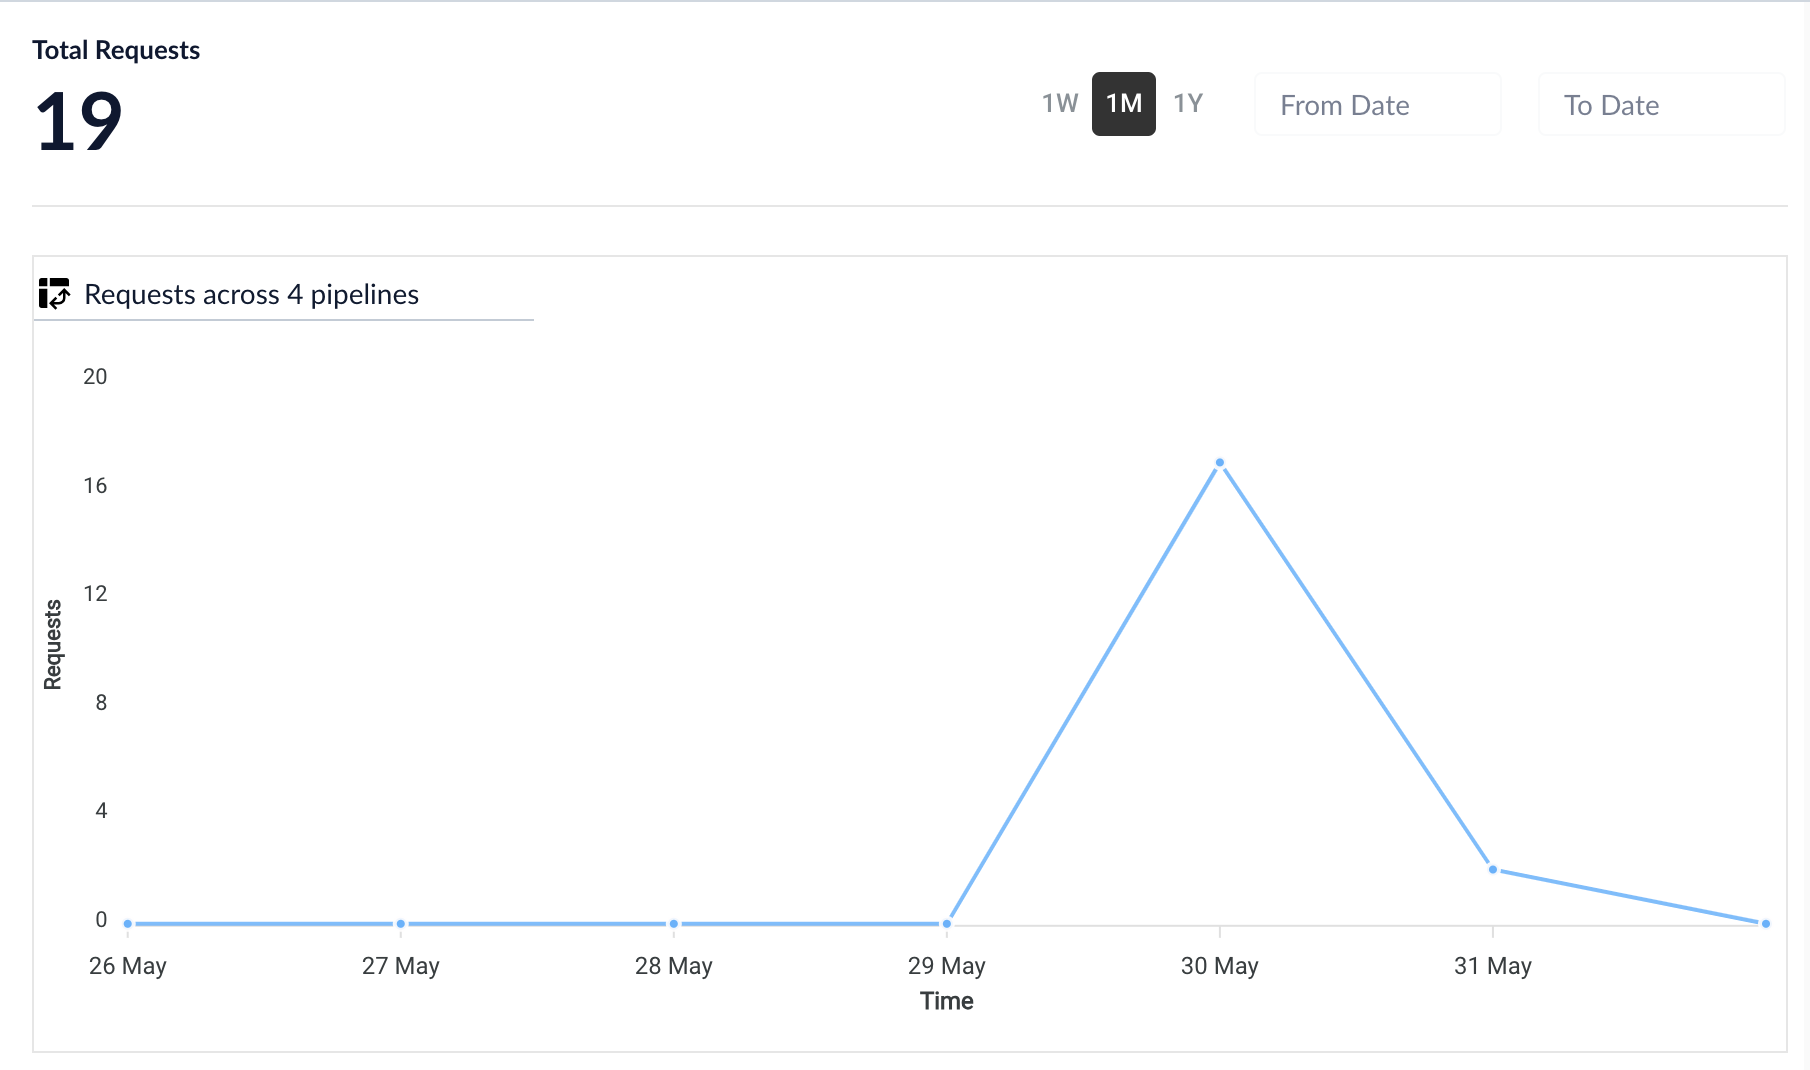
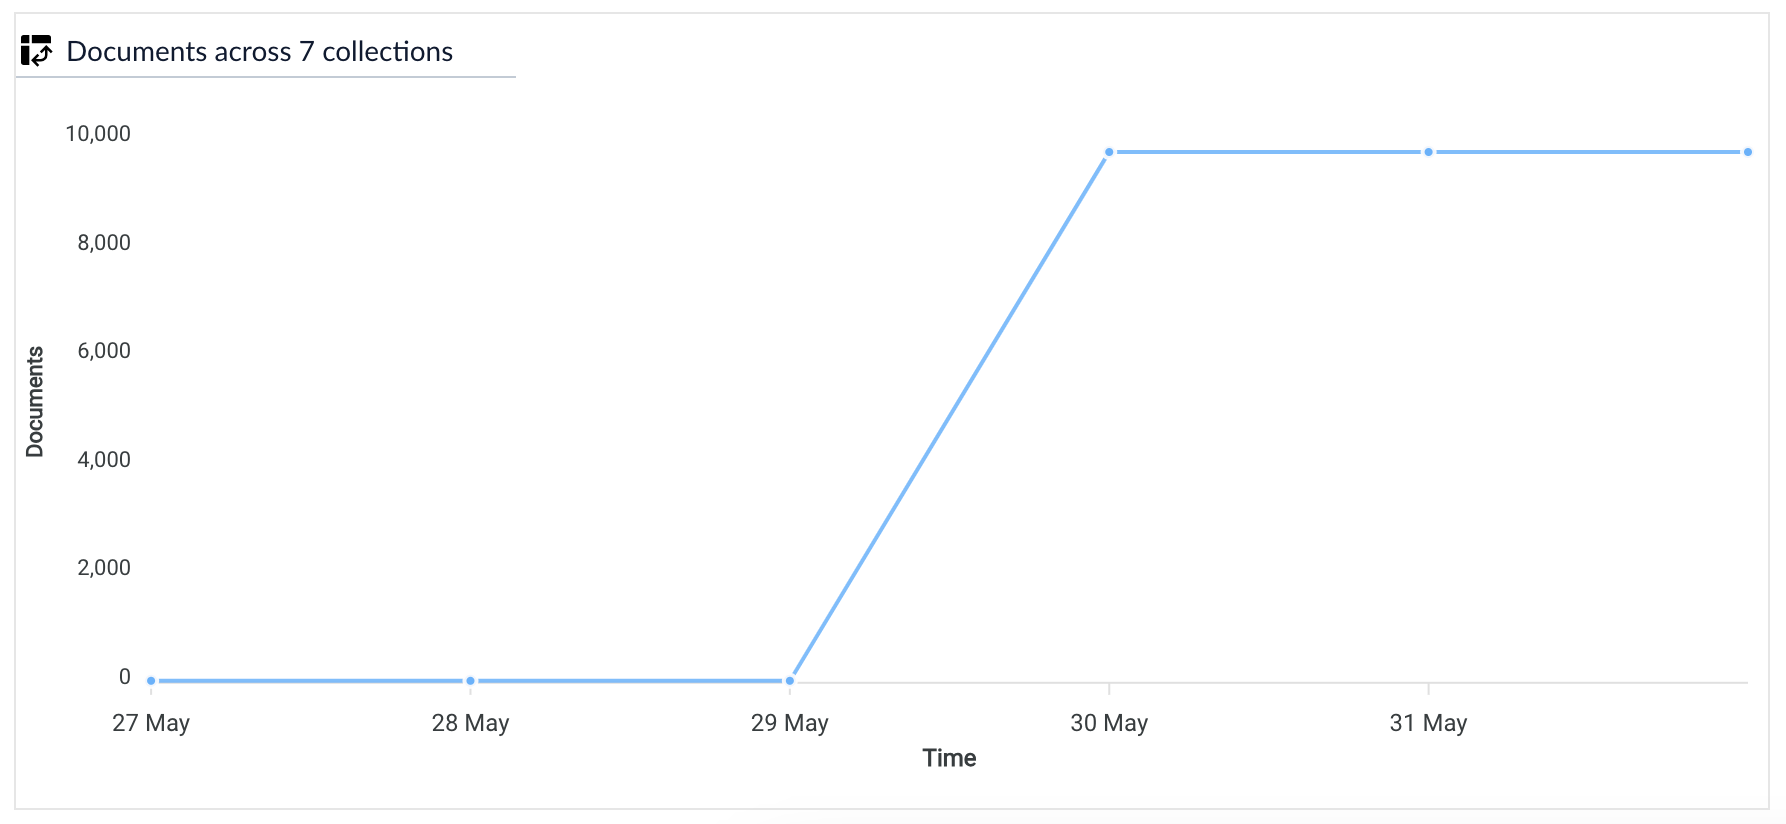
Documents chart
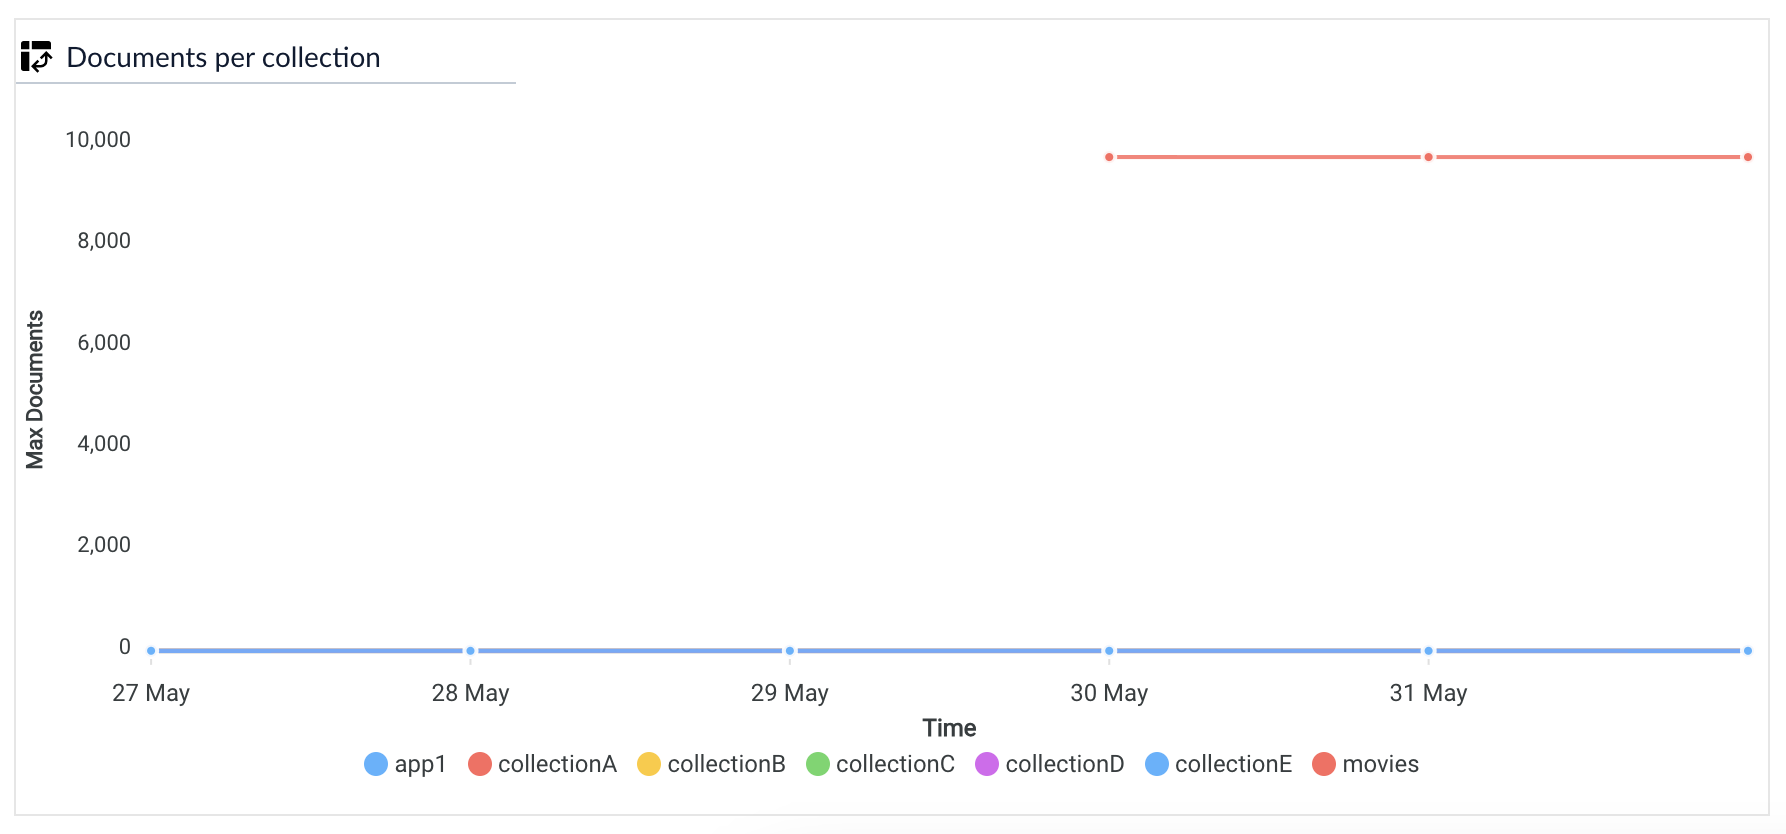
Records are the basic items that Lucidworks Search searches. They are also called documents in Lucidworks Search. The records chart displays the total number of records that your instance of Lucidworks Search has stored and indexed over the selected time period. To view the documents per collection, point your mouse over Documents across collections and select Documents per collection*.