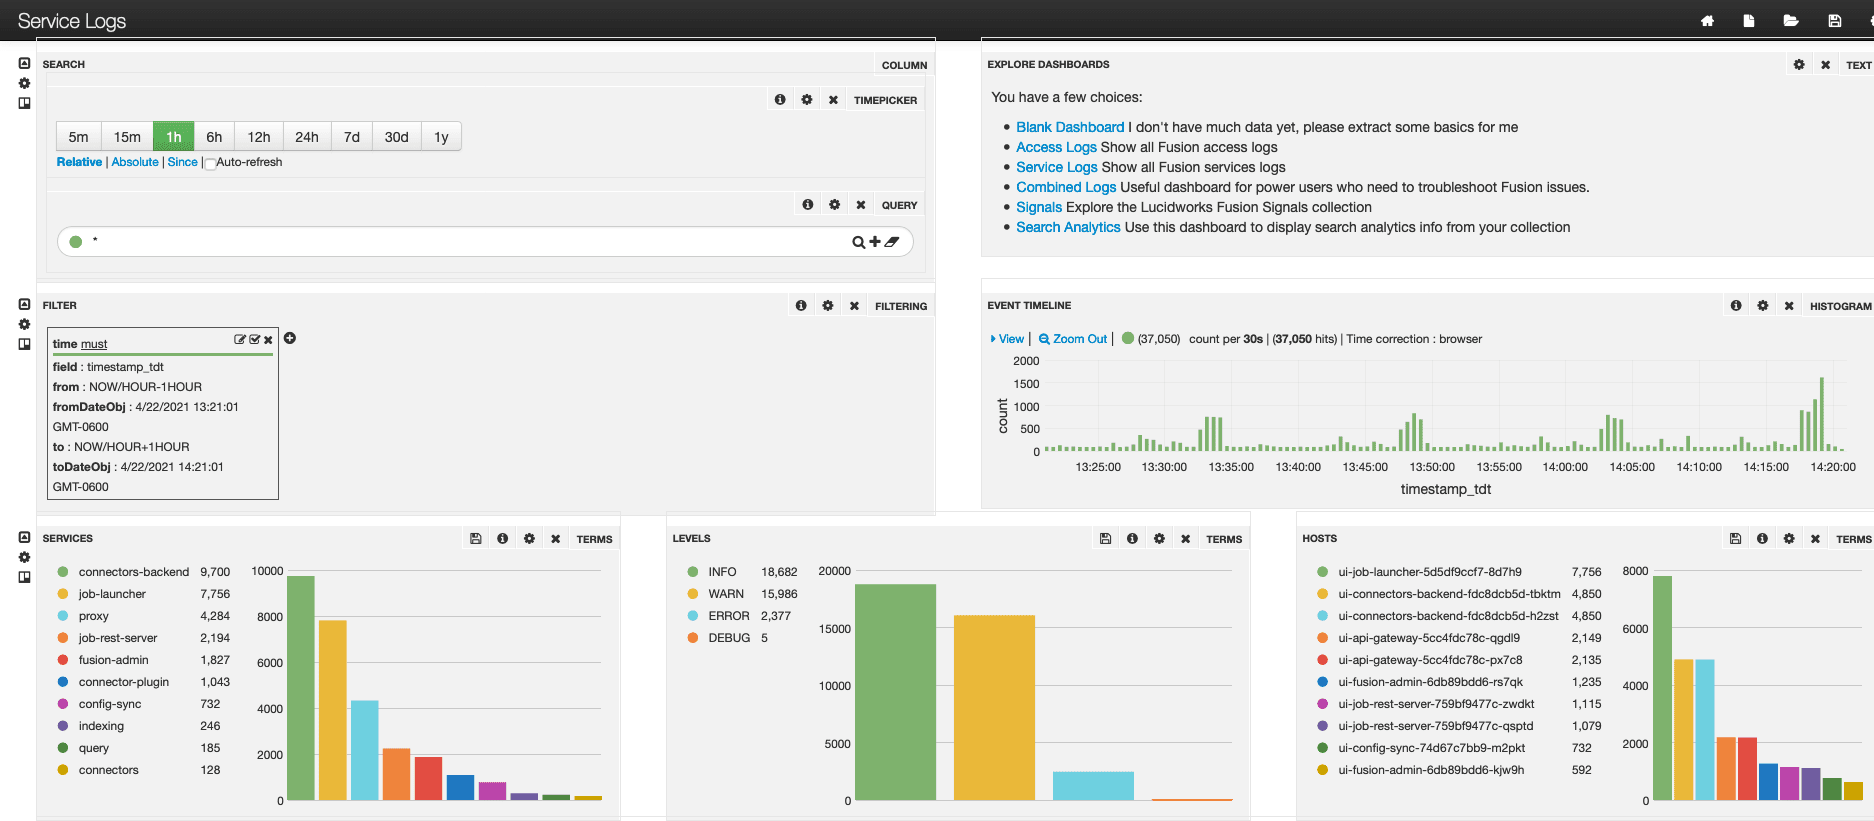
Service Logs dashboard
The Service Logs dashboard (lucidworks-service-logs.json) is also the default dashboard (default.json).
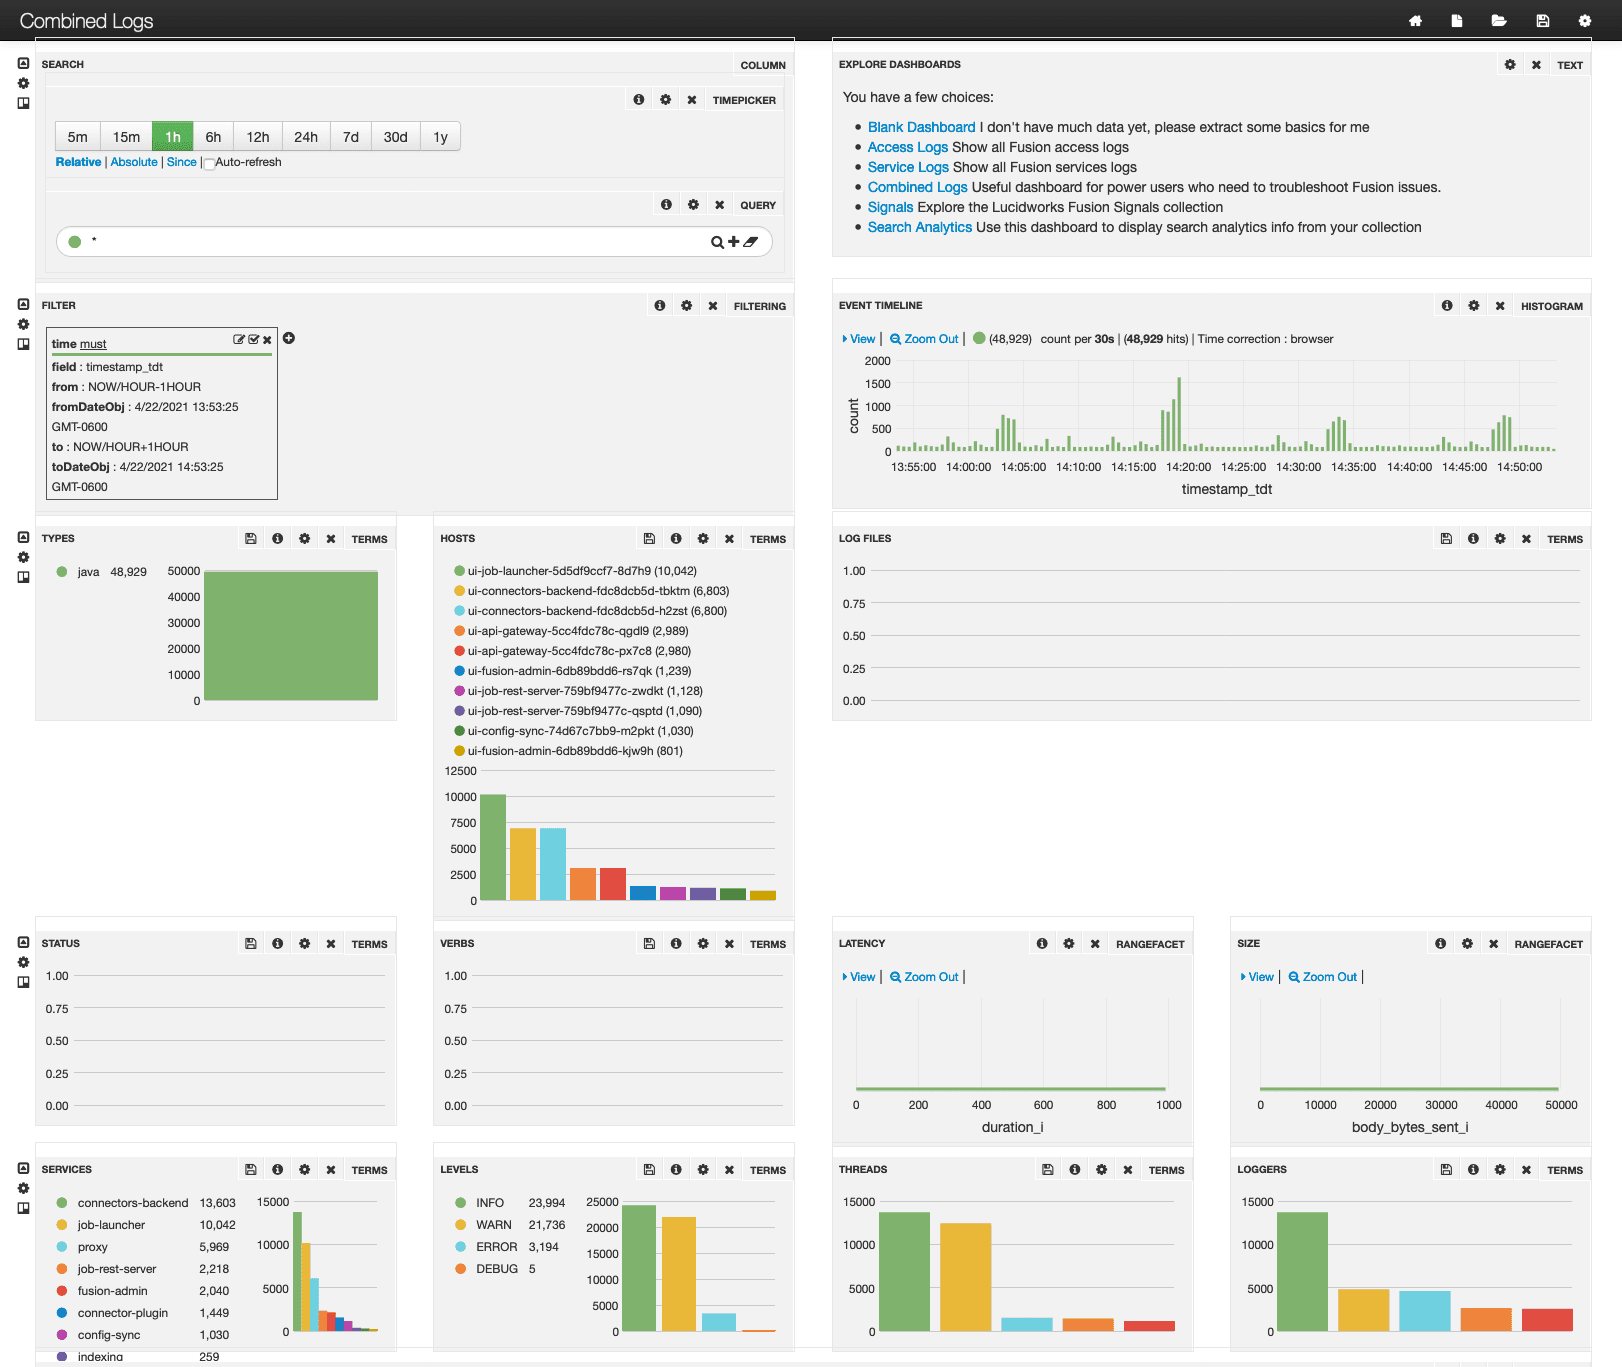
Combined Logs dashboard
The Combined Logs dashboard (lucidworks-combined-logs.json) lets you analyze all logs from the system_logs collection.
Blank dashboard
An entirely blank dashboard (blank.json) is available. To open this dashboard from the default dashboard, click Blank Dashboard at the top right.
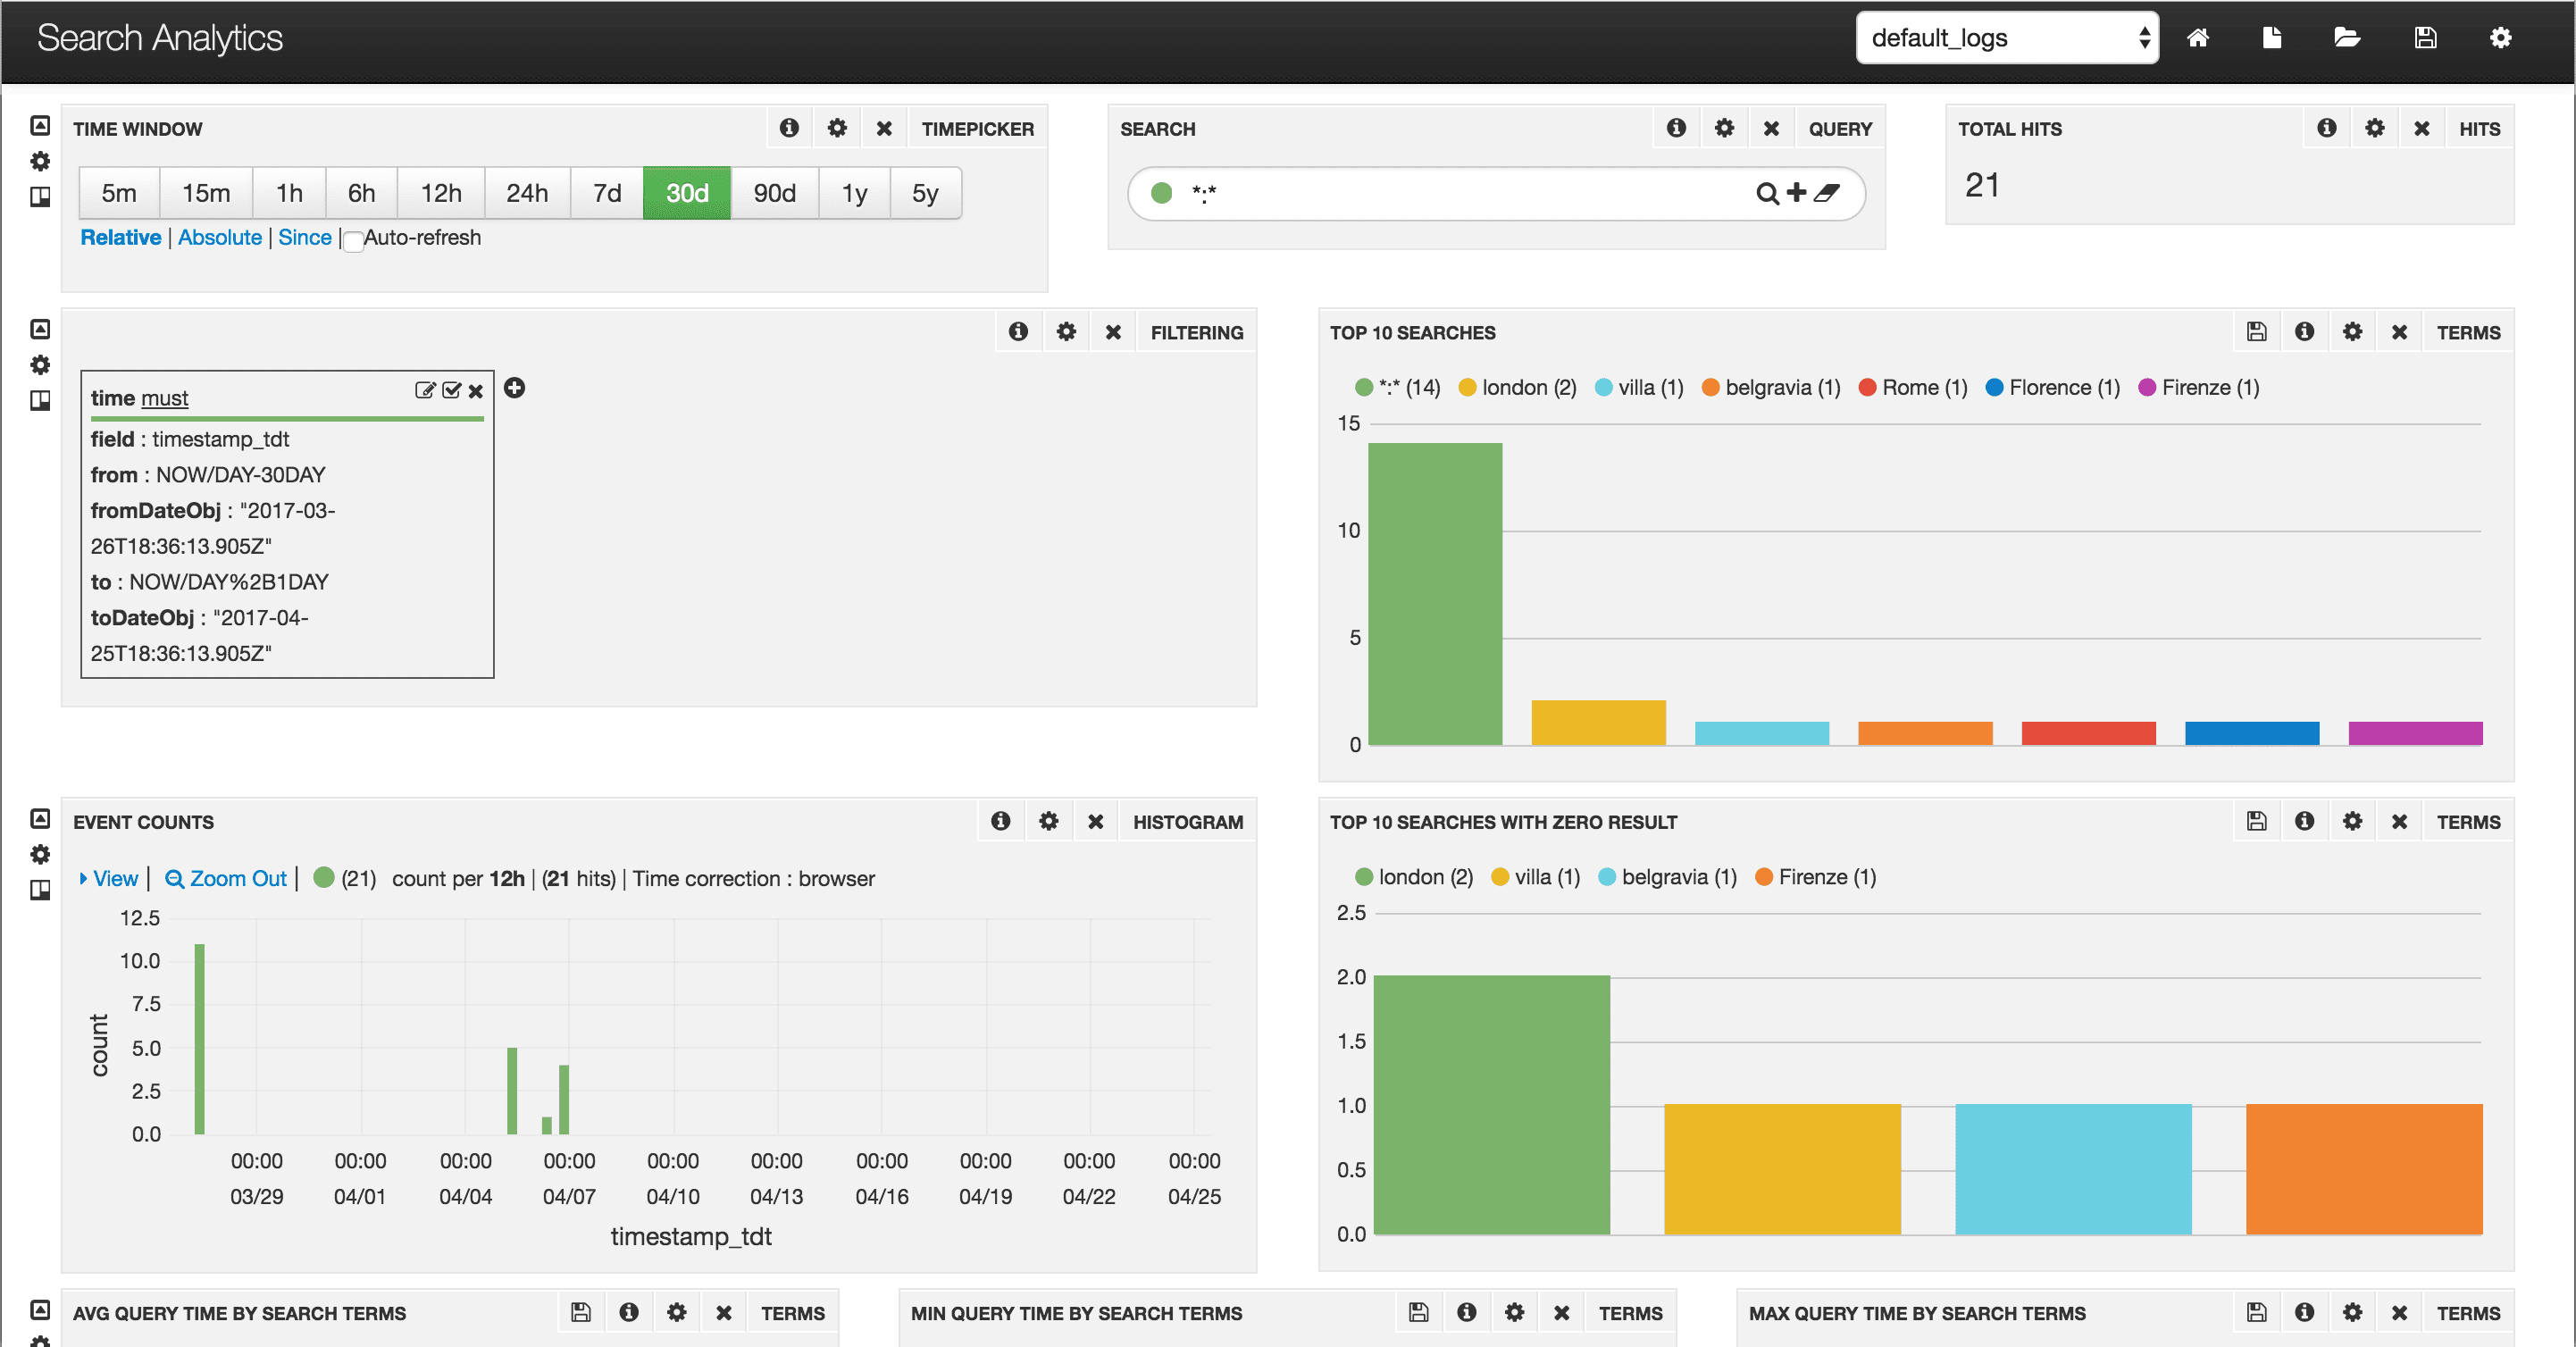
Search Analytics dashboard
The Fusion Search Analytics dashboard (lucidworks-searchanalytics.json) displays search analytics derived from collection logs and from queries to Solr (/api/solr).
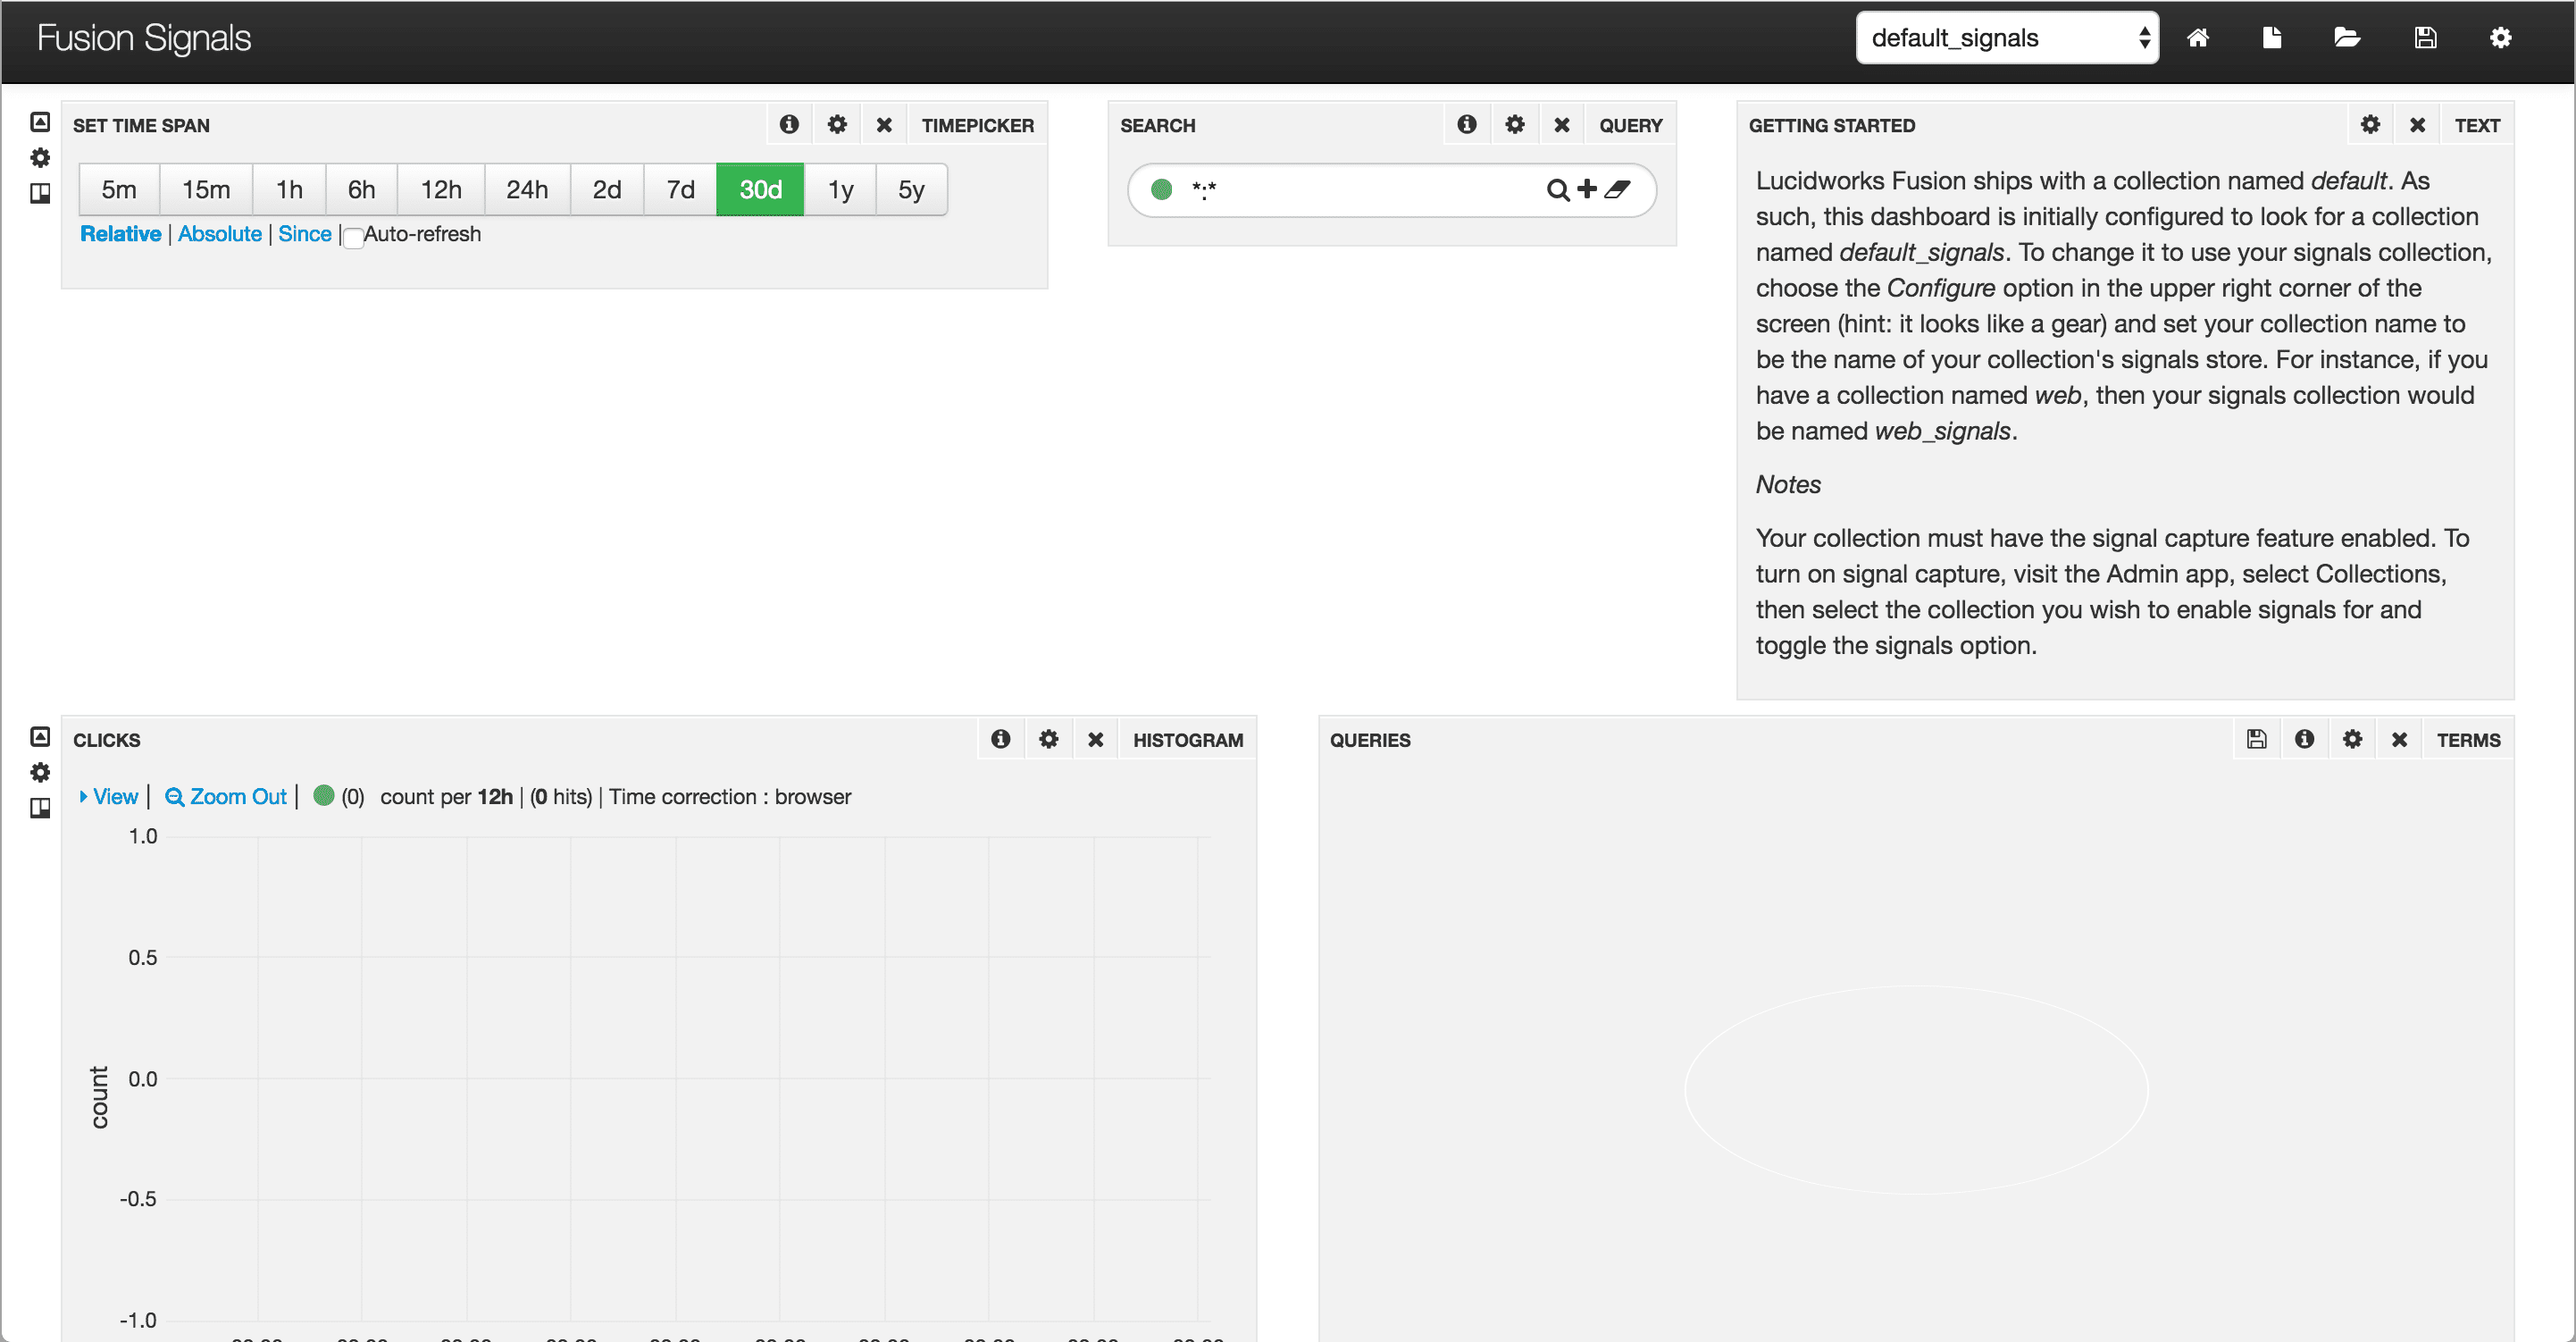
Fusion Signals dashboard
The Fusion Signals dashboard (lucidworks-signals.json) is a time-series dashboard that you can use to monitor signals collections. It uses the signal timestamp as the time field.
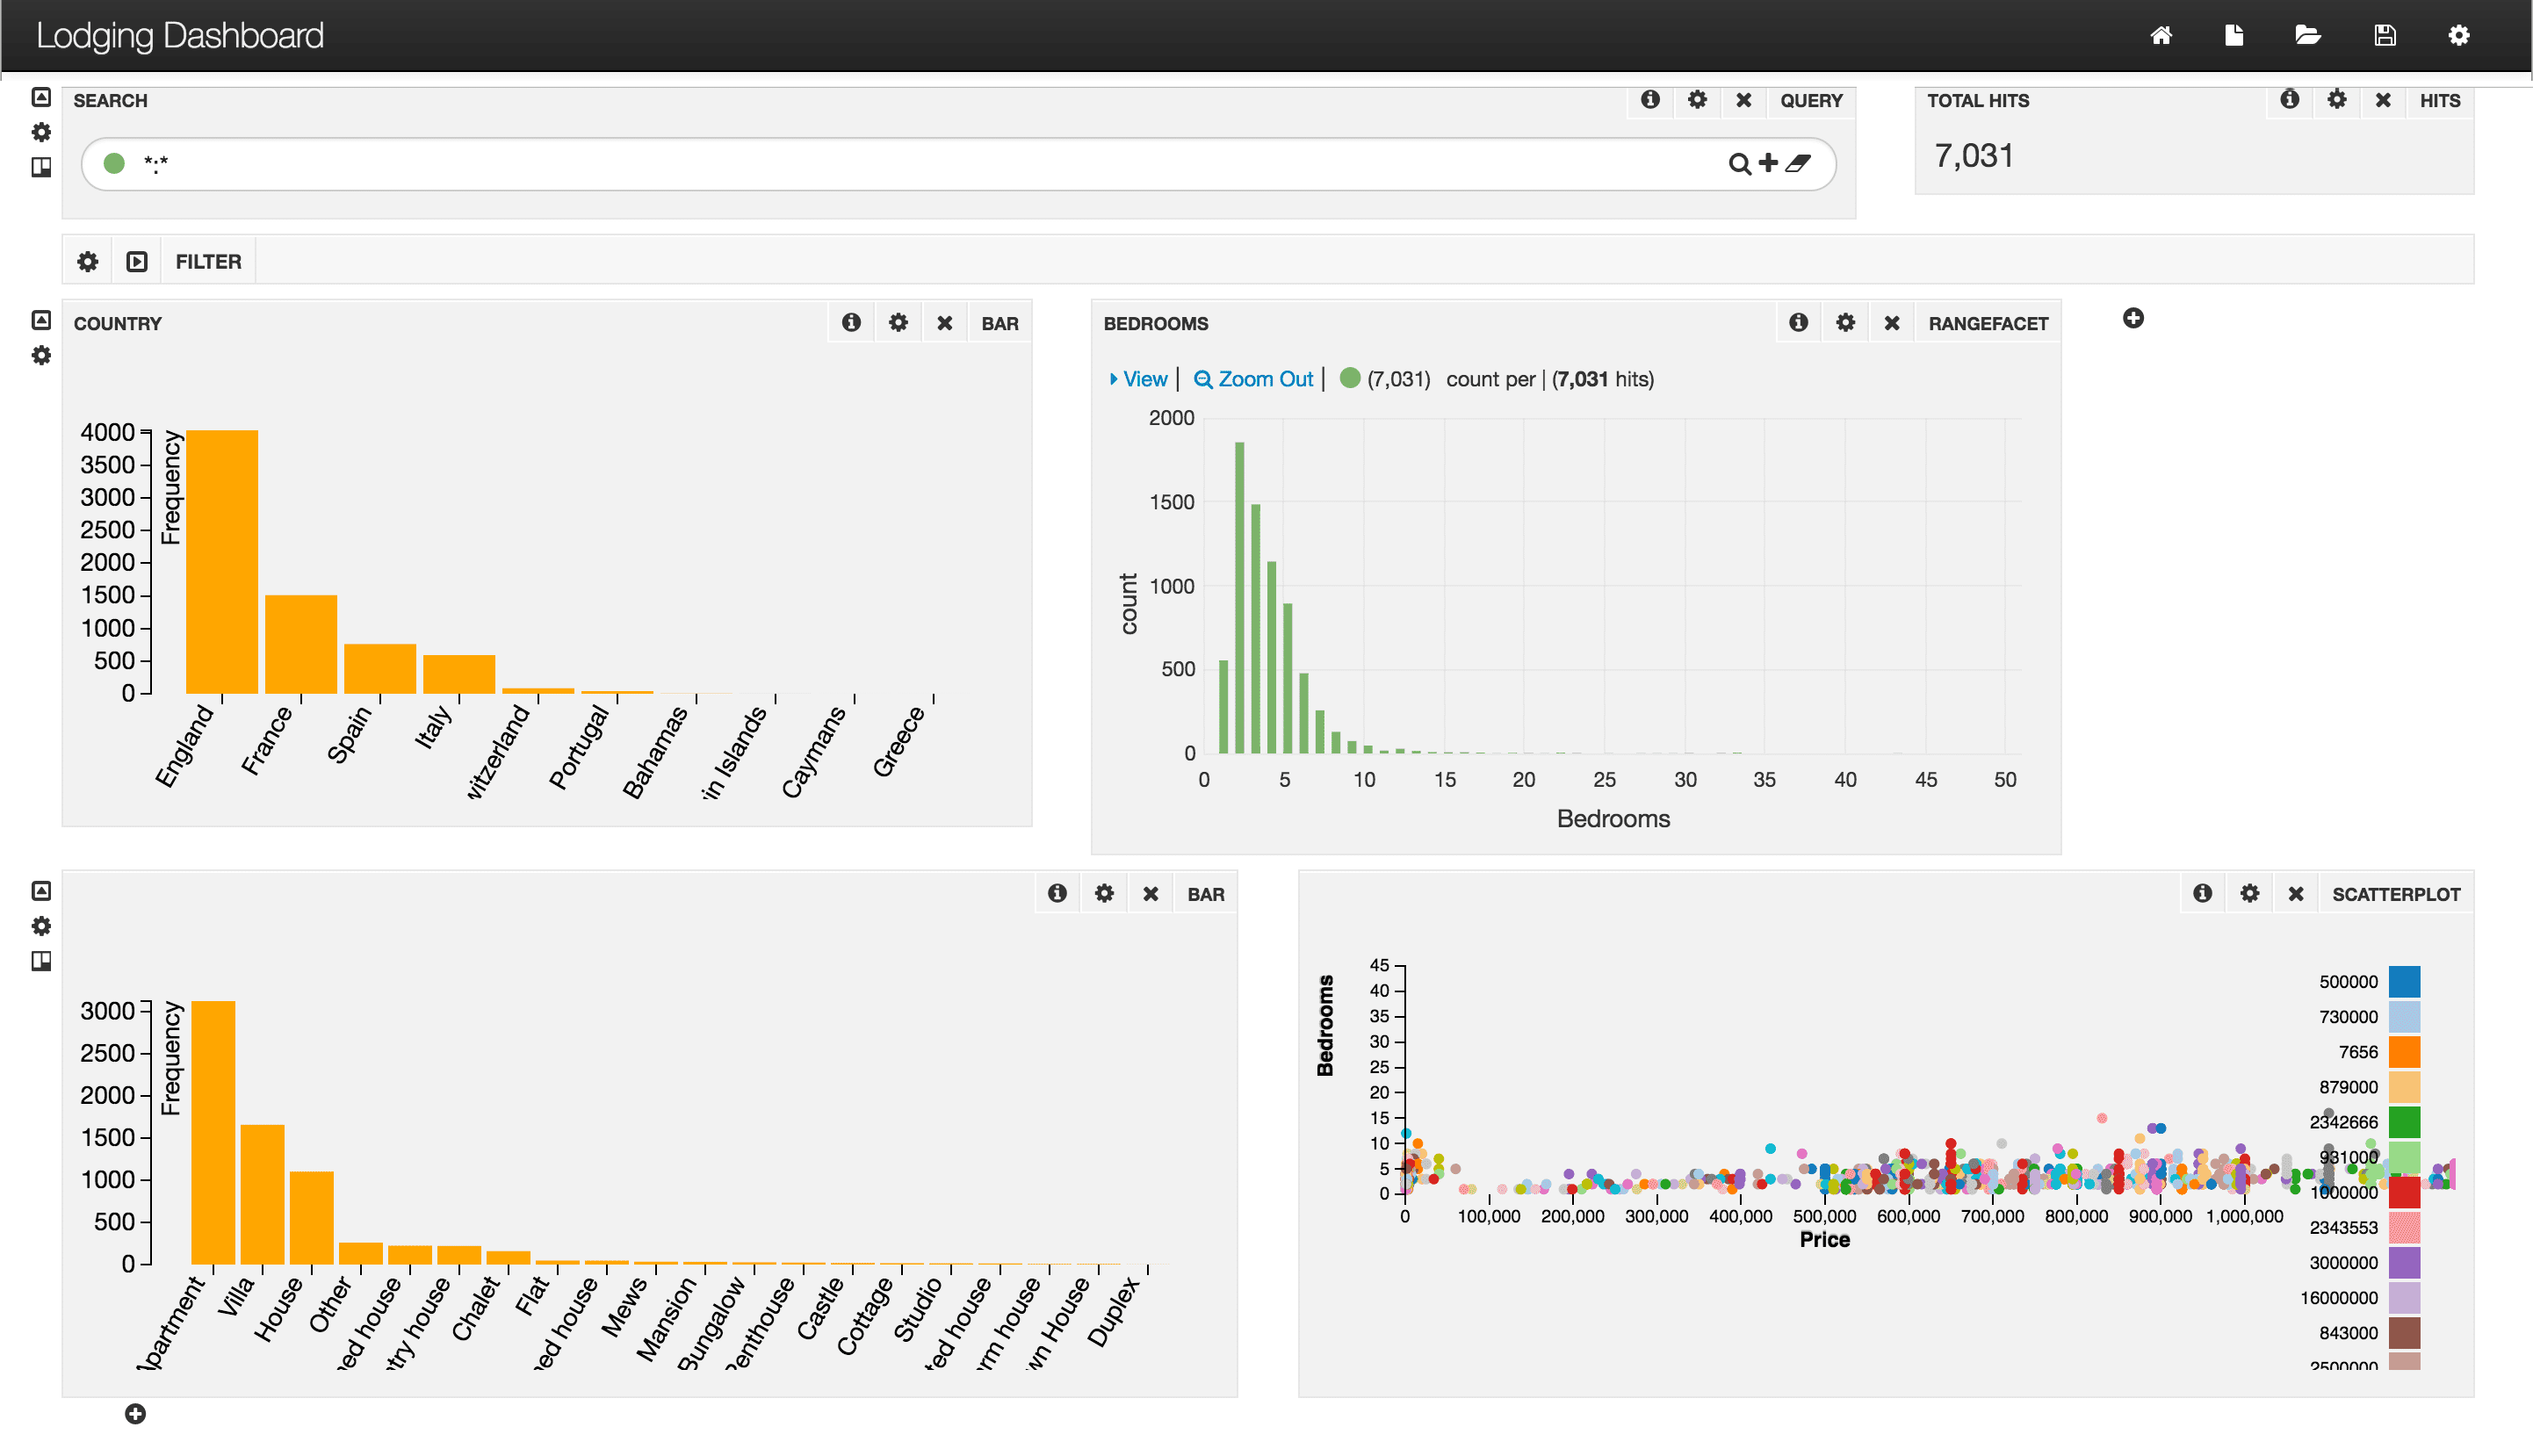
Default Non-Time-Series dashboard
Fusion includes a default non-time-series dashboard (default-nts.json). This is an example:
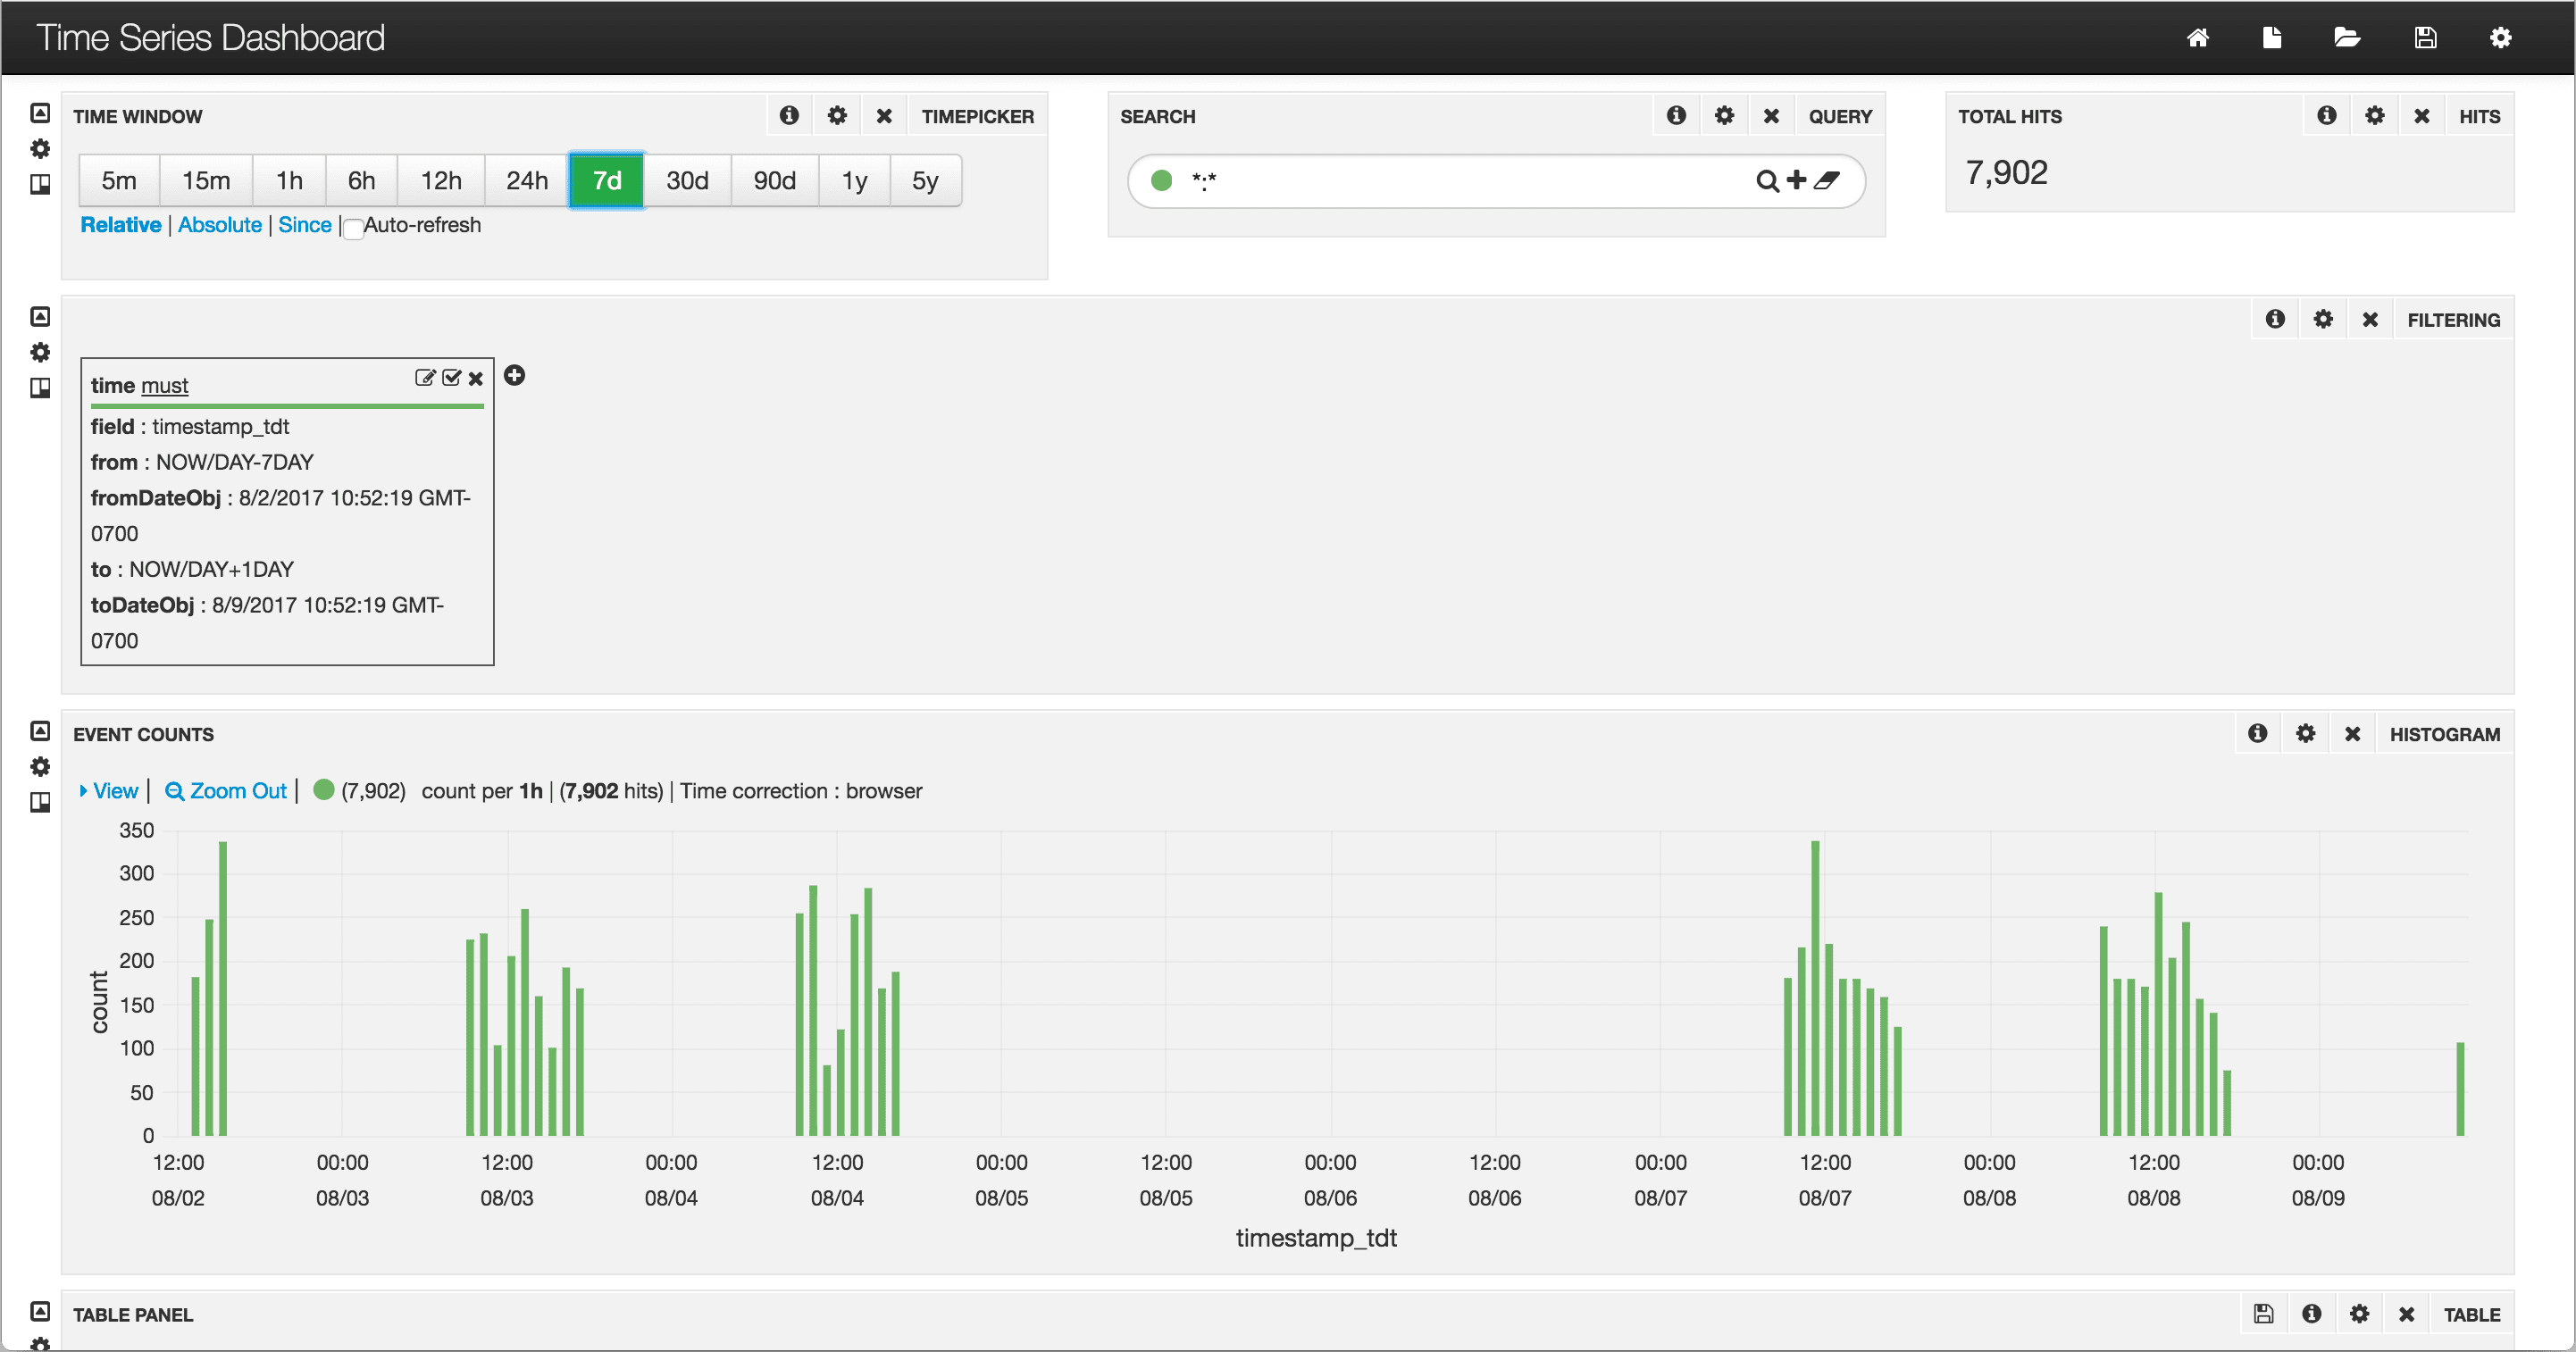
Default Time-Series dashboard
Fusion includes a default time-series dashboard (default-ts.json). This is an example: