Skip to main content
Lucidworks documentation home page
Search anything
⌘K
Archive docs
LucidAcademy
Book a demo
Book a demo
Search...
Navigation
App insights
Dashboards in App Insights
SaaS Platform
Platform APIs
Self-hosted Fusion
Lucidworks Search
Fusion APIs
Connectors
Policies
Introduction
Lucidworks Search versus Fusion
Latest changes
5.17
5.9
UI tour
Overview
Lucidworks Search apps
Index Workbench
Query Workbench
Object Explorer
Index data
Overview
Connectors and Datasources
Collections
Index profiles
Dynamic Index
Parsers
Index pipelines
Index Workbench
Signals
Blob storage
Data models
Query data
Overview
Query profiles
Query pipelines
Query Workbench
Lucidworks MCP
Domain Specific Language
Faceting
Solr query language
Metrics and analytics
Overview
App insights
Overview
Dashboards in App Insights
Events
Sessions
Analytics
Experiment results
Requirements for reports and dashboards
Experiments
Experiment metrics
Evaluation Metrics
Improve your queries
Overview
Signals
Rules editor
Recommendations
Business rules
Boosting
Curate your search experience
Synonyms
Collapse Results
Head/tail analysis
Misspelling detection
Phrase detection
Query rewriting
Remove words
Response rewriting
Stopwords files
Template expressions
Administration
Overview
Promotion to Production
Access control
Environments
Jobs and scheduling
Monitoring
Security
Backup and disaster recovery
VPNs
Developer documentation
Overview
REST APIs
Configuration specifications
Frontend development
Javadocs
Machine learning
Overview
Semantic vector search
Smart Answers
Sentiment analysis and prediction
Neural Hybrid Search
Overview
Chunking
Semantic vector search test guidelines
Choosing, implementing, and troubleshooting NHS stages
FAQs
Overview
On this page
Dashboard filtering
Metrics and analytics
App insights
Dashboards in App Insights
Copy page
Copy page
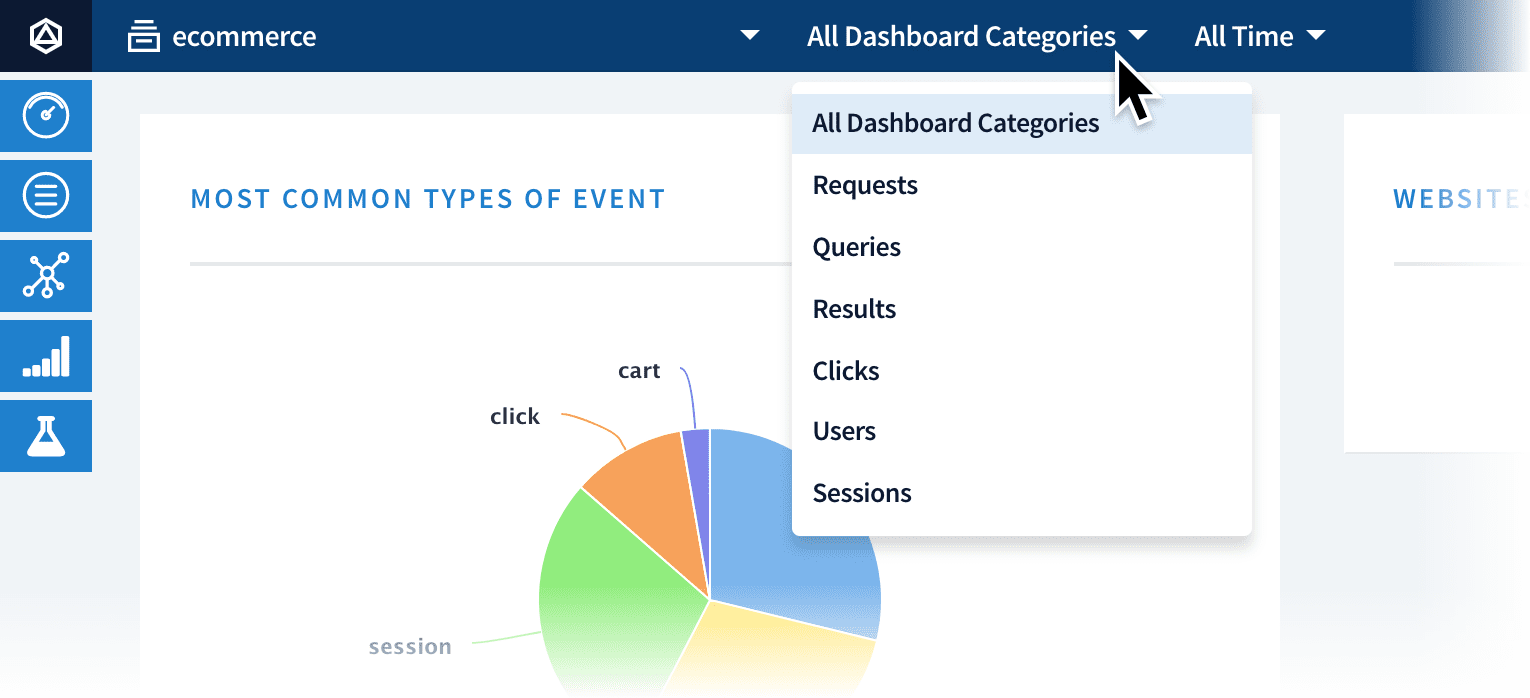
When you open the Dashboards page, it displays graphs and tables for attributes that are common to all signals. For more specific charts, you can open the
All Dashboard Categories
menu at the top and select a category:
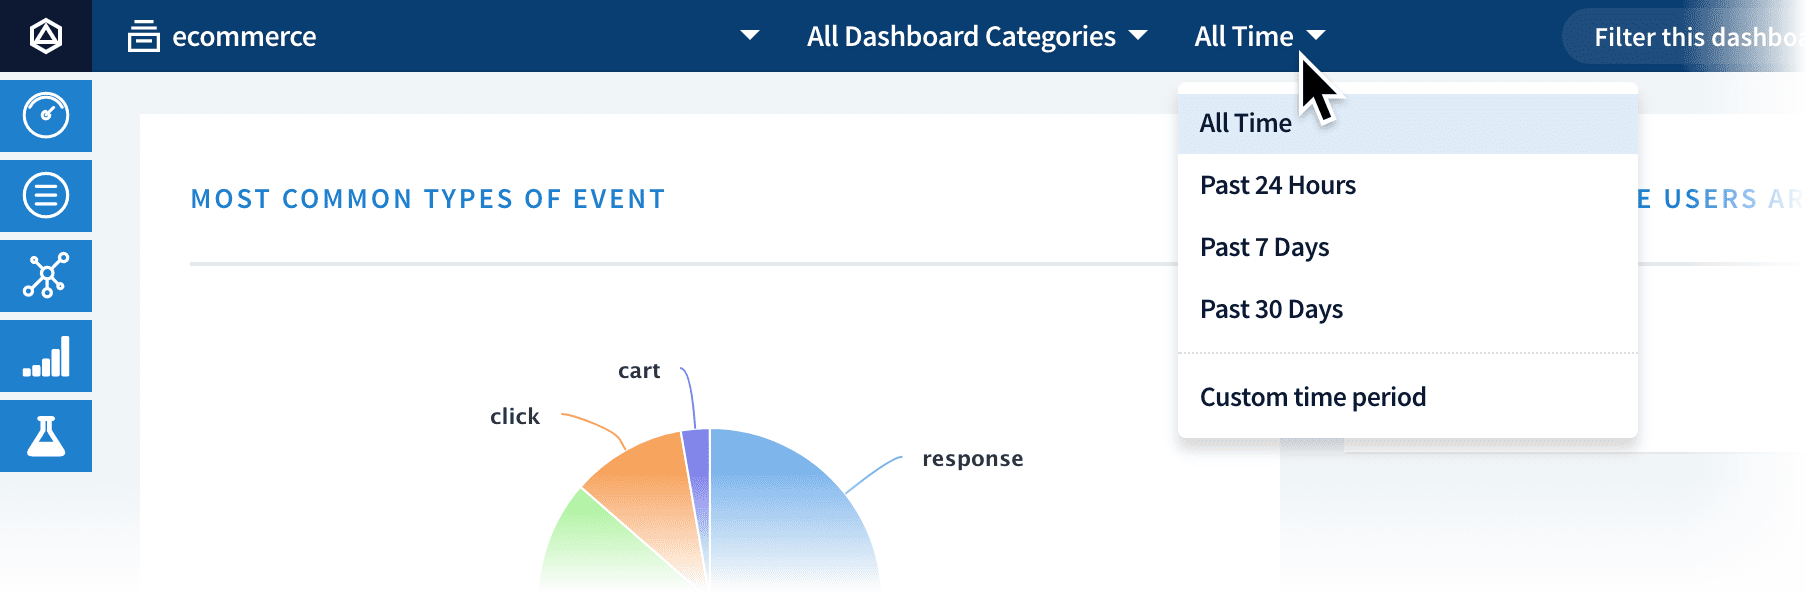
Dashboard filtering
You can filter by timeframe using the
All Time
menu:
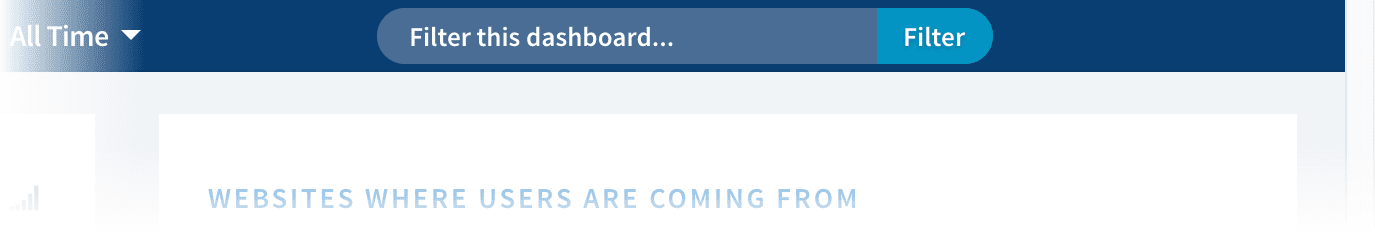
To filter by the content of the data, enter a string in the
Filter this dashboard…
text box:
Was this page helpful?
Yes
No
Overview
Events
⌘I