

- Create Dashboards
- Use Dashboards in Fusion
- Manage Dashboards
- Input Panels
- Display Panels
Create Dashboards
Create Dashboards
Create dashboards that meet the needs of users.
Requirements for a dashboard
Requirements for a dashboard are:- Input panel(s). You must add one or more input panels that let you specify which data the dashboard will display.
- Filtering panel. You must add a filtering panel to ensure that the dashboard functions correctly.
- Output panel(s). You must add one or more output panels to display the data.
Steps to create a dashboard
To create a dashboard, perform these actions in the order specified:- Choose the best starting point
- Configure dashboard settings
- Lay out the dashboard
- Configure the panels
- Save the dashboard
- Test the dashboard
Choose a starting point
You can create a new dashboard from scratch or modify an existing dashboard.To open the dashboard, complete the following:- From the Fusion workspace, click Analytics
 > Dashboards, or click System
  > Log Viewer.
 - In the upper right corner of the default dashboard, click the link for the dashboard you want to use as a starting point.
Configure dashboard settings
The dashboard settings affect all the panels on a dashboard. To configure settings, click Configure dashboard.Lay out the dashboard
A dashboard consists of rows and panels, and possibly columns (if you use Column panels). The table provides the available options.| Option | Notes |
|---|---|
 Add a row Add a row | Add a new row to the dashboard. |
 Configure a row Configure a row | Configure the selected row. |
 Add panel to an empty row Add panel to an empty row | 1. Click Add panel to an empty row. 2. Click Add panel. 3. Select Panel Type. 4. Configure the panel. 5. Click Add Panel. |
| Add a panel to a row that already contains panels | 1. Click Add a panel to this row. 2. Click Add panel. 3. Select Panel Type. 4. Configure the panel. 5. Click Add Panel. |
 Row Full Row Full | An indicator on the left side of a row that is full. |
| Resize a panel | 1. Click Configure.  2. Click the General tab. 3. In the Span field, specify a width between 1 (one twelfth) and 12 (twelve twelfths). |
| Drag a panel to a different location | 1. In the upper right corner of the panel, click-and-hold the panel type. 2. Drag the panel to the new location and release the panel. If you drag the panel on top of a different panel, the existing panel is shifted to another location. |
 Remove Panel Remove Panel | Remove a specific panel from the dashboard. |
| Place panels in a column | Configure panels in a column format. |
| Add text | Add text to the dashboard, such as instructions to use the dashboard or descriptions of the content in the dashboard. |
Configure panels
This section describes general tasks that apply to all panels and tasks that apply to specific types of panels.As a best practice, we recommend you configure each panel as you add it. Then save and test to verify it is set correctly before you add another panel.
| Option | Notes |
|---|---|
| Configure | The tabs that are available based on panel types are described in this section. Not all tabs are present for all panel types.
|
| View and configure Histogram and Range Facet panels | Click the View up arrow to view and modify the configuration. Click the down arrow to hide the configuration. |
 Help Help | Display help information for a setting. |
 Inspect Inspect | View the query that a panel sends to Solr. Fusion displays both the panel query and the custom query if it exists. |
| Make a panel editable | You must first remove, then add the panel back. 1. Click Remove Panel. 2. Click either Add panel to an empty row or Add Panel. 3. Enter the appropriate values and click the Editable check box. 4. Click Add Panel. |
| Make a panel non-editable | 1. Click Configure. 2. On the General tab, deselect the Editable check box. 3. Save the changes. |
Configure input panel settings
The elements on input panels determine the information displayed and is based on:- Panel configuration
- Panel contributions to the query
- User interactions with the panels
Configure specific types of panels
| Option | Notes |
|---|---|
 Add Search Box Add Search Box | Click to add a query-entry field to a Query panel. |
 Delete Search Box Delete Search Box | Click to remove a search box from a Query panel. |
| Move a column | Click the right or left arrow, respectively, to shift the column one space in that direction. |
Save the dashboard
You can save a dashboard to Solr, a file, or a GitHub gist. We recommend that you always save dashboards to Solr (even if you also save them as files or gists).| Option | Notes |
|---|---|
| Save in Solr | 1. Click Save. 2. Under Solr, enter a name for the dashboard. 3. Check or deselect the Make Public checkbox. If this checkbox is selected, the dashboard is shared with everyone. 4. Click Save. |
 Export Export | Click to enter the number of rows to export and select the destination file type. For example, CSV, XML, or JSON. Fusion downloads the dashboard as a file in the browser’s download directory. The filename is named **_dashboard\_name_**-**_large\_number_**. For example, Storefront-1502124761166. The file is a JSON file. It lacks the file type .json, which is not really needed (you could add it). If you want to place the file in a different location, move it. |
| Save as a GitHub gist | When you save a dashboard as a GitHub gist, you do not need to sign in to GitHub first. Fusion stores the gist as an anonymous gist. You must configure the dashboard correctly to save as a GitHub gist. To configure the dashboard: 1. Click Configure dashboard. 2. Click the Controls tab. 3. In the Allow saving to field, select Gist. 4. At the top right of the dashboard, click Save. 5. Under Gist, enter a name for the dashboard. The name becomes the title of the dashboard, which is stored in the JSON file as the value of "title". 6. Click Save Gist  . .Fusion displays the URL at which the gist resides. If you save the dashboard again, you get a different anonymous gist and a different URL. IMPORTANT: Navigate to the URL immediately. Save the URL. Bookmark it. Write it down. You cannot find the gist by searching for it, and Gist identifiers do not persist for long in the Fusion UI. (The last gist saved is available in the Load dialog for the duration of the browser session.) |
Test the dashboard
View and interact with the dashboard, and verify each panel displays the expected data. If necessary, adjust the placement and settings of the panels based on user feedback.Use Dashboards in Fusion
Use Dashboards in Fusion
This topic details the options available to use Fusion dashboards.
For more information, see Fusion 5.x Built-in Dashboards.


Dashboards main page
When you open the Fusion dashboards, your organization’s dashboards display, as well as the EXPLORE DASHBOARDS section that provides options to create or display specific types of dashboards.You can click the icons in the top right corner of the screen to perform the following functions:| Option | Notes |
|---|---|
 Goto saved default Goto saved default | Open the saved default dashboard. |
 New New | Create a new dashboard. Options are:
|
 Load Load | Load a dashboard using one of the following options:
|
 Save Save | Save options include:
|
| Configure Dashboard | Click to configure tabs for General, Rows, Control, and Solr dashboard settings. |
| Delete a dashboard saved in Solr |
|
| Delete a dashboard saved in a file | Navigate to the file and delete it. |
| Delete a dashboard saved as a GitHub gist | Open the gist URL and click Delete. |
Interact with data
The table describes options to interact with data displayed in certain dashboards.| Option | Notes |
|---|---|
| Collections | Choose the collection from which to obtain data. If a dashboard is configured to let users choose among collections, select the collection from the Collections drop-down list at the top right of the dashboard. |
 Search Search | Enter the value to search.
|
 Clear search box Clear search box | Click to clear the search box and return the most general query, as if you entered *.*. |
 Waiting for data Waiting for data | Indicates the query is waiting for data to be returned. If the indicator spins for an extended time while other panels display data, the panel is not configured correctly. |
| Select item | Click a table row. In a graphical-visualization panel, click the data item. NOTE: Not all panel types let you select data in this way. |
| Export data | Click to enter the number of rows to export and select the destination file type. For example, CSV, XML, or JSON. |
 Hide row Hide row | Click to hide the row from the display. |
 Expand row Expand row | Click the row to display detailed information. |
Interact with specific types of panels
The table describes options for specific types of panels.Table and text panels
| Option | Notes |
|---|---|
| Show or hide the field list | Click the right or left arrow, respectively, at the top of the panel. |
| Sort a table column | Click the up arrow at the top of the column to sort in ascending order. Click the down arrow at the top of the column to sort in descending order. |
| View next or previous page of hits | Click the right or left arrow, respectively, at the bottom of the page of hits. |
 View first page View first page | Click to view the first page of hits for that particular panel. |
| Show record details | Click the table row and then select the display format of Table, JSON, or Raw. |
| Hide details | Click the up arrow at the top right of the details. |
Histogram and Range Facet panels
The table describes options for the Histogram and Range Facet panels.| Option | Notes |
|---|---|
| Zoom in on a subset of data | Click the area you want to enlarge, then drag across the range of data to zoom in. |
 Zoom out Zoom out | Click to zoom out. |
Filtering panels
The table describes filter options for panels.| Option | Notes |
|---|---|
 Edit filter Edit filter | Click to edit a panel filter. |
 Toggle filter Toggle filter | Click to toggle the filter to the opposite setting (on or off). |
 Remove filter Remove filter | Click to remove the current filter. CAUTION: To display correctly, specific filters must be set for certain types of panels. Fusion also creates filters based on your interactions with data. You can add a filter back, but there is no undo. Before you remove a filter, toggle off the filter and verify the results. If the results are accurate, it is safe to remove it. |
Heat Map panels
The table describes the option for heat map panels.| Option | Notes |
|---|---|
 Transpose rows and columns Transpose rows and columns | Click to reverse the display of rows and columns. |
Filter by Fusion request ID
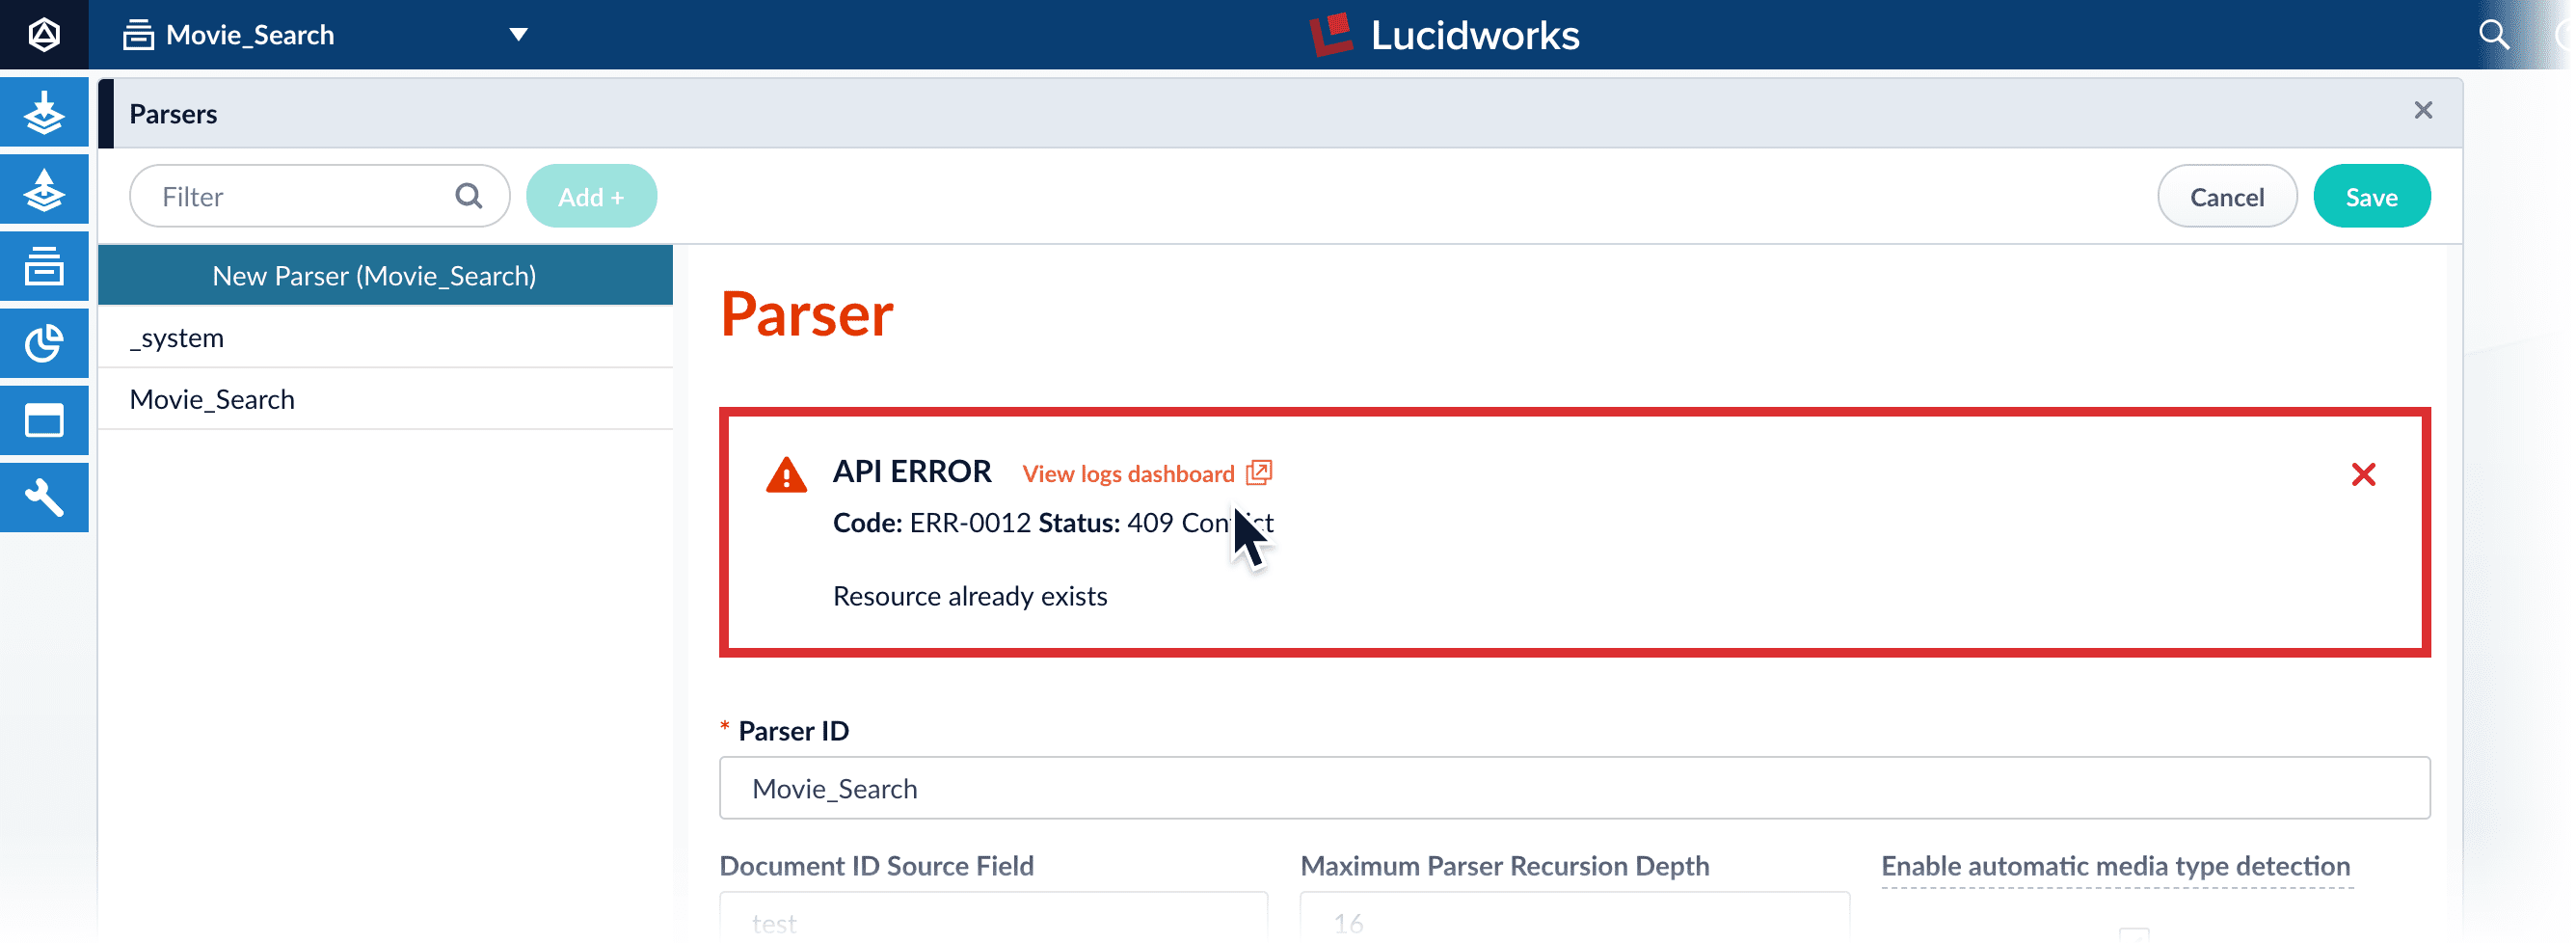
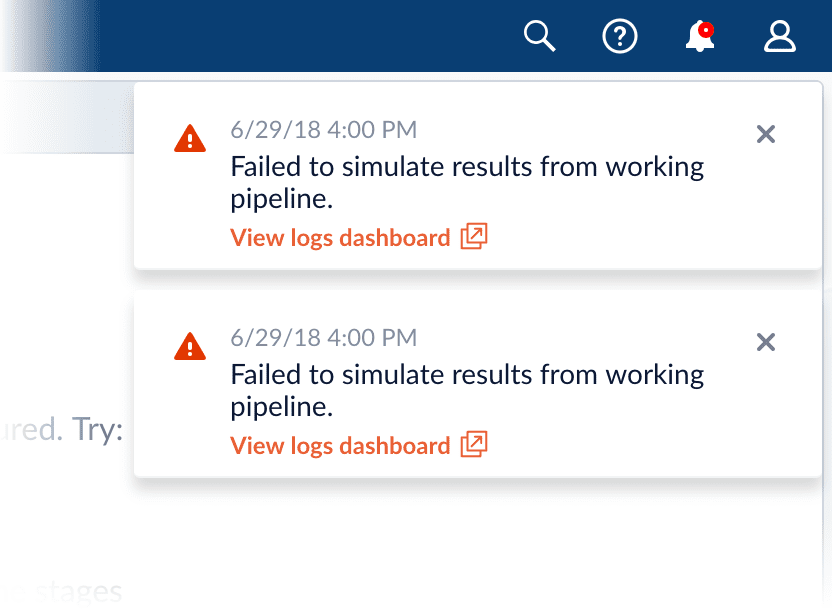
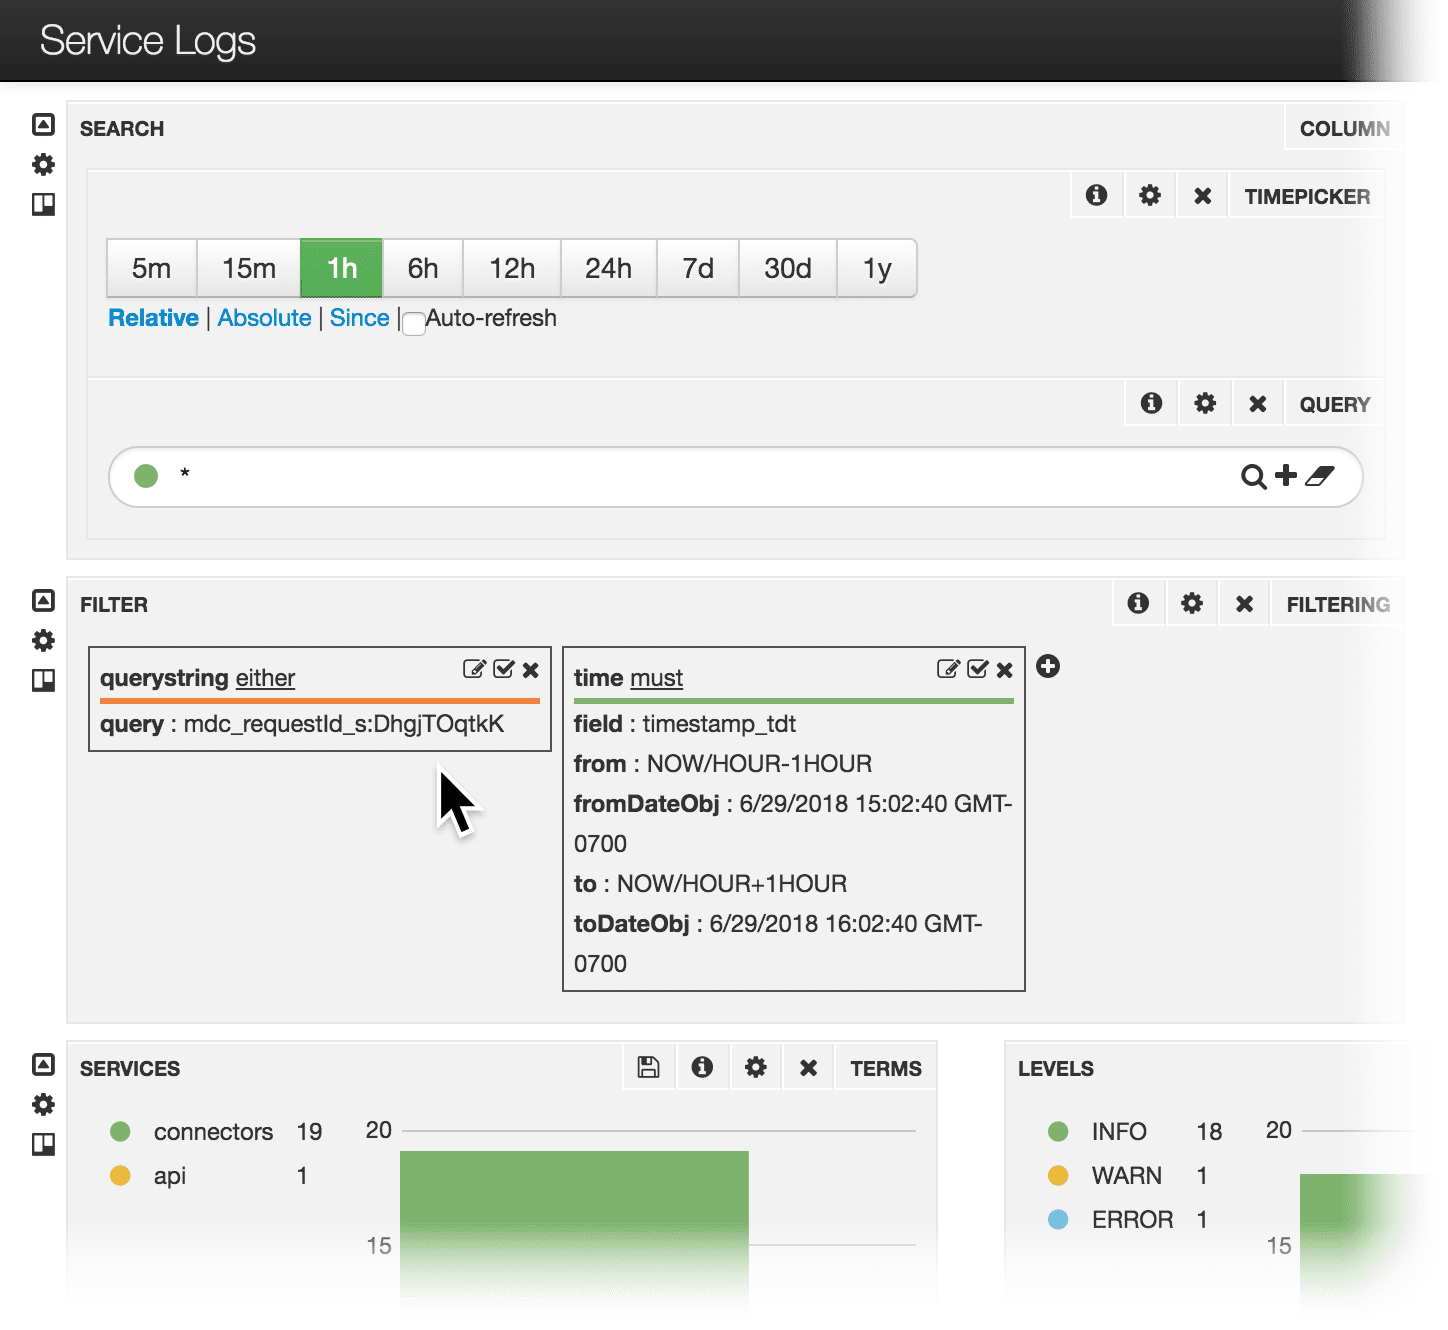
To only display information about log entries with a specific Fusion request ID, you can filter the contents of a logs dashboard by the Fusion request ID.Filter the contents in the following ways:- Click a link in the error message or toast
- Filter in a logs dashboard
- Append a query filter parameter to the dashboard URL
Click a link in the error message or toast
To view the dashboard for a Fusion UI API error or API error toast, click View logs dashboard. The system displays the dashboard using a filter for that request ID.API error with link in Fusion UI:mdc_requestId_s field displays the fusion-request-id of BWQSjPPYgB.Append a query filter parameter to the dashboard URL
As an alternative to constructing a query filter in the dashboard, you can append a query filter parameter to the dashboard URL. In the query filter, use the field namemdc_requestID_s.Example 1: Default dashboard (Service Logs)Open the Service Logs dashboard from a job history
-
Open the job history.
- For most jobs, click Collections > Jobs, select a job, and then click Job History.
-
For datasource jobs, click Indexing > Datasources, select a datasource, and then click Job History.
In the job history, you will see a link named
runId: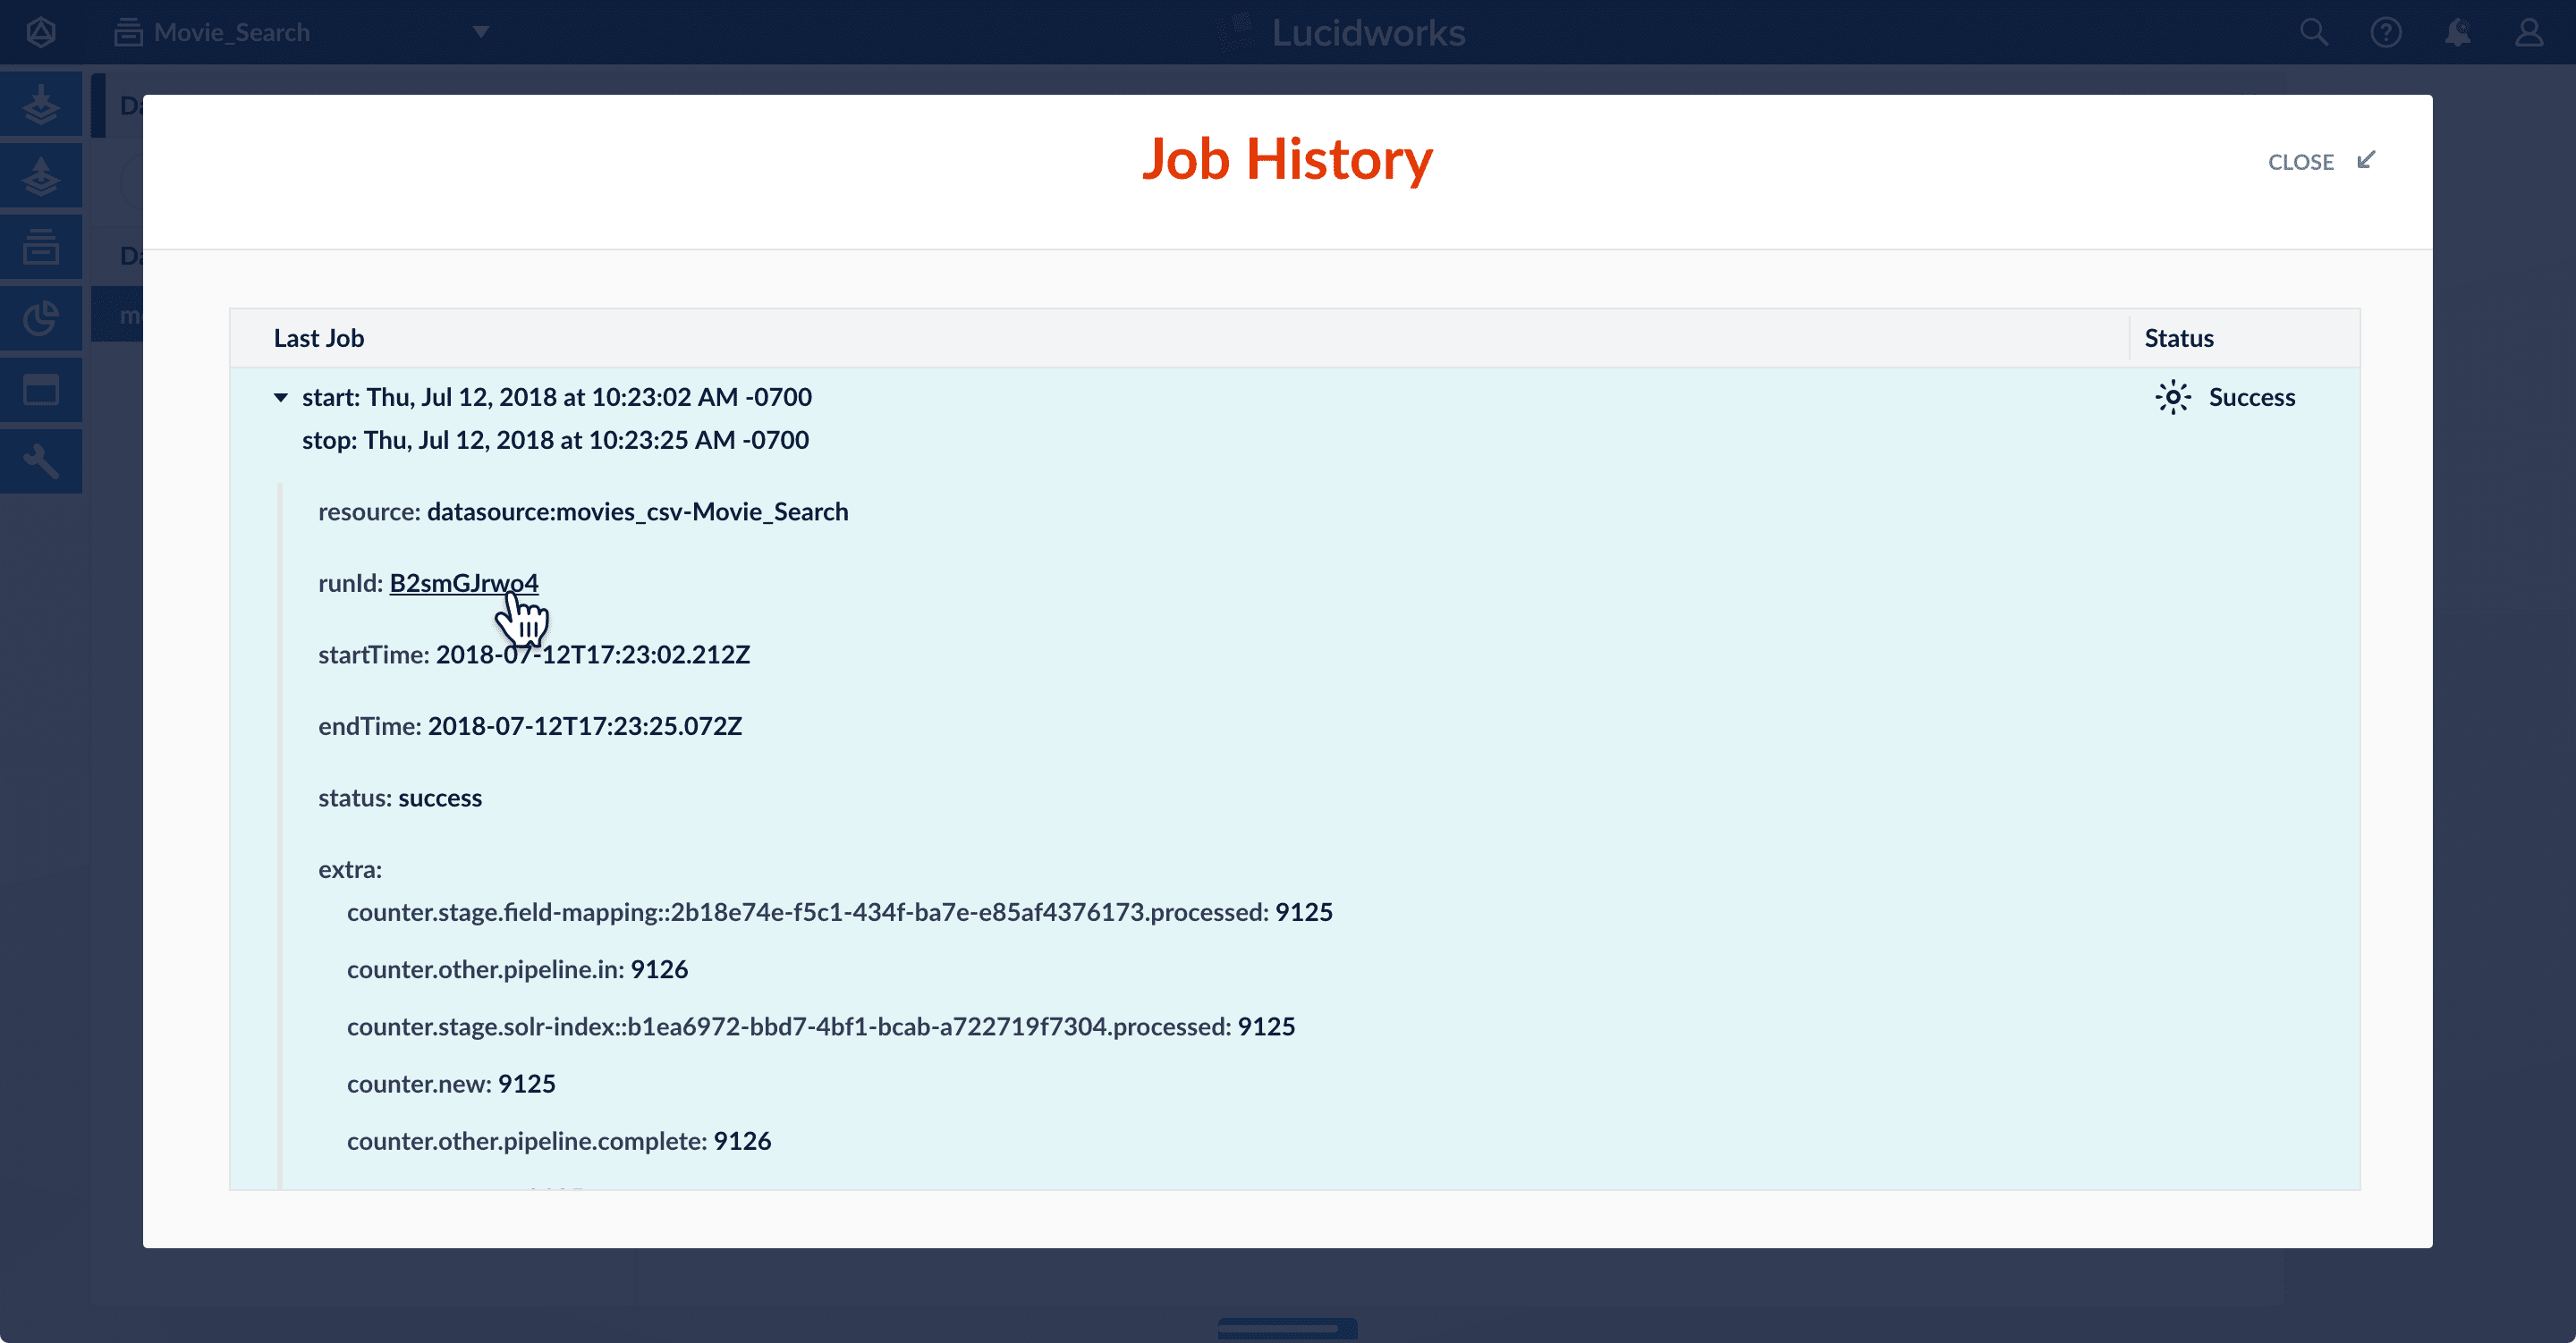
-
Click the link to view the Service Logs dashboard filtered by the
runId: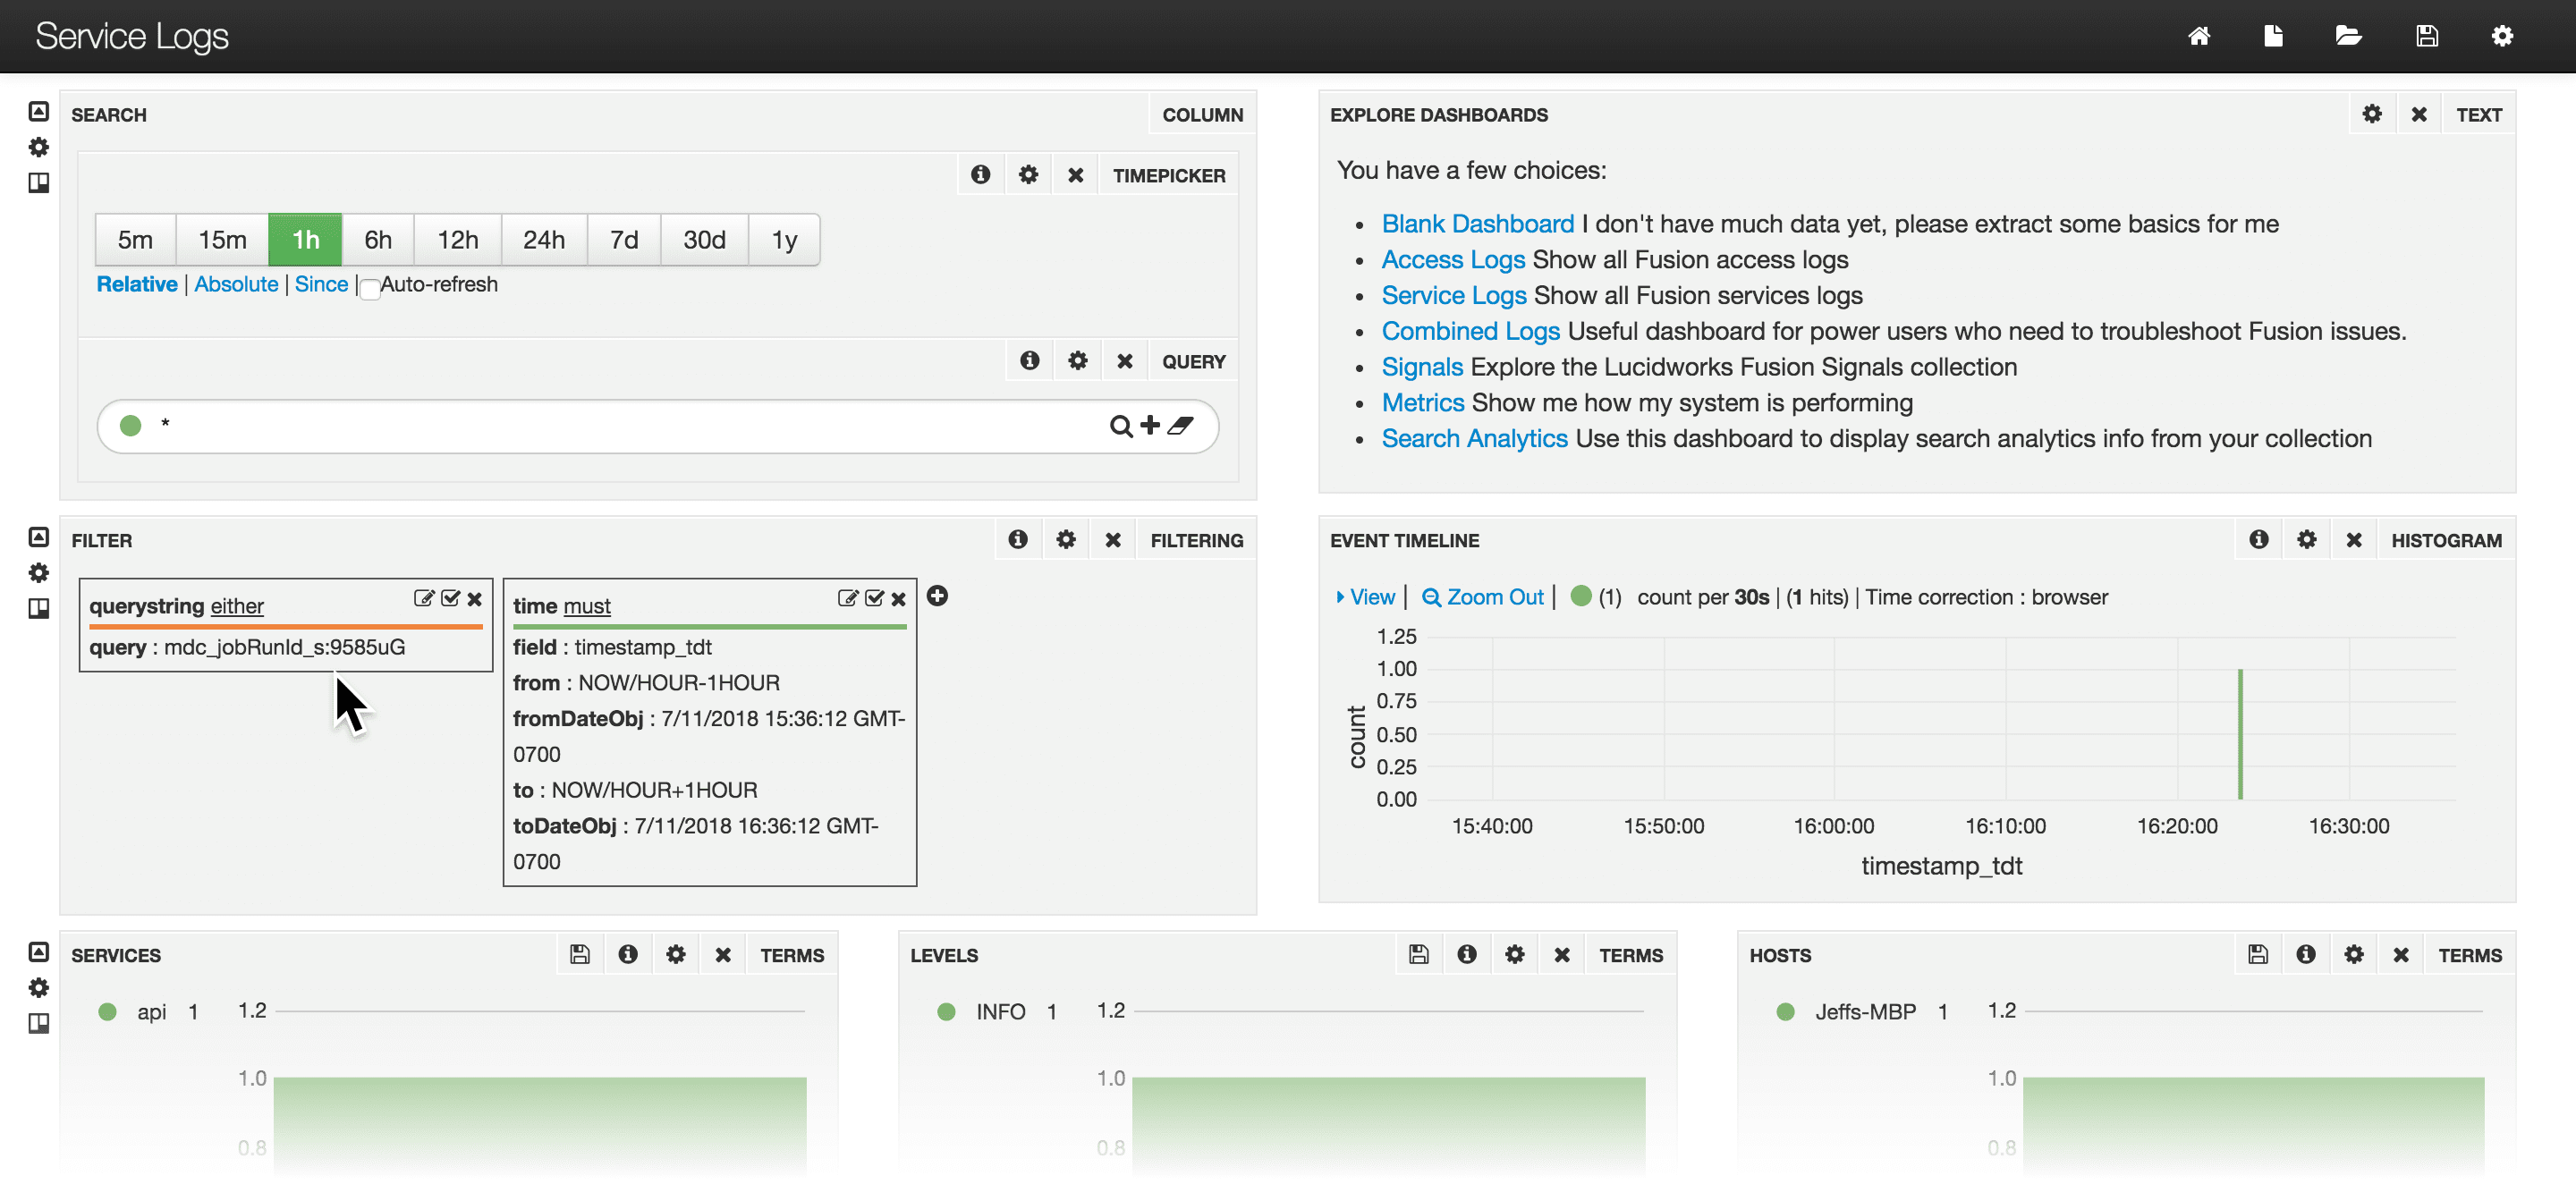
Manage Dashboards
Manage Dashboards
Set Permissions
Users who manage or use dashboards need specific permissions to do so.Permissions to Manage Dashboards
The built-in rolesadmin and developer both have sufficient permissions to manage dashboards.For users who manage dashboards, set these permissions in roles, and then assign the roles to users:Permissions to Use Dashboards
The built-in rolesearch does not have sufficient permissions to use dashboards.For users who manage dashboards, set these permissions in roles, and then assign the roles to users:Manage Dashboards
This topic details the options available to use Fusion dashboards.Dashboards main page
When you open the Fusion dashboards, your organization’s dashboards display, as well as the EXPLORE DASHBOARDS section that provides options to create or display specific types of dashboards.You can click the icons in the top right corner of the screen to perform the following functions:| Option | Notes |
|---|---|
| Goto saved default | Open the saved default dashboard. |
| New | Create a new dashboard. Options are: ● Time-series dashboard ● Non time-series dashboard |
| Load | Load a dashboard using one of the following options: ●Load dashboard JSON layout from file Click Local File > Choose File > select file > Open. Saved dashboards are listed at the bottom of the dialog box. Click a dashboard to open it. Filter dashboards by entering an exact-match string in the Filter box. If there are more that 20 saved dashboards, use the pagination controls to find a dashboard. To view the next set of pages, click the forward arrows. To view the prior set of pages, click the back arrows. Or click a page number to view the dashboards on that page. ● Enter the gist URL or number (the last part of the URL) Enter value > click Get  . .A link that opens the dashboard appears below a thin line. The link displays the dashboard name. Click the link to open the dashboard. ● Type to filter. Enter dashboard type to filter and display if the dashboard matches. |
| Save | Save options include: ●Locally Export to File Set as Browser Default. Click to set the current dashboard as the default. Clear Browser Default. Click to clear the current dashboard. The default dashboard for the browser becomes the system default dashboard default.json (the Fusion Logs dashboard). ●Solr Make Public. If this checkbox is selected, the dashboard is shared with everyone. Service Logs. Enter a value and click Save to save the log. |
| Configure Dashboard | Click to configure tabs for General, Rows, Control, and Solr dashboard settings. |
| Delete a dashboard saved in Solr | 1. Click Load. 2. Identify the file to delete and click Delete. 3. Click OK to confirm the deletion. |
| Delete a dashboard saved in a file | Navigate to the file and delete it. |
| Delete a dashboard saved as a GitHub gist | Open the gist URL and click Delete. |
Interact with data
The table describes options to interact with data displayed in certain dashboards.| Option | Notes |
|---|---|
| Collections | Choose the collection from which to obtain data. If a dashboard is configured to let users choose among collections, select the collection from the Collections drop-down list at the top right of the dashboard. |
| Search | Enter the value to search. ●To search for a specific value, enter a term or phrase and click Search. ●To retrieve all data, enter \*.\* and click Search. |
| Clear search box | Click to clear the search box and return the most general query, as if you entered \*.\*. |
| Waiting for data | Indicates the query is waiting for data to be returned. If the indicator spins for an extended time while other panels display data, the panel is not configured correctly. |
| Select item | Click a table row. In a graphical-visualization panel, click the data item. NOTE: Not all panel types let you select data in this way. |
| Export data | Click to enter the number of rows to export and select the destination file type. For example, CSV, XML, or JSON. |
| Hide row | Click to hide the row from the display. |
| Expand row | Click the row to display detailed information. |
Interact with specific types of panels
The table describes options for specific types of panels.Table and text panels
| Option | Notes |
|---|---|
| Show or hide the field list | Click the right or left arrow, respectively, at the top of the panel. |
| Sort a table column | Click the up arrow at the top of the column to sort in ascending order. Click the down arrow at the top of the column to sort in descending order. |
| View next or previous page of hits | Click the right or left arrow, respectively, at the bottom of the page of hits. |
| View first page | Click to view the first page of hits for that particular panel. |
| Show record details | Click the table row and then select the display format of Table, JSON, or Raw. |
| Hide details | Click the up arrow at the top right of the details. |
Histogram and Range Facet panels
The table describes options for the Histogram and Range Facet panels.| Option | Notes |
|---|---|
| Zoom in on a subset of data | Click the area you want to enlarge, then drag across the range of data to zoom in. |
| Zoom out | Click to zoom out. |
Filtering panels
The table describes filter options for panels.| Option | Notes |
|---|---|
| Edit filter | Click to edit a panel filter. |
| Toggle filter | Click to toggle the filter to the opposite setting (on or off). |
| Remove filter | Click to remove the current filter. CAUTION: To display correctly, specific filters must be set for certain types of panels. Fusion also creates filters based on your interactions with data. You can add a filter back, but there is no undo. Before you remove a filter, toggle off the filter and verify the results. If the results are accurate, it is safe to remove it. |
Heat Map panels
The table describes the option for heat map panels.| Option | Notes |
|---|---|
| Transpose rows and columns | Click to reverse the display of rows and columns. |