

How MCP usage is measured
All MCP traffic enters Fusion through the API gateway at the/mcp route.
The gateway records a per-route latency histogram, gateway_request_time_secs, on every request.
The label routeId="mcp-server" isolates MCP traffic from all other gateway routes, providing a clean MCP-only view without touching the MCP server itself.
The histogram carries these labels:
The histogram exposes three series families:
gateway_request_time_secs_count— total number of requestsgateway_request_time_secs_sum— sum of all request durations in secondsgateway_request_time_secs_bucket— histogram buckets that power the latency percentiles
Prerequisites
- Fusion 5.17 or later with Lucidworks MCP Server deployed and serving traffic
- Prometheus (or any Prometheus-compatible TSDB) able to scrape your Fusion cluster
- Grafana with your Prometheus configured as a data source
Set up MCP monitoring
Setup steps
Setup steps
1
Configure Prometheus to scrape the API gateway.
Configure Prometheus to scrape the gateway’s
/actuator/prometheus endpoint on port 6764.
Use whichever method matches your setup:- Prometheus Operator
- Scrape annotations
- Static configuration
Create a
ServiceMonitor resource:If your Prometheus Operator selects
PodMonitor resources instead of services, use a PodMonitor with the same selector and a podMetricsEndpoints entry on port 6764.2
Verify the metrics collection.
In Prometheus (or Grafana Explore), run:You should see a series with
routeId="mcp-server" once the MCP server has received traffic.
If it’s absent, confirm the scrape target is UP and that MCP requests have actually been made.3
Import the Grafana dashboard.
- Download mcp-usage-dashboard-portable.json.
- In Grafana, go to Dashboards → New → Import.
- Upload the JSON file.
- When prompted, select your Prometheus data source.
- Click Save.
Dashboard panels
The imported dashboard includes panels organized into three sections: overview metrics, latency analysis, and traffic breakdown.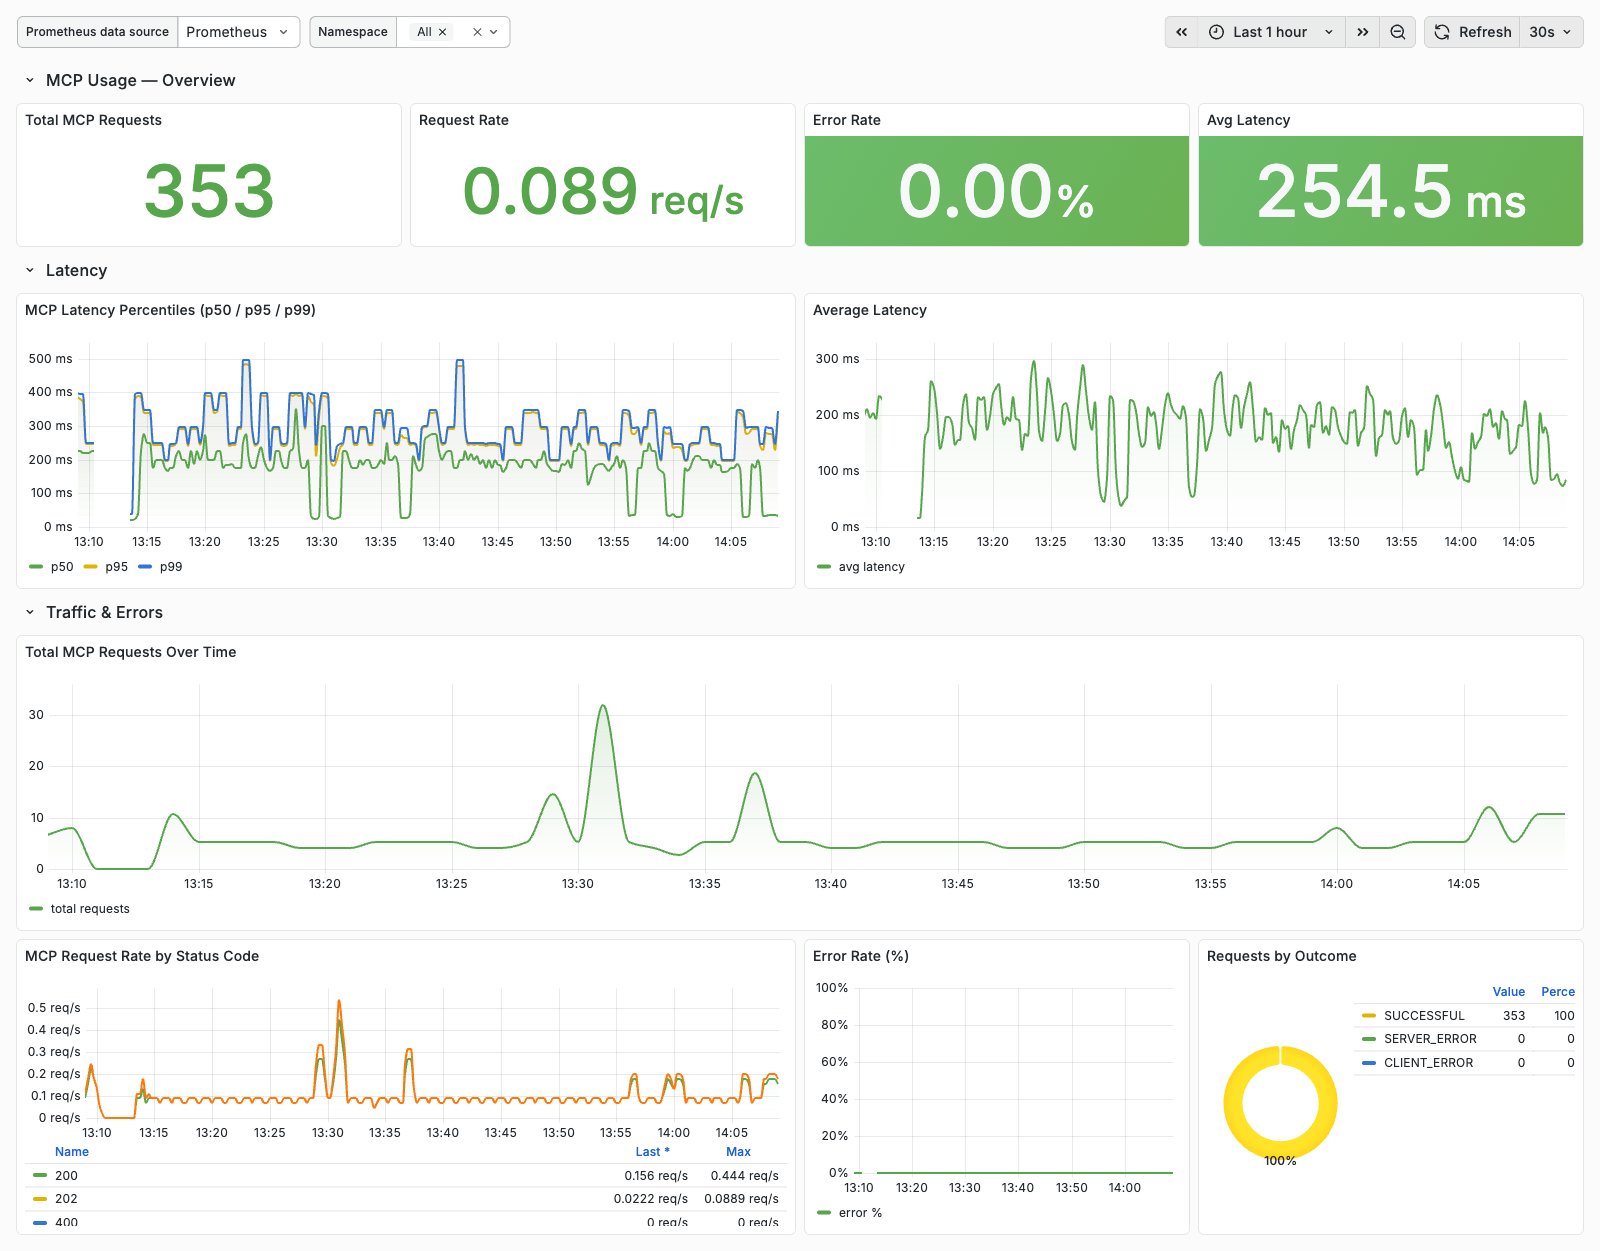
Overview metrics
Latency metrics
Traffic metrics and errors
PromQL query examples
Use these queries to build custom dashboard panels or understand what powers each panel in the imported dashboard. Replace$namespace with your Kubernetes namespace or use .* to match all namespaces.
Total requests (over the dashboard range)
Total requests (over the dashboard range)
Total requests over time
Total requests over time
Request rate (req/s)
Request rate (req/s)
Error rate (%)
Error rate (%)
Average latency (ms)
Average latency (ms)
p50 latency (ms)
p50 latency (ms)
p95 latency (ms)
p95 latency (ms)
p99 latency (ms)
p99 latency (ms)
Requests by status code (req/s)
Requests by status code (req/s)
Troubleshooting
No mcp-server series appears
No mcp-server series appears
The scrape target may not be up, or no MCP traffic has occurred yet.
Verify with
up{job="fusion-api-gateway"} and check that the /mcp endpoint is in use.Percentile panels are empty
Percentile panels are empty
Confirm
gateway_request_time_secs_bucket series exist.
Some scrape pipelines drop histogram buckets via a keep/drop relabel rule — make sure _bucket series are retained.Latency values seem wrong
Latency values seem wrong
gateway_request_time_secs is measured in seconds; the dashboard multiplies by 1000 to display milliseconds.Metrics endpoint requires authentication
Metrics endpoint requires authentication
If you have locked down the actuator endpoint, ensure your Prometheus scrape provides the necessary credentials.
Notes
- This dashboard measures MCP usage at the gateway, which is the cleanest signal for request volume, status, and latency.
It does not break usage down per MCP tool (such as
search_documents,get_document) — that would require additional instrumentation in the MCP server. - The same metric (
spring_cloud_gateway_requests_seconds) is also emitted by the gateway as a Micrometer summary; this guide uses thegateway_request_time_secshistogram because it supports latency percentiles.