Tooltips
Tooltips display information when you hover over a point or area of the chart. Tooltips can be set across the whole chart or specifically to a series using the Chart Tooltip tag. This tag must be nested in the Chart Display tag, or in either of the series tags (Series Facet tag and Series Result List tag) if the tooltip is specific to a series.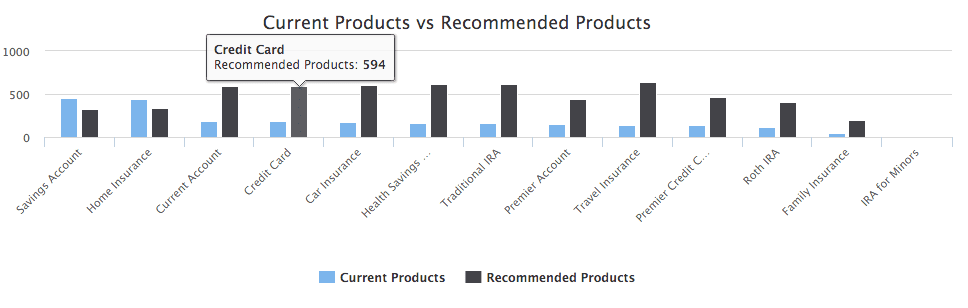
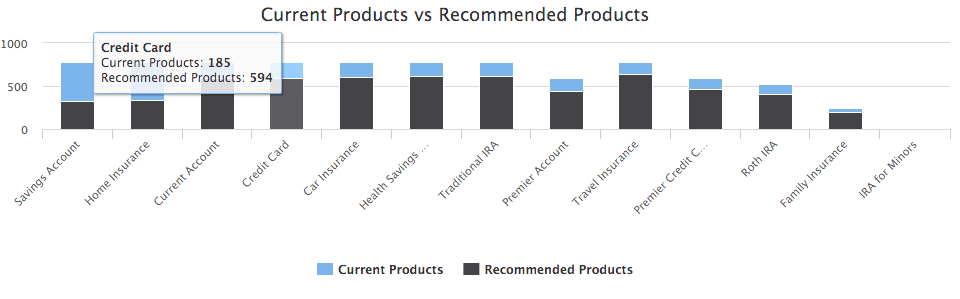
Shared Tooltip
If you are rendering more then one series you can set the tooltip to be shared, this means it will display information about all the series for the point you have hovered over.