Documentation IndexFetch the complete documentation index at: /llms.txtUse this file to discover all available pages before exploring further.
Fetch the complete documentation index at: /llms.txt
Use this file to discover all available pages before exploring further.
Action required: Upgrade to Fusion 5.17.2 to apply urgent security patches. Lucidworks Search clients will be upgraded automatically.
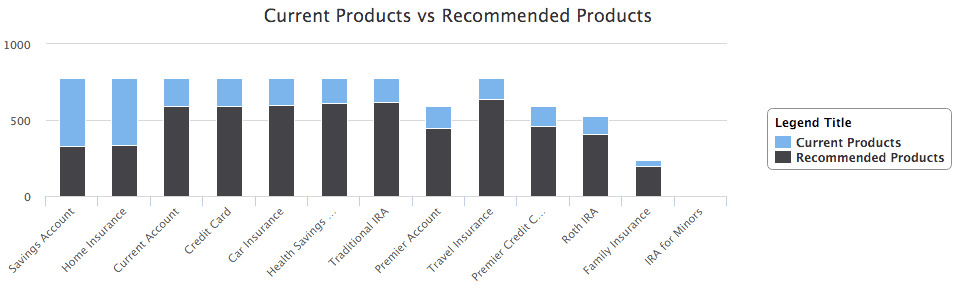
<chart:display response="response" title="Current Products vs Recommended Products" stacking="normal">
    <series:facet name="current_products" type="column" title="Current Products"></series:facet>
    <series:facet name="recommended_products" type="column" title="Recommended Products"></series:facet>
    <chart:legend title="Legend Title"  align="right" vertical-align="top" layout="vertical" y="100" border-radius="5" border-width="1"></chart:legend>
</chart:display>
Was this page helpful?