TheDocumentation Index
Fetch the complete documentation index at: https://doc.lucidworks.com/llms.txt
Use this file to discover all available pages before exploring further.
qqplot function calculates percentiles (1-99) for two sample sets, based on queries, so they can be compared visually. The qqplot function takes four parameters:
- The numeric field for which to calculate the percentiles
- The Lucene/Solr query for the sample set A
- The Lucene/Solr query for the sample set B
- The sample size for both sample sets
Sample syntax
Result set
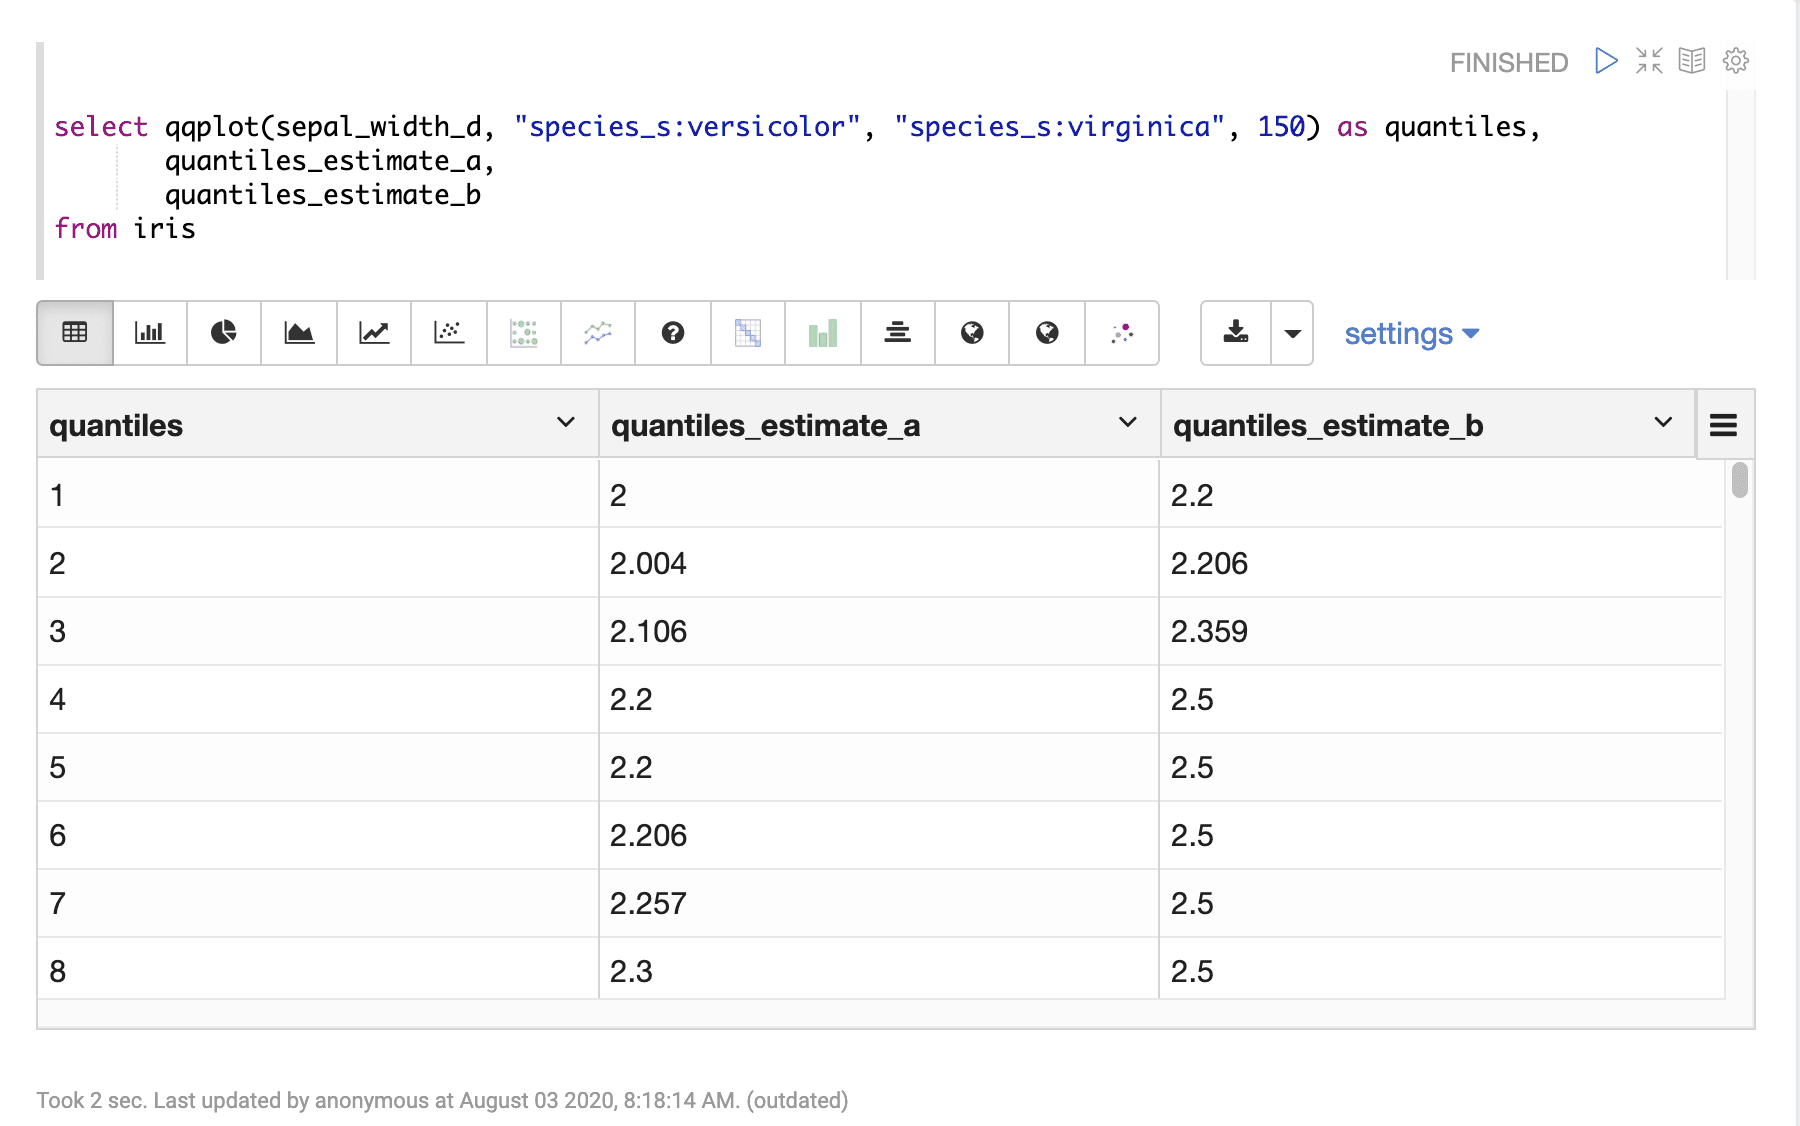
The result set for theqqplot function contains one row for each percentile 1-99. The qqplot function returns the percentile (1-99). The quantiles_estimate_a and quantiles_estimate_b fields contain the estimated percentile value, for sample sets A and B, at each percentile.
Sample result set in Apache Zeppelin
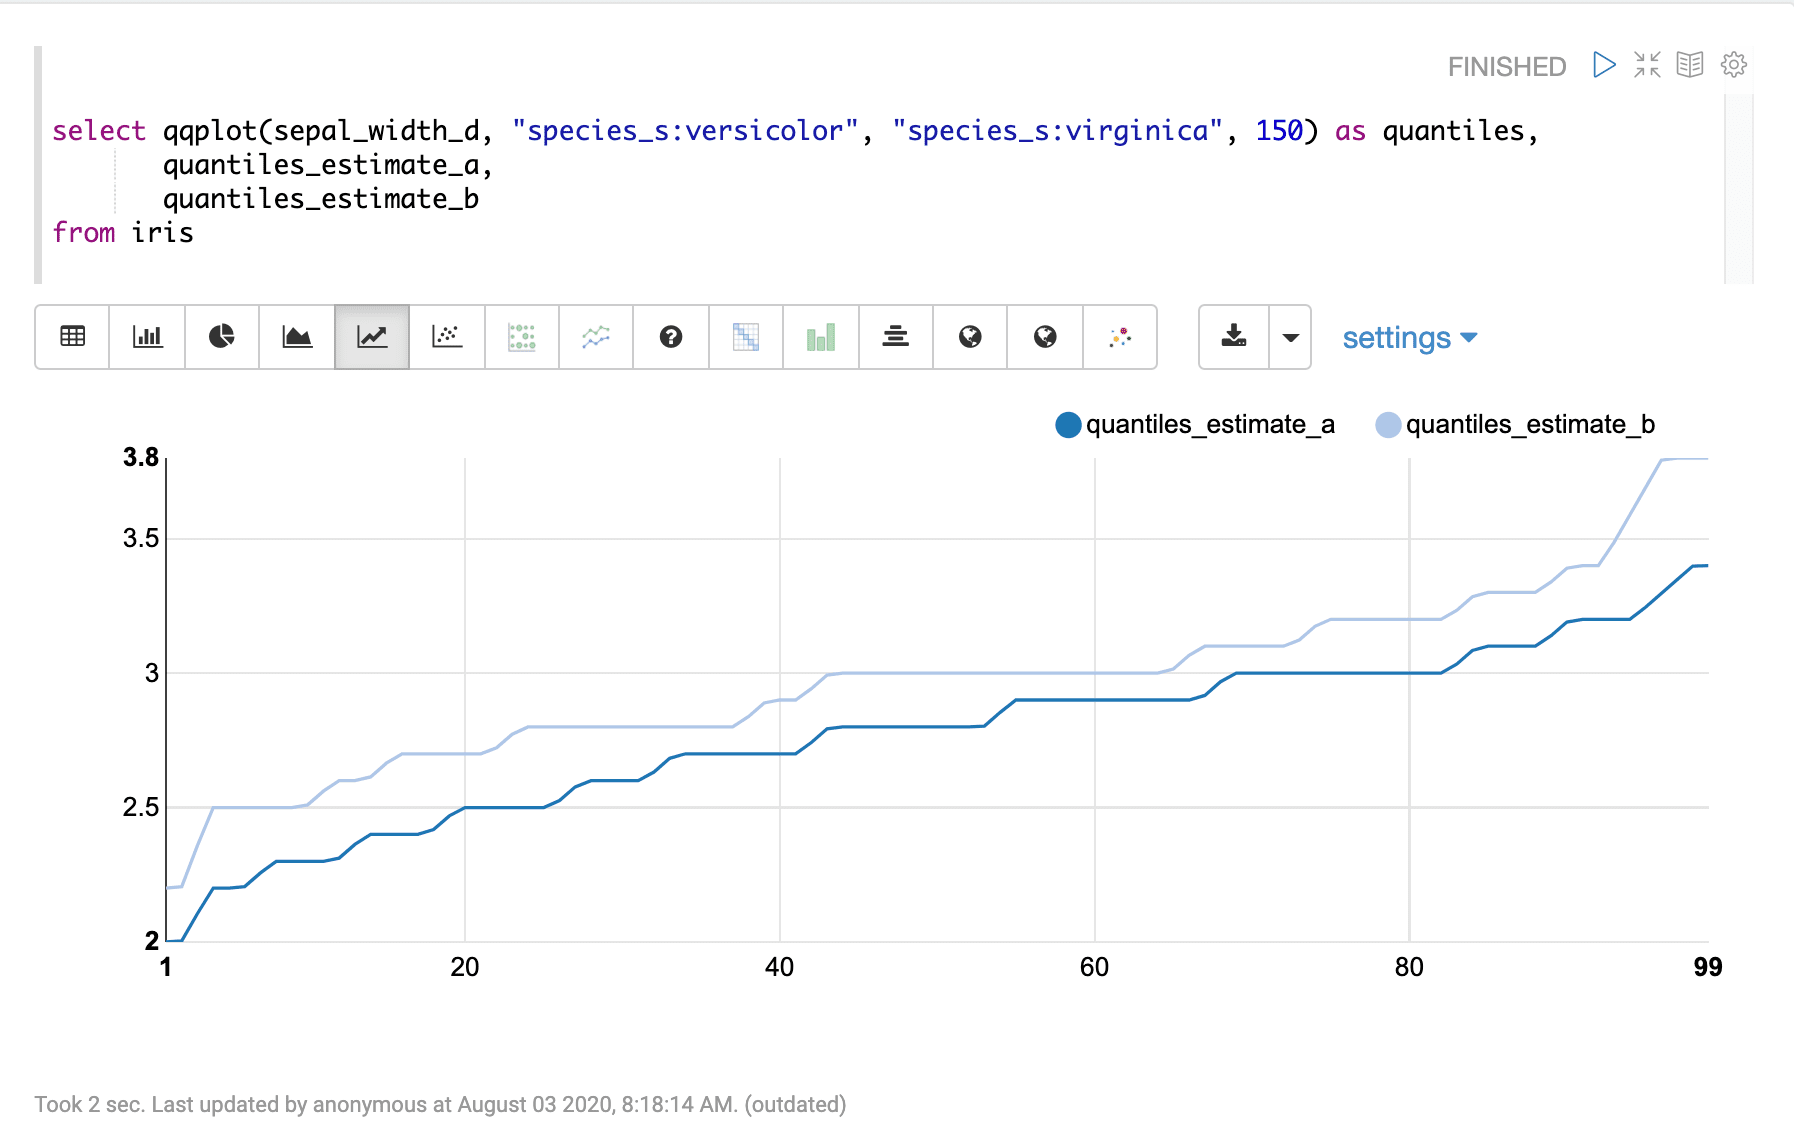
Visualization
The qqplot function can be visualized by plotting the percentile (1-99) on the x-axis and the quantiles_estimate_a and quantiles_estimate_b columns on the y-axis. Sample visualization of percentiles in Apache Zeppelin