Skip to main content
Lucidworks documentation home page
4.2
Search anything
⌘K
Archive docs
LucidAcademy
Book a demo
Book a demo
Search...
Navigation
App Insights
App Insights Dashboards
SaaS Platform
Platform APIs
Self-hosted Fusion
Managed Fusion
Fusion APIs
Connectors
Policies
Fusion Server
Overview
Fusion Concepts and Components
Reference Guides
Release Notes
Fusion AI
Overview
Fusion AI Concepts
Overview
Signals and Aggregations
Smart Answers
App Insights
Overview
Analytics
App Insights Dashboards
Events
Experiment Results
Sessions
Recommendations and Boosting
Query Rewriting
Overview
Machine Learning
Natural Language Processing
Parallel Bulk Loader (PBL)
Response Rewriting
Reference Guides
Release Notes
App Studio
Overview
App Studio Reference Guides
App Studio Concepts
Fusion App Studio Release Notes
On this page
Dashboard filtering
Fusion AI
Fusion AI Concepts
App Insights
App Insights Dashboards
Copy page
Copy page
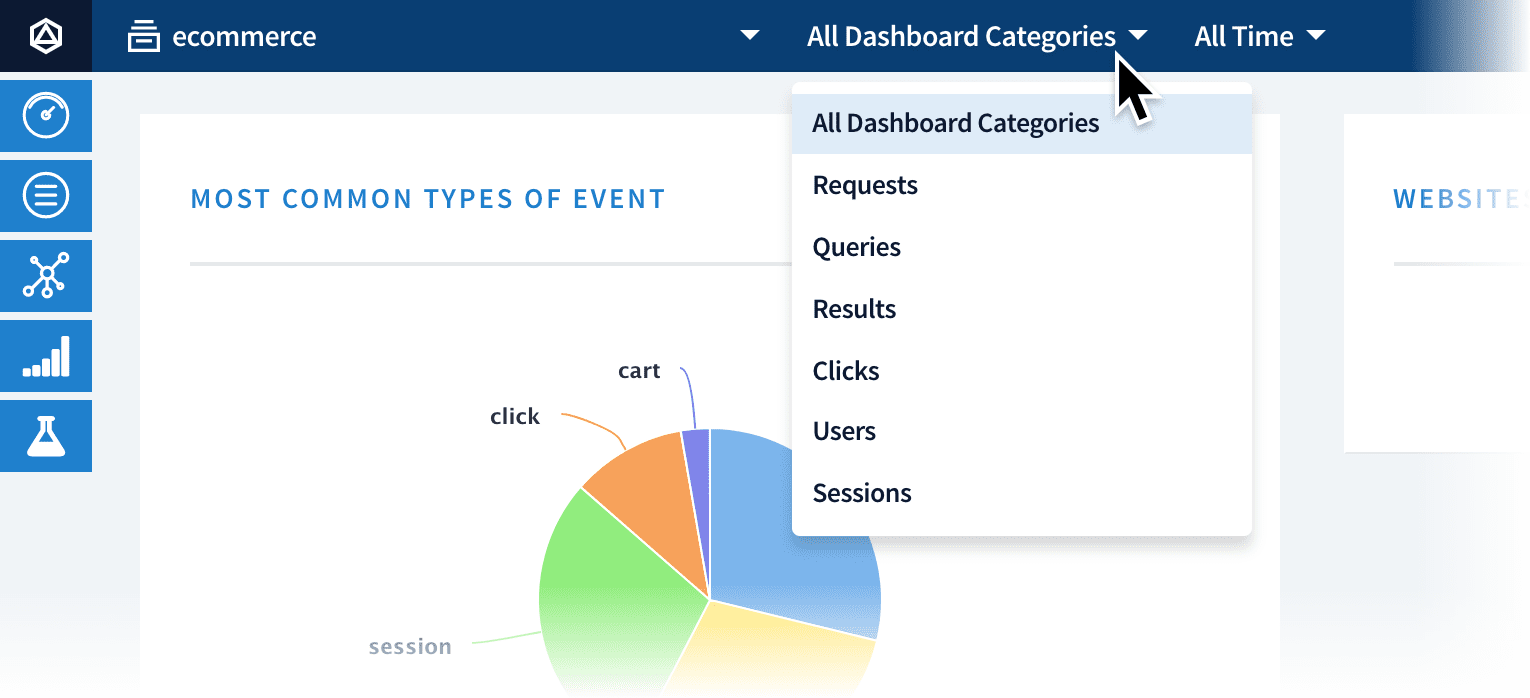
When you open the Dashboards page, it displays graphs and tables for attributes that are common to all signals. For more specific charts, you can open the
All Dashboard Categories
menu at the top and select a category:
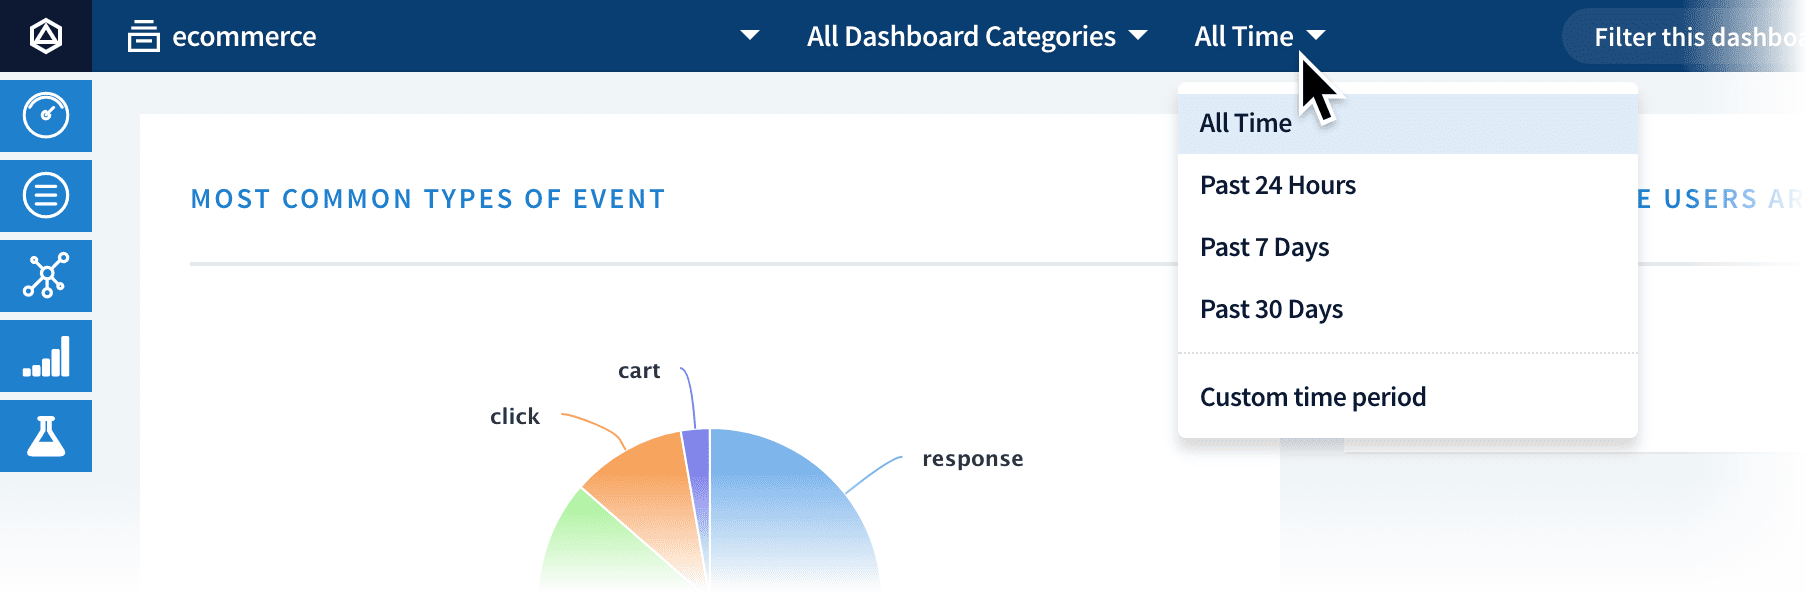
Dashboard filtering
You can filter by timeframe using the
All Time
menu:
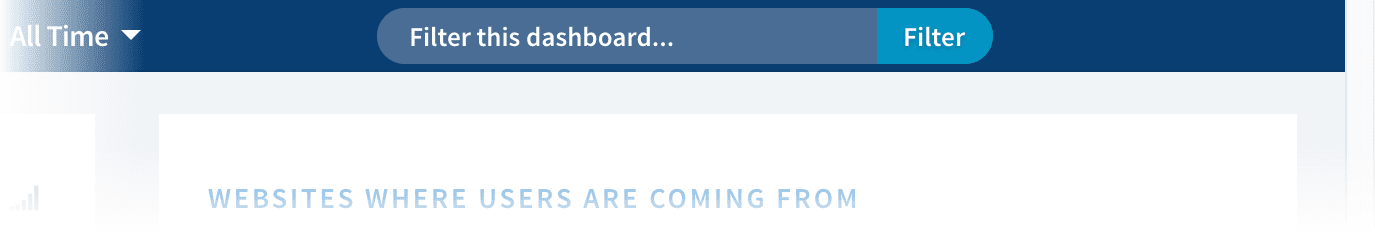
To filter by the content of the data, enter a string in the
Filter this dashboard…
text box:
Was this page helpful?
Yes
No
Analytics
Events
⌘I