Documentation Index Fetch the complete documentation index at: https://doc.lucidworks.com/llms.txt
Use this file to discover all available pages before exploring further.
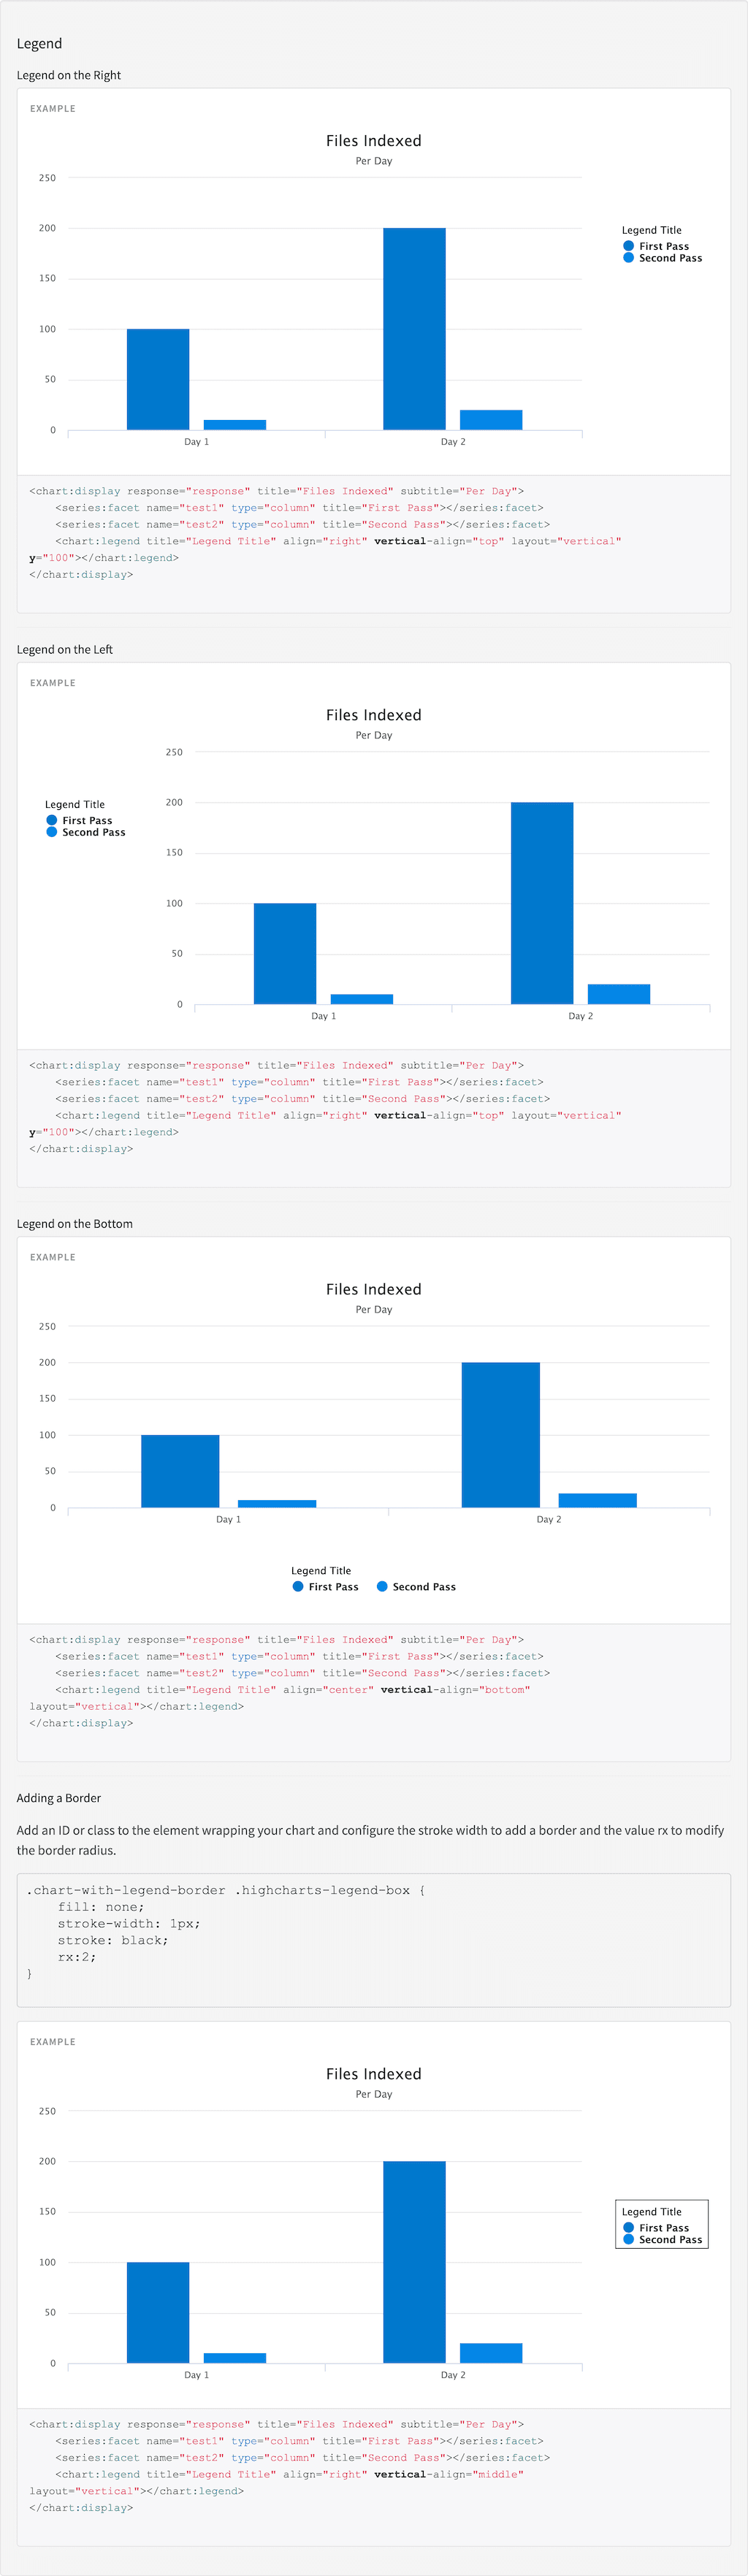
Description A legend is displayed when the chart has multiple series, with the Chart
Legend tag you can customise the legend with a title, border and
location on the chart along with other things. This tag must be nested
in the Chart Display tag .
Usage as element:
< chart:legend [title= "{string}" ] [align= "{string}" ] [vertical-align= "{string}" ] [layout= "{string}" ] [x= "{string}" ] [y= "{string}" ] > </ chart:legend >
Directive info
This directive creates new scope.
Parameters Param Type Details title (optional) string The title of the legend. align (optional) string The horizontal alignment of the legend box within the chart area. Valid values are ‘left’, ‘center’ and ‘right’. vertical-align (optional) string The vertical alignment of the legend box. Valid values are ‘top’, ‘middle’ or ‘bottom’. layout (optional) string The layout of the legend items. Can be one of ‘horizontal’ or ‘vertical’. x (optional) string The x offset of the legend relative to its horizontal alignment ‘align’. Negative x moves it to the left, positive x moves it to the right. y (optional) string The vertical offset of the legend relative to it’s vertical alignment ‘verticalAlign’. Negative y moves it up, positive y moves it down.
Example Source < div ng-controller = "ExampleController" > < h3 id = "example_legend" > Legend </ h3 > < h4 id = "example_legend_legend-on-the-right" > Legend on the Right </ h4 > < tk-example > < chart:display response = "response" title = "Files Indexed" subtitle = "Per Day" > < series:facet name = "test1" type = "column" title = "First Pass" ></ series:facet > < series:facet name = "test2" type = "column" title = "Second Pass" ></ series:facet > < chart:legend title = "Legend Title" align = "right" vertical-align = "top" layout = "vertical" y = "100" ></ chart:legend > </ chart:display > </ tk-example > < tk-code-wrapper > < code hljs > < chart:display response = "response" title = "Files Indexed" subtitle = "Per Day" > < series:facet name = "test1" type = "column" title = "First Pass" ></ series:facet > < series:facet name = "test2" type = "column" title = "Second Pass" ></ series:facet > < chart:legend title = "Legend Title" align = "right" vertical-align = "top" layout = "vertical" y = "100" ></ chart:legend > </ chart:display > </ code > </ tk-code-wrapper > < hr /> < h4 id = "example_legend_legend-on-the-left" > Legend on the Left </ h4 > < tk-example > < chart:display response = "response" title = "Files Indexed" subtitle = "Per Day" > < series:facet name = "test1" type = "column" title = "First Pass" ></ series:facet > < series:facet name = "test2" type = "column" title = "Second Pass" ></ series:facet > < chart:legend title = "Legend Title" align = "left" vertical-align = "top" layout = "vertical" y = "100" ></ chart:legend > < chart:legend title = "Legend Title" align = "left" vertical-align = "top" layout = "vertical" y = "100" ></ chart:legend > </ chart:display > </ tk-example > < tk-code-wrapper > < code hljs > < chart:display response = "response" title = "Files Indexed" subtitle = "Per Day" > < series:facet name = "test1" type = "column" title = "First Pass" ></ series:facet > < series:facet name = "test2" type = "column" title = "Second Pass" ></ series:facet > < chart:legend title = "Legend Title" align = "right" vertical-align = "top" layout = "vertical" y = "100" ></ chart:legend > </ chart:display > </ code > </ tk-code-wrapper > < hr /> < h4 id = "example_legend_legend-on-the-bottom" > Legend on the Bottom </ h4 > < tk-example > < chart:display response = "response" title = "Files Indexed" subtitle = "Per Day" > < series:facet name = "test1" type = "column" title = "First Pass" ></ series:facet > < series:facet name = "test2" type = "column" title = "Second Pass" ></ series:facet > < chart:legend title = "Legend Title" align = "center" vertical-align = "bottom" layout = "horizontal" </chart:legend > </ chart:display > </ tk-example > < tk-code-wrapper > < code hljs > < chart:display response = "response" title = "Files Indexed" subtitle = "Per Day" > < series:facet name = "test1" type = "column" title = "First Pass" ></ series:facet > < series:facet name = "test2" type = "column" title = "Second Pass" ></ series:facet > < chart:legend title = "Legend Title" align = "center" vertical-align = "bottom" layout = "vertical" ></ chart:legend > </ chart:display > </ code > </ tk-code-wrapper > < hr /> < h4 id = "example_legend_adding-a-border" > Adding a Border </ h4 > < p > Add an ID or class to the element wrapping your chart and configure the stroke width to add a border and the value rx to modify the border radius. </ p > < pre > .chart-with-legend-border .highcharts-legend-box { fill: none; stroke-width: 1px; stroke: black; rx:2; } </ pre > < div class = "chart-with-legend-border" > < tk-example > < chart:display response = "response" title = "Files Indexed" subtitle = "Per Day" > < series:facet name = "test1" type = "column" title = "First Pass" ></ series:facet > < series:facet name = "test2" type = "column" title = "Second Pass" ></ series:facet > < chart:legend title = "Legend Title" align = "right" vertical-align = "middle" layout = "vertical""></chart:legend> </chart:display> </tk-example> <tk-code-wrapper> <code hljs> <chart:display response=" response " title=" Files Indexed " subtitle=" Per Day "> <series:facet name=" test1 " type=" column " title=" First Pass "></series:facet> <series:facet name=" test2 " type=" column " title=" Second Pass "></series:facet> <chart:legend title=" Legend Title " align=" right " vertical-align=" middle " layout=" vertical "></chart:legend> </chart:display> </code> </tk-code-wrapper> </div> </div>
.chart-with-legend-border .highcharts-legend-box { fill : none ; stroke-width : 1px ; stroke : black ; rx : 2 ; }
angular . module ( 'lightning' ) . controller ( 'ExampleController' , [ '$scope' , '$timeout' , 'ResponseService' , function ( $scope , $timeout , ResponseService ) { $scope . response = { page: 2 , query: { rpp: 50 }, facets: { test1: { filters: [ { val: { dsp: 'Day 1' , act: 'Day 1' , }, count: 100 , }, { val: { dsp: 'Day 2' , act: 'Day 2' , }, count: 200 , } ] }, test2: { filters: [ { val: { dsp: 'Day 1' , act: 'Day 1' , }, count: 10 , }, { val: { dsp: 'Day 2' , act: 'Day 2' , }, count: 20 , } ] }, }, results: [ { result: { fields: { label: 'label1' , value: 1 } }, }, { result: { fields: { label: 'label2' , value: 2 } }, hits: { act: [ 'Hits' , 264 ] } }] } ResponseService . setResponse ( 'response' , $scope . response ); }]);
Result