Performance metrics vary from deployment to deployment. This article doesn’t try to differentiate between acceptable and unacceptable performance.
Grafana for Lucidworks Search
The course for Grafana for Lucidworks Search focuses on the best practices for utilizing the Grafana dashboard.
Rows
The Customer Dashboard includes three rows: Overview, Queries, and Indexing. Each row has panels that visualize your data. Hovering over the panels provides extra information and options.Overview
Fusion Gateway RPS
The Fusion Gateway RPS panel displays the number of query requests per second for your cluster’s query operations and global operations. Query operations are largely associated with searches. Global operations include query operations, as well as all other requests to the Fusion Gateway service. In this example, query operations make up most of the global operations requests.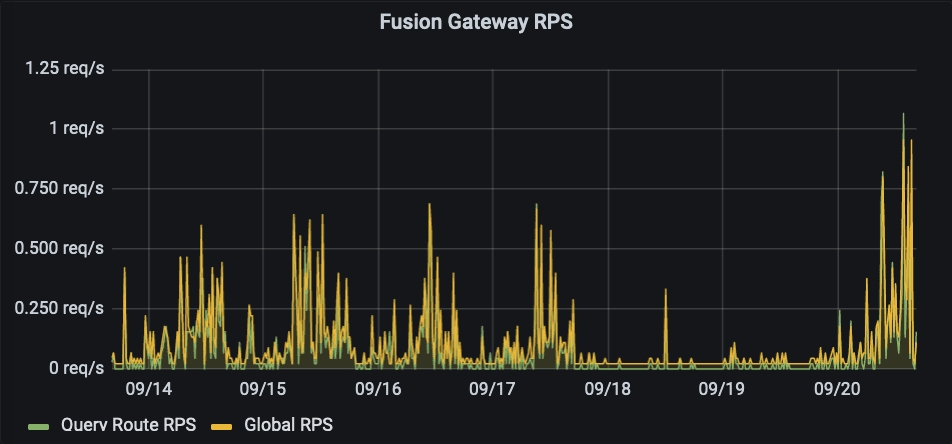
Gateway Errors Per Second
The Gateway Errors Per Second panel displays how many errors per second the Fusion Gateway service experiences. This example shows the cluster experienced no gateway errors during the 7-day timeframe.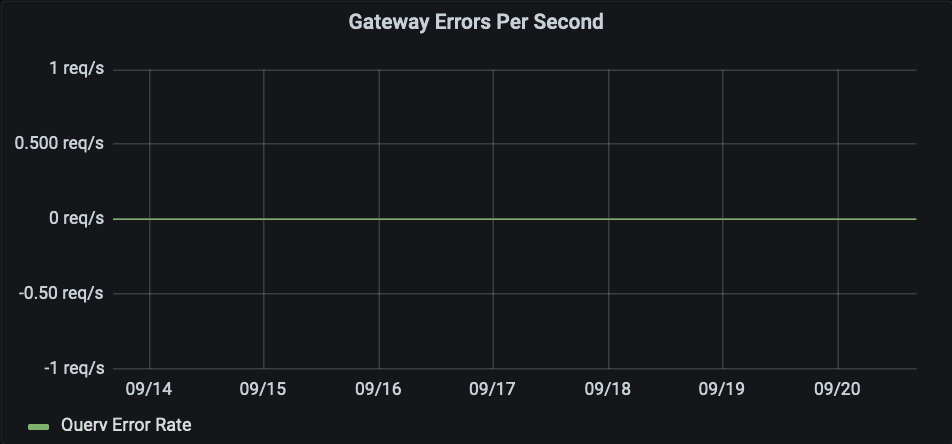
Query RPS
The Query RPS panel shows how many query operations per second are sent to your cluster. This panel isolates the query operations from the combined query and global operations in the Fusion Gateway RPS. In this example, the cluster received fewer query pipeline requests per second over the weekend as compared to the rest of the week.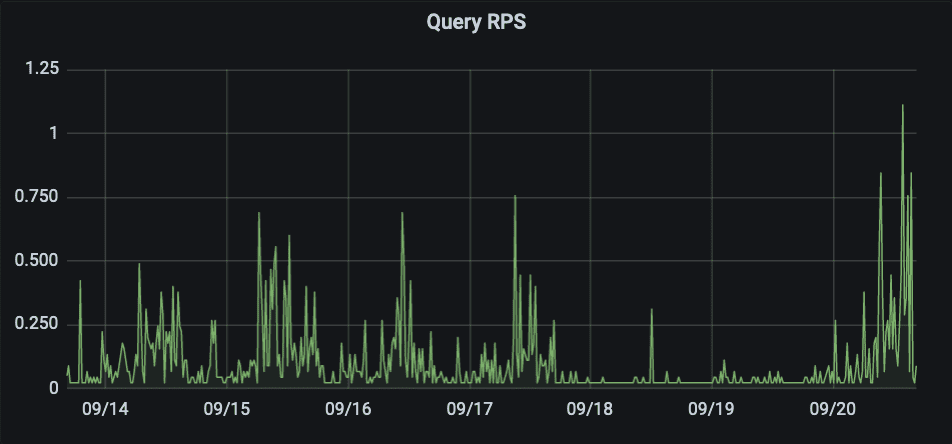
Indexing RPS
The Indexing RPS panel shows how many indexing operations per second are sent to your cluster. This example shows that Lucidworks Search indexes the datasource daily. On 9/17, the indexing job stopped early, possibly due to a cancellation or error.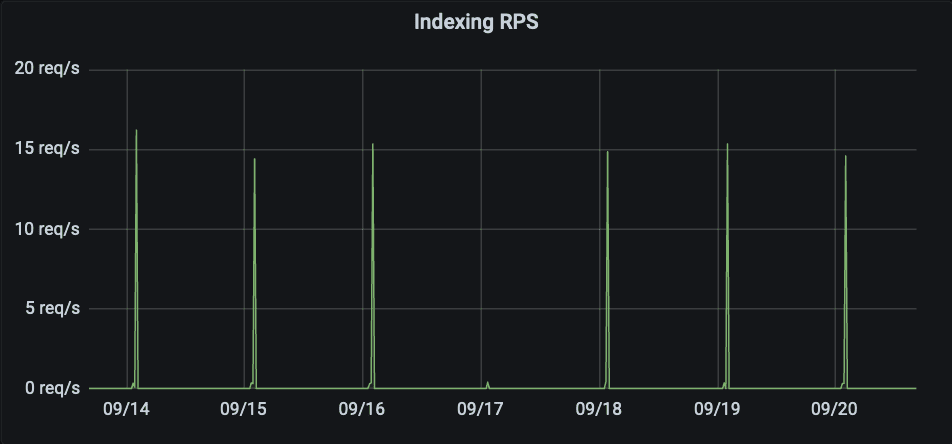
Queries
Query Pipeline RPS (with outcomes)
The Query Pipeline RPS (with outcomes) panel displays how many query requests per second were made and what the result was. This includes successful queries and client and server errors. In this example, all queries during the timeframe were successful.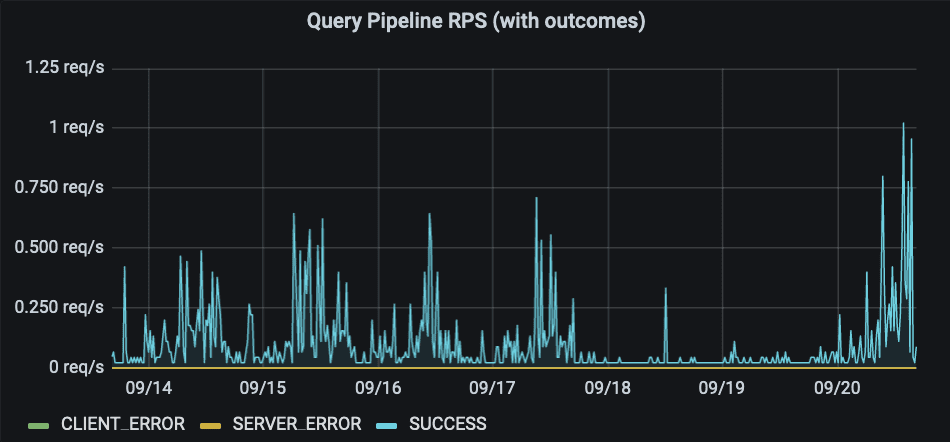
Query Pipeline RPS By Pipeline
The Query Pipeline RPS By Pipeline panel displays how many query requests per second were made per Lucidworks Search query pipeline. In the example panel, most query request were made to the Docs_Site_2 query pipeline.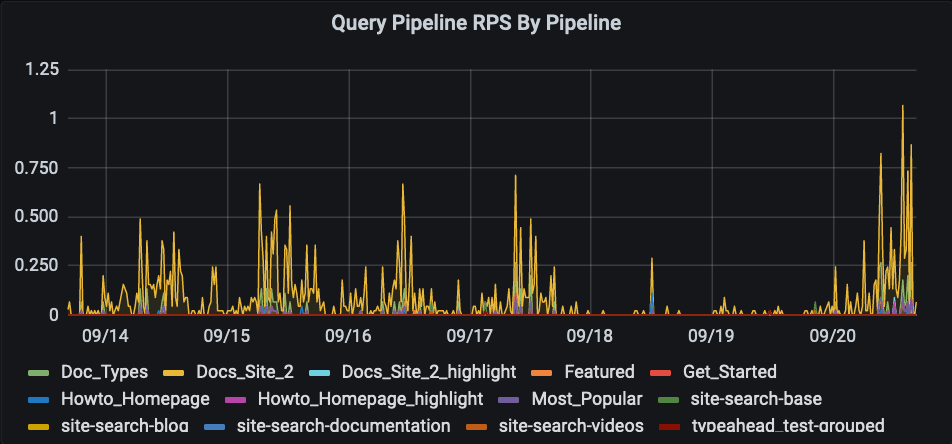
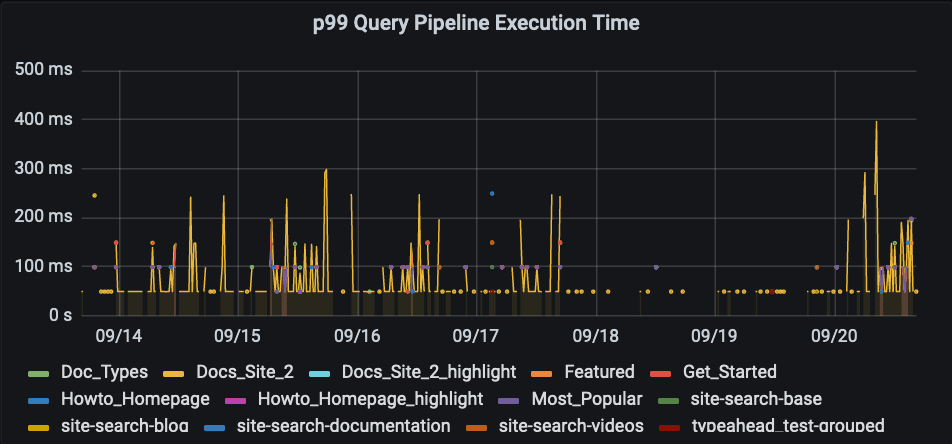
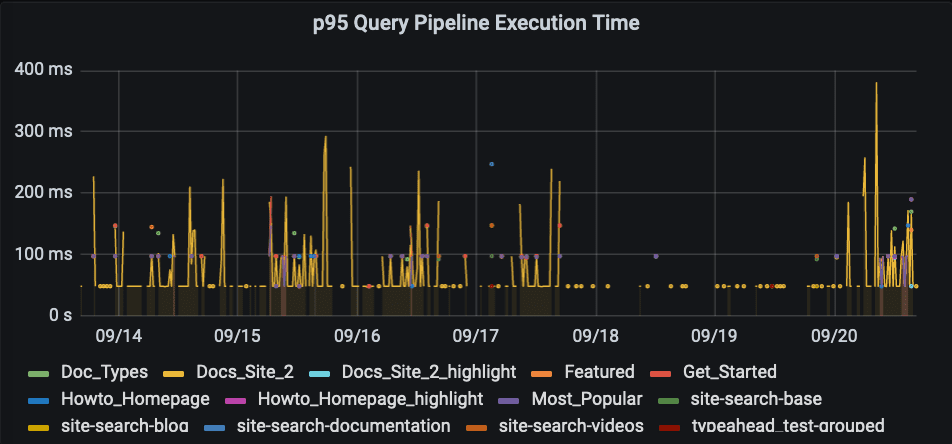
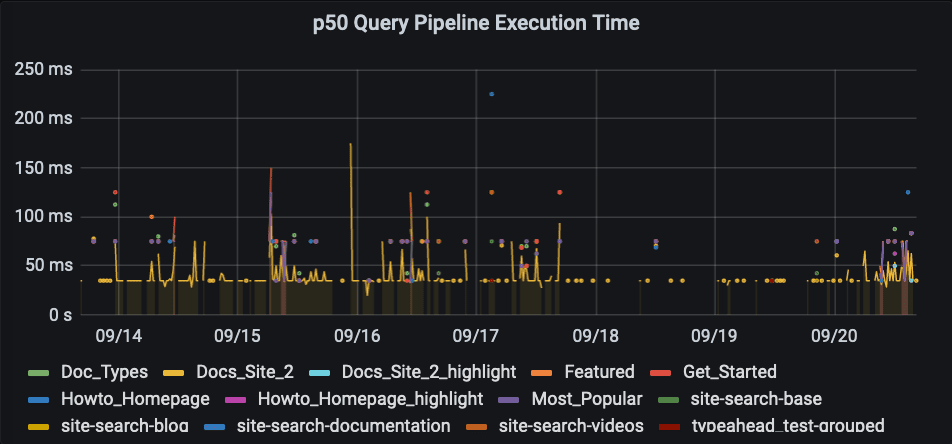
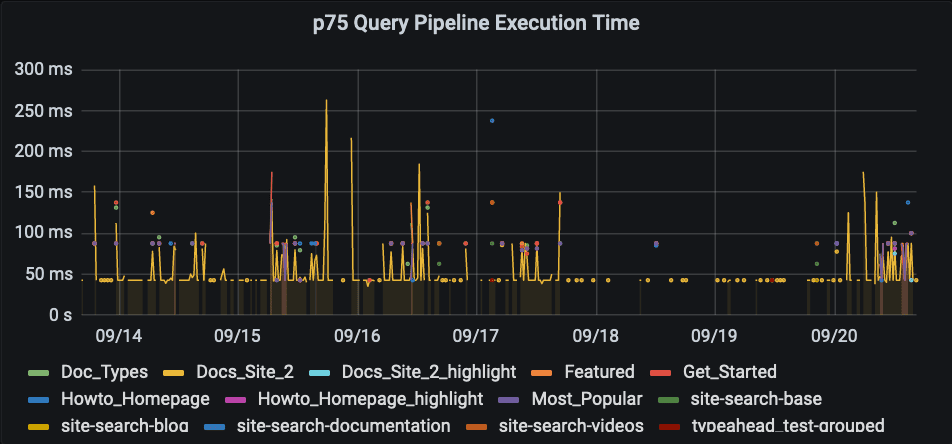
Query Pipeline Execution Time
The Query Pipeline Execution Time panels display how long it took for the query pipeline to execute requests. There are several panels, with each panel representing a different percentile group for the data. For example the p99 Query Pipeline Execution Time panel represents the 99th percentile group.p99 Query Pipeline Execution Time
p95 Query Pipeline Execution Time
p50 Query Pipeline Execution Time
p75 Query Pipeline Execution Time
Indexing
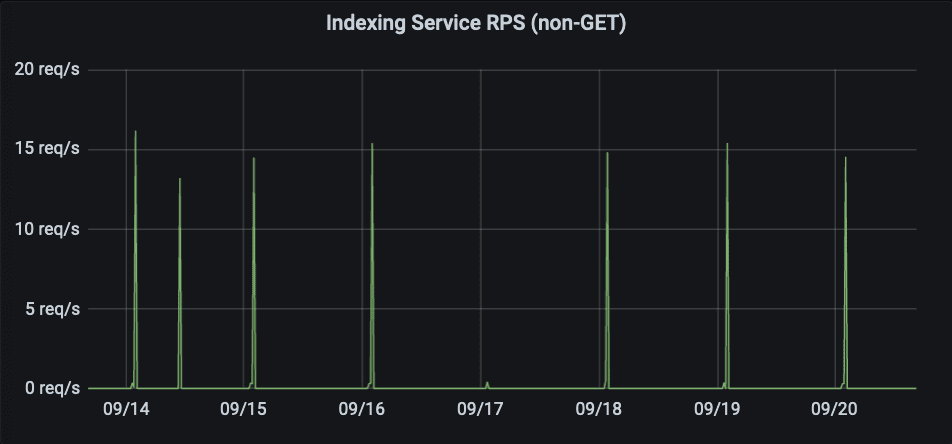
Indexing Service RPS (non-GET)
The Indexing Service RPS (non-GET) panel displays how many indexing operations, excludingGET operations, took place during the timeframe. In the example panel, a datasource indexing job is scheduled to perform indexing operations on a daily basis. On 9/17, the indexing job stopped early, due to a cancellation or error.
Document Index Rate
The Document Index Rate panel displays how many write operations per second were completed during the timeframe. In this example, the write operations align with the Indexing Service RPS (non-GET) data. On 9/17, the datasource indexing job failed or was canceled.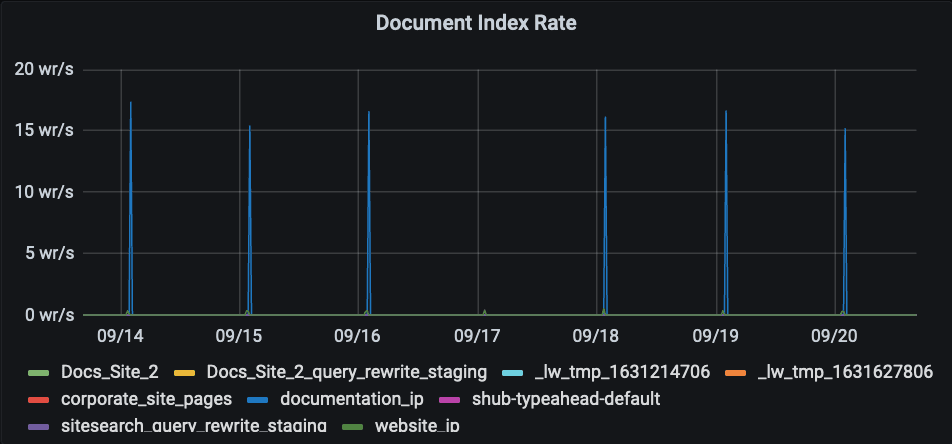
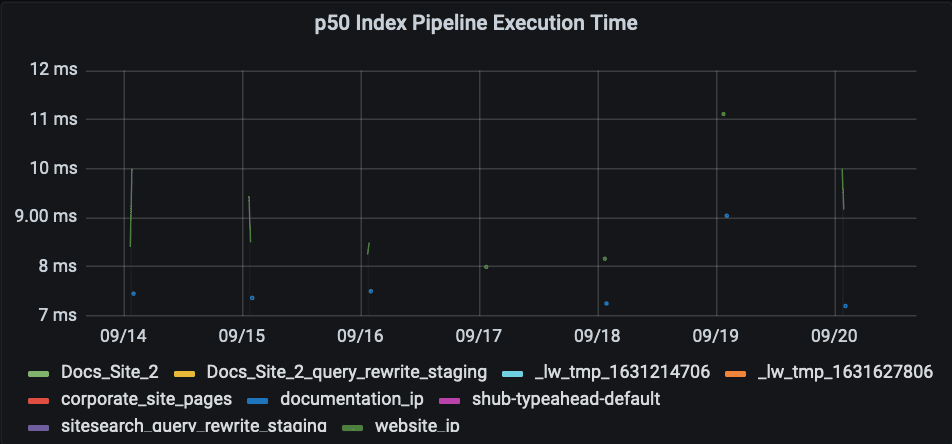
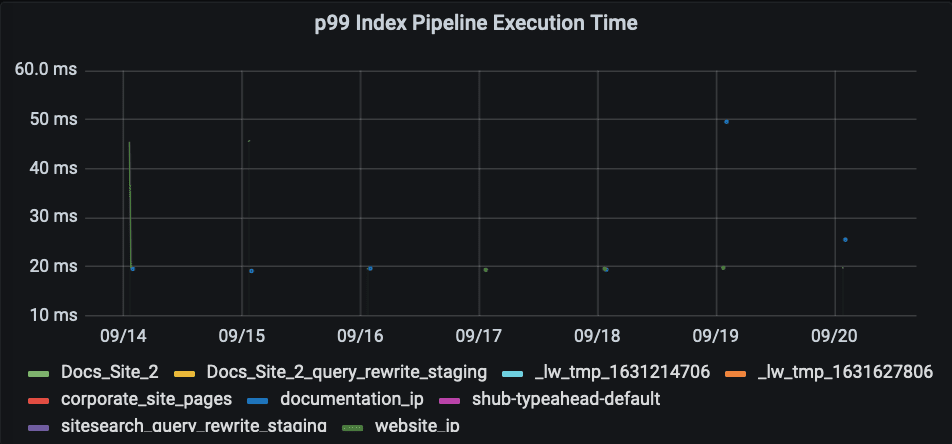
Index Pipeline Execution Time
The Index Pipeline Execution Time panels display how long it took for the index pipeline to execute requests. There are several panels, with each panel representing a different percentile group for the data. For example the p99 Index Pipeline Execution Time panel represents the 99th percentile group.p99 Index Pipeline Execution Time
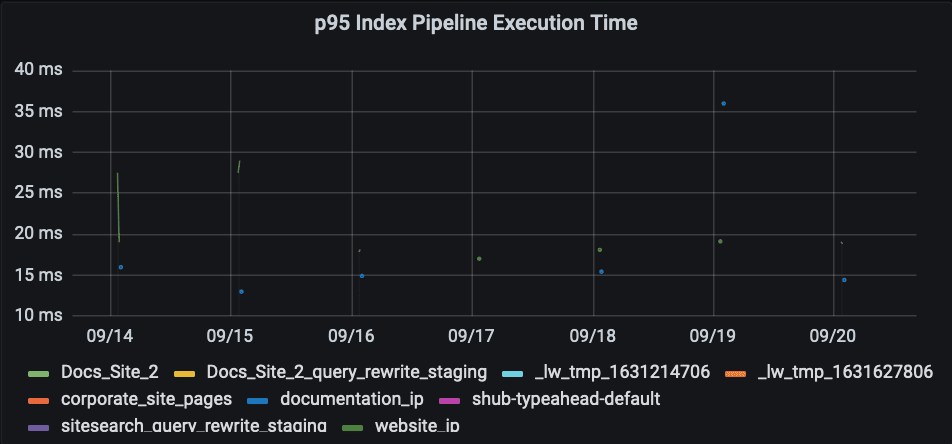
p95 Index Pipeline Execution Time
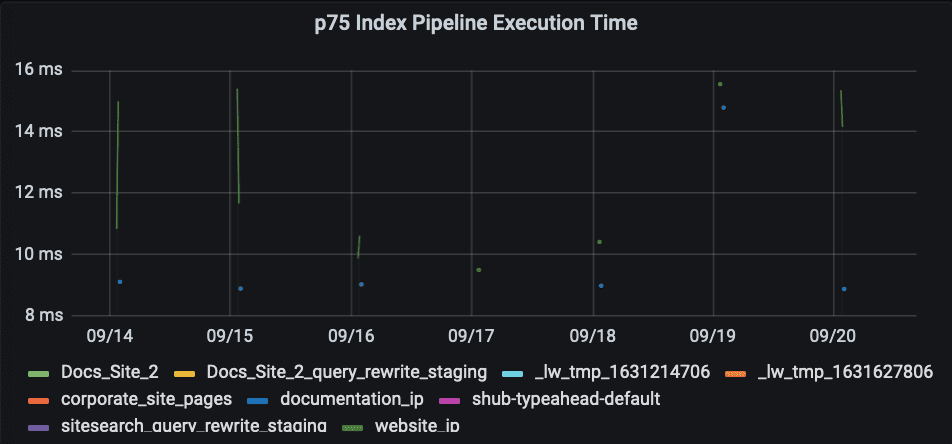
p75 Index Pipeline Execution Time
p50 Index Pipeline Execution Time