Fusion Log ViewerGrafana dashboard
The Fusion Log Viewer dashboard shows details on logging events from your Managed Fusion environment.
Filter tools
Use the top level controls to apply labels, search, and filter the data by time range in each panel.
Labels are similar to facets or filters. Adding a label defines the stream of logs. Adding or removing a label affects the label options available to other parameters.
Use the Search control to find log data that matches the query keyword. Search is case insensitive. The query error matches error, Error, ERROR, and other variants of the keyword.
Set the time range controls to focus your data stream on a specific time range. For example, you can view data from the last 15 minutes or you can view a 12-hour time range from last week. For more information, see Set dashboard time range.
For more information about the components used in the Fusion Log Viewer dashboard, see the Grafana documentation on Dashboards and Panels and visualizations.
Panels
Each panel in the Fusion Log Viewer dashboard is designed to help you understand your deployment’s overall health and performance at a glance.
|
You can click and drag on some panels to set the time range. For example, if you see an unusual spike in data on the Log Rate panel, you can click and drag to select the spike and focus the data stream on the time range it occurred in. This operation updates the other panels to use the specified time range, including the Log Viewer panel. |
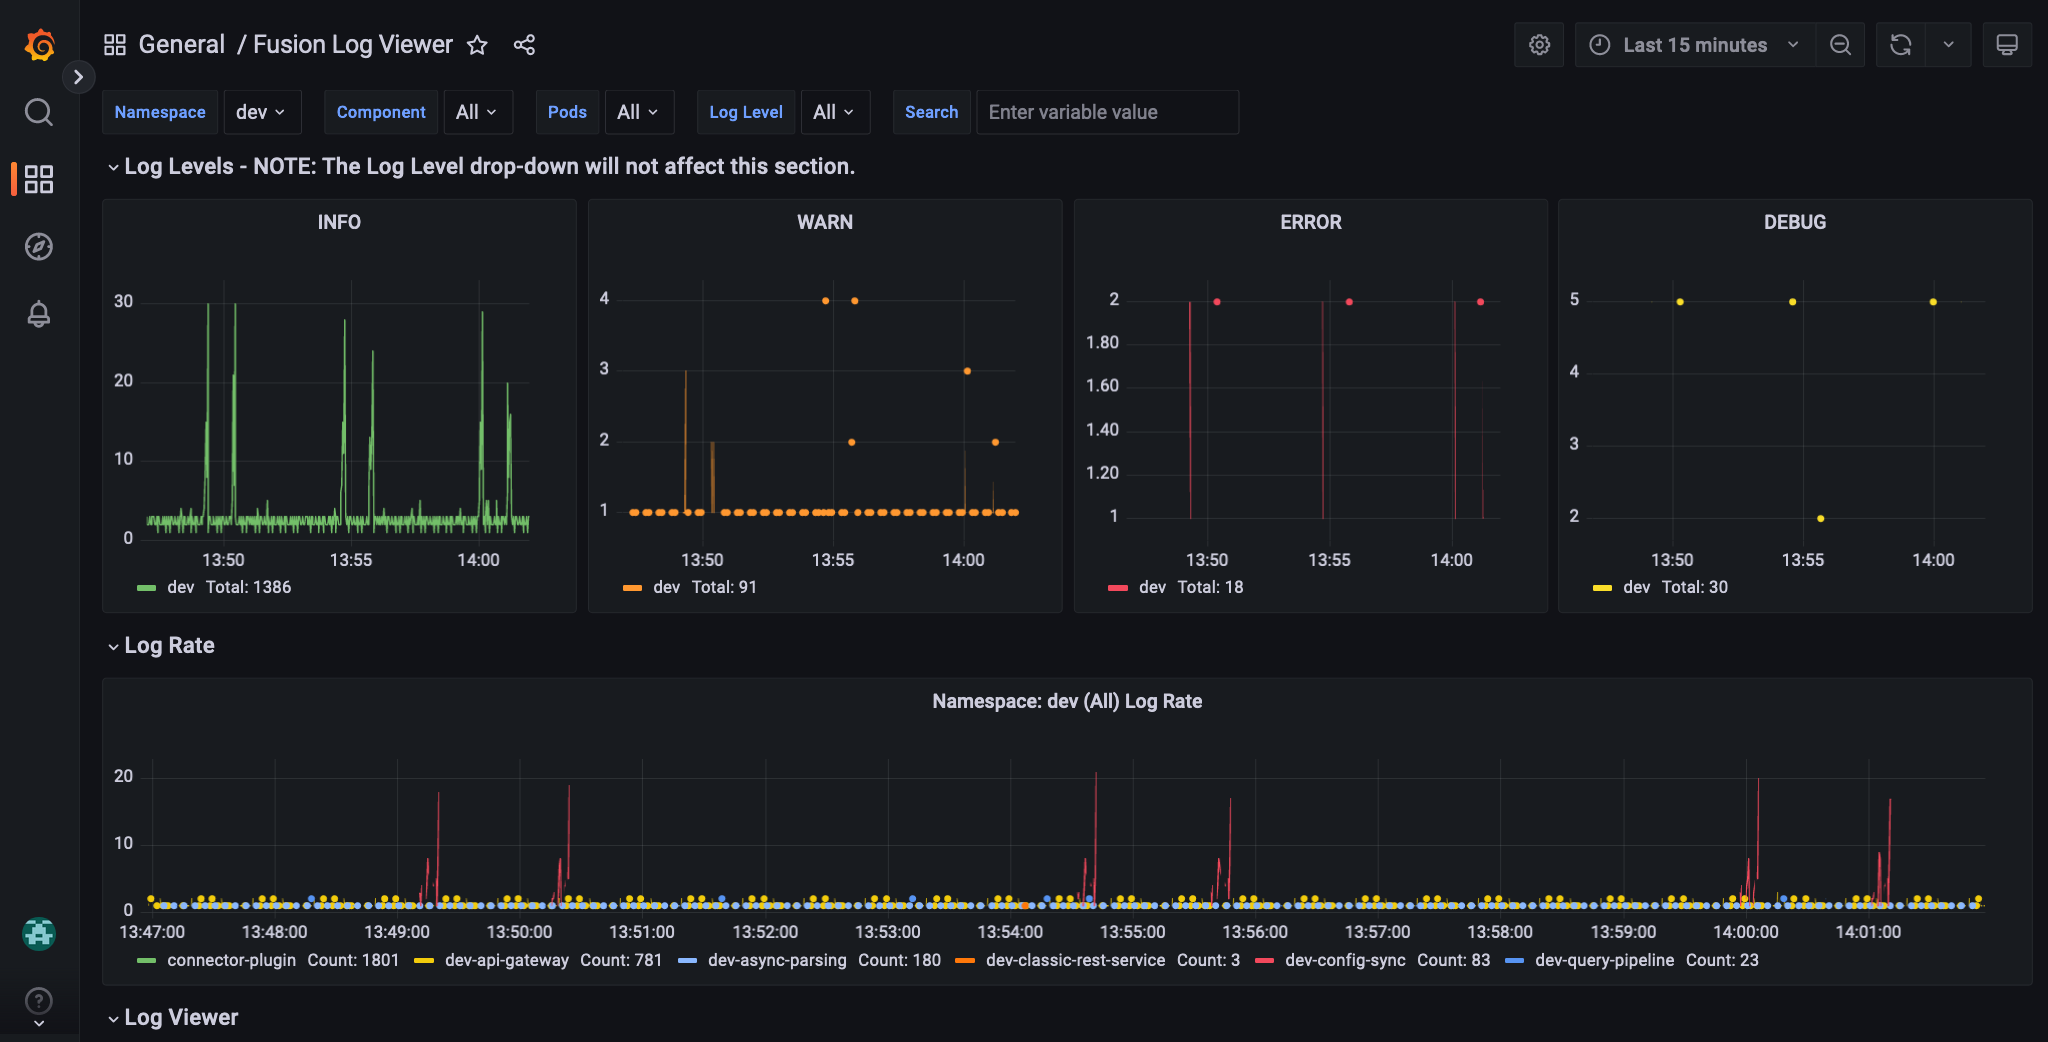
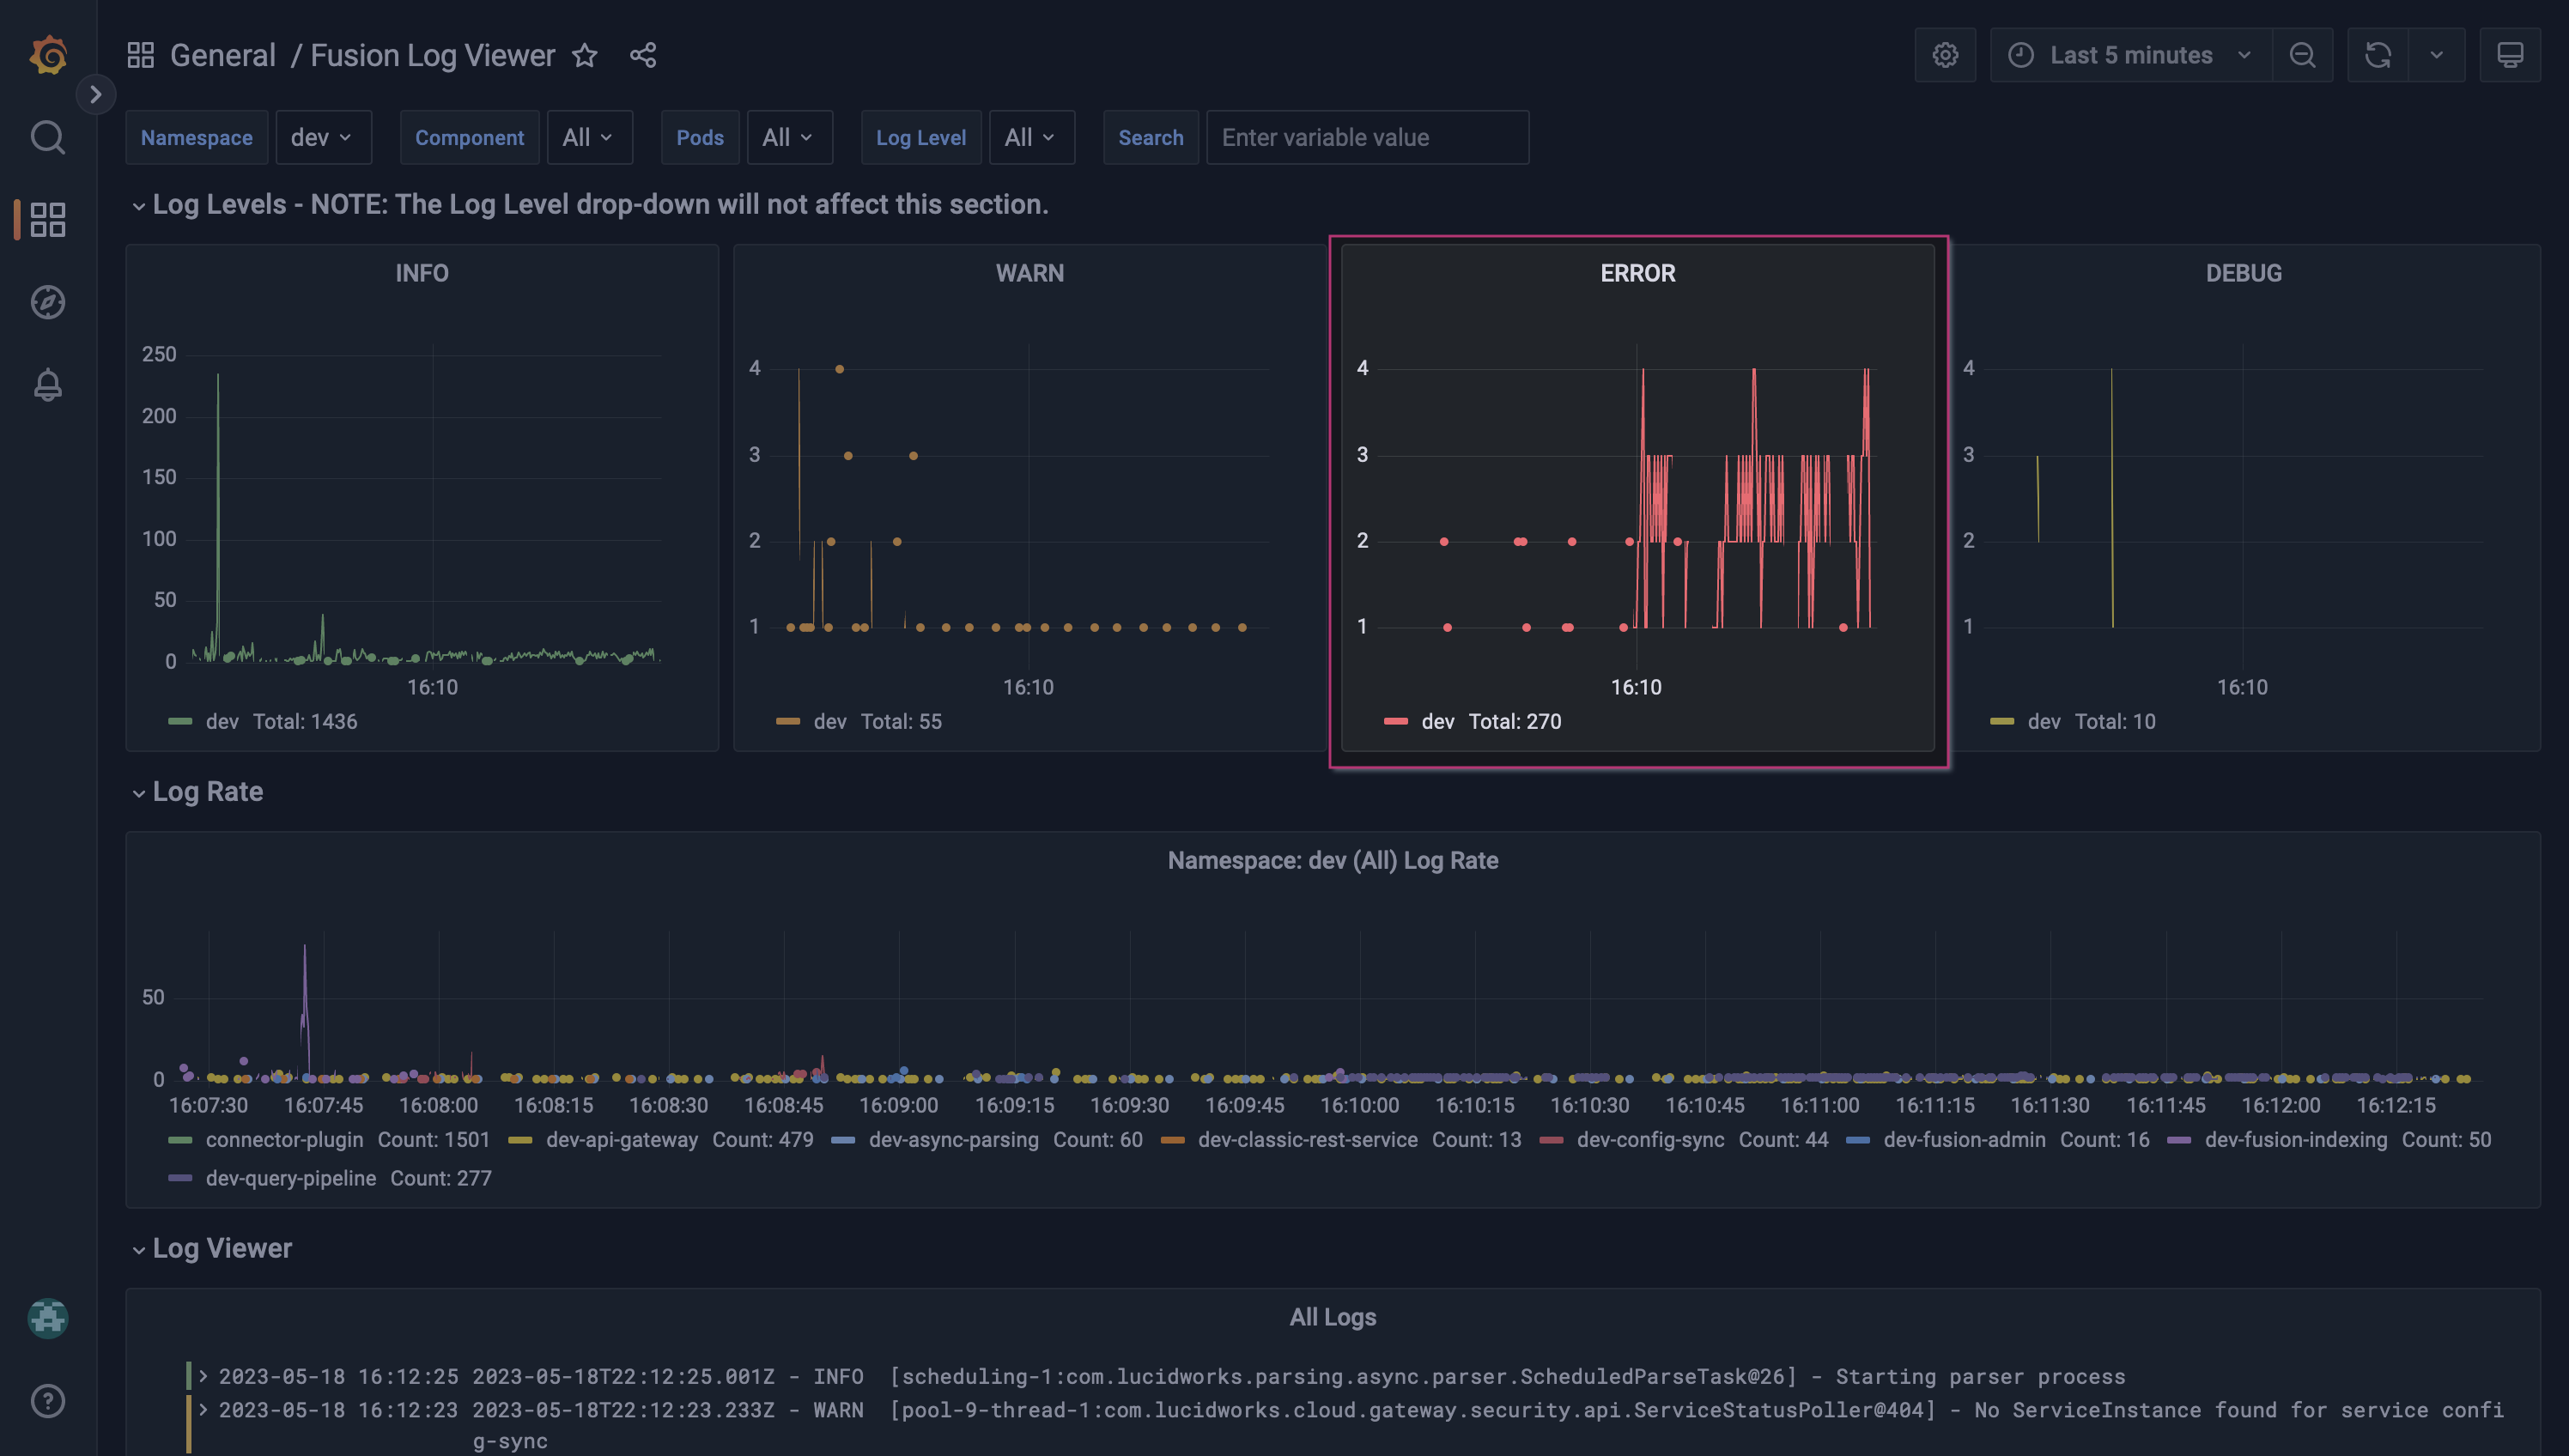
Log Levels
The panels in the Log Levels section show the following levels of logs:
-
INFO. Contains coarse-grained informational messages that describe application processes at a high level. These messages are typically used to track the application’s overall health and performance.
-
WARN. Designates potentially harmful situations. These messages may indicate the application is at risk of failing or not operating as expected.
-
ERROR. Designates error events that may allow the application to continue running. These messages should be investigated to resolve the error and to prevent it from occurring again.
-
DEBUG. Contain fine-grained diagnostic information that may help debug an application. These messages are typically used by developers to track the flow of execution through the application and to identify potential problems.
Log Rate
The log rate panel displays the number of logs created by the selected components during the specified time range. This panel can help you identify the most active components and when a component creates an unusually high number of logs, which may indicate an error.
Log Viewer
The log viewer panel displays the log stream, filtered according to your label configurations. Click a log entry to view more information.
Services and Pods
The services and pod panel shows the distribution of logs by individual services and pods. If your log stream is focused on ERROR logs, a high distribution may indicate the problem is with a specific service or pod.
Example workflows
These examples illustrate how to investigate errors for the index and query services.
Index service
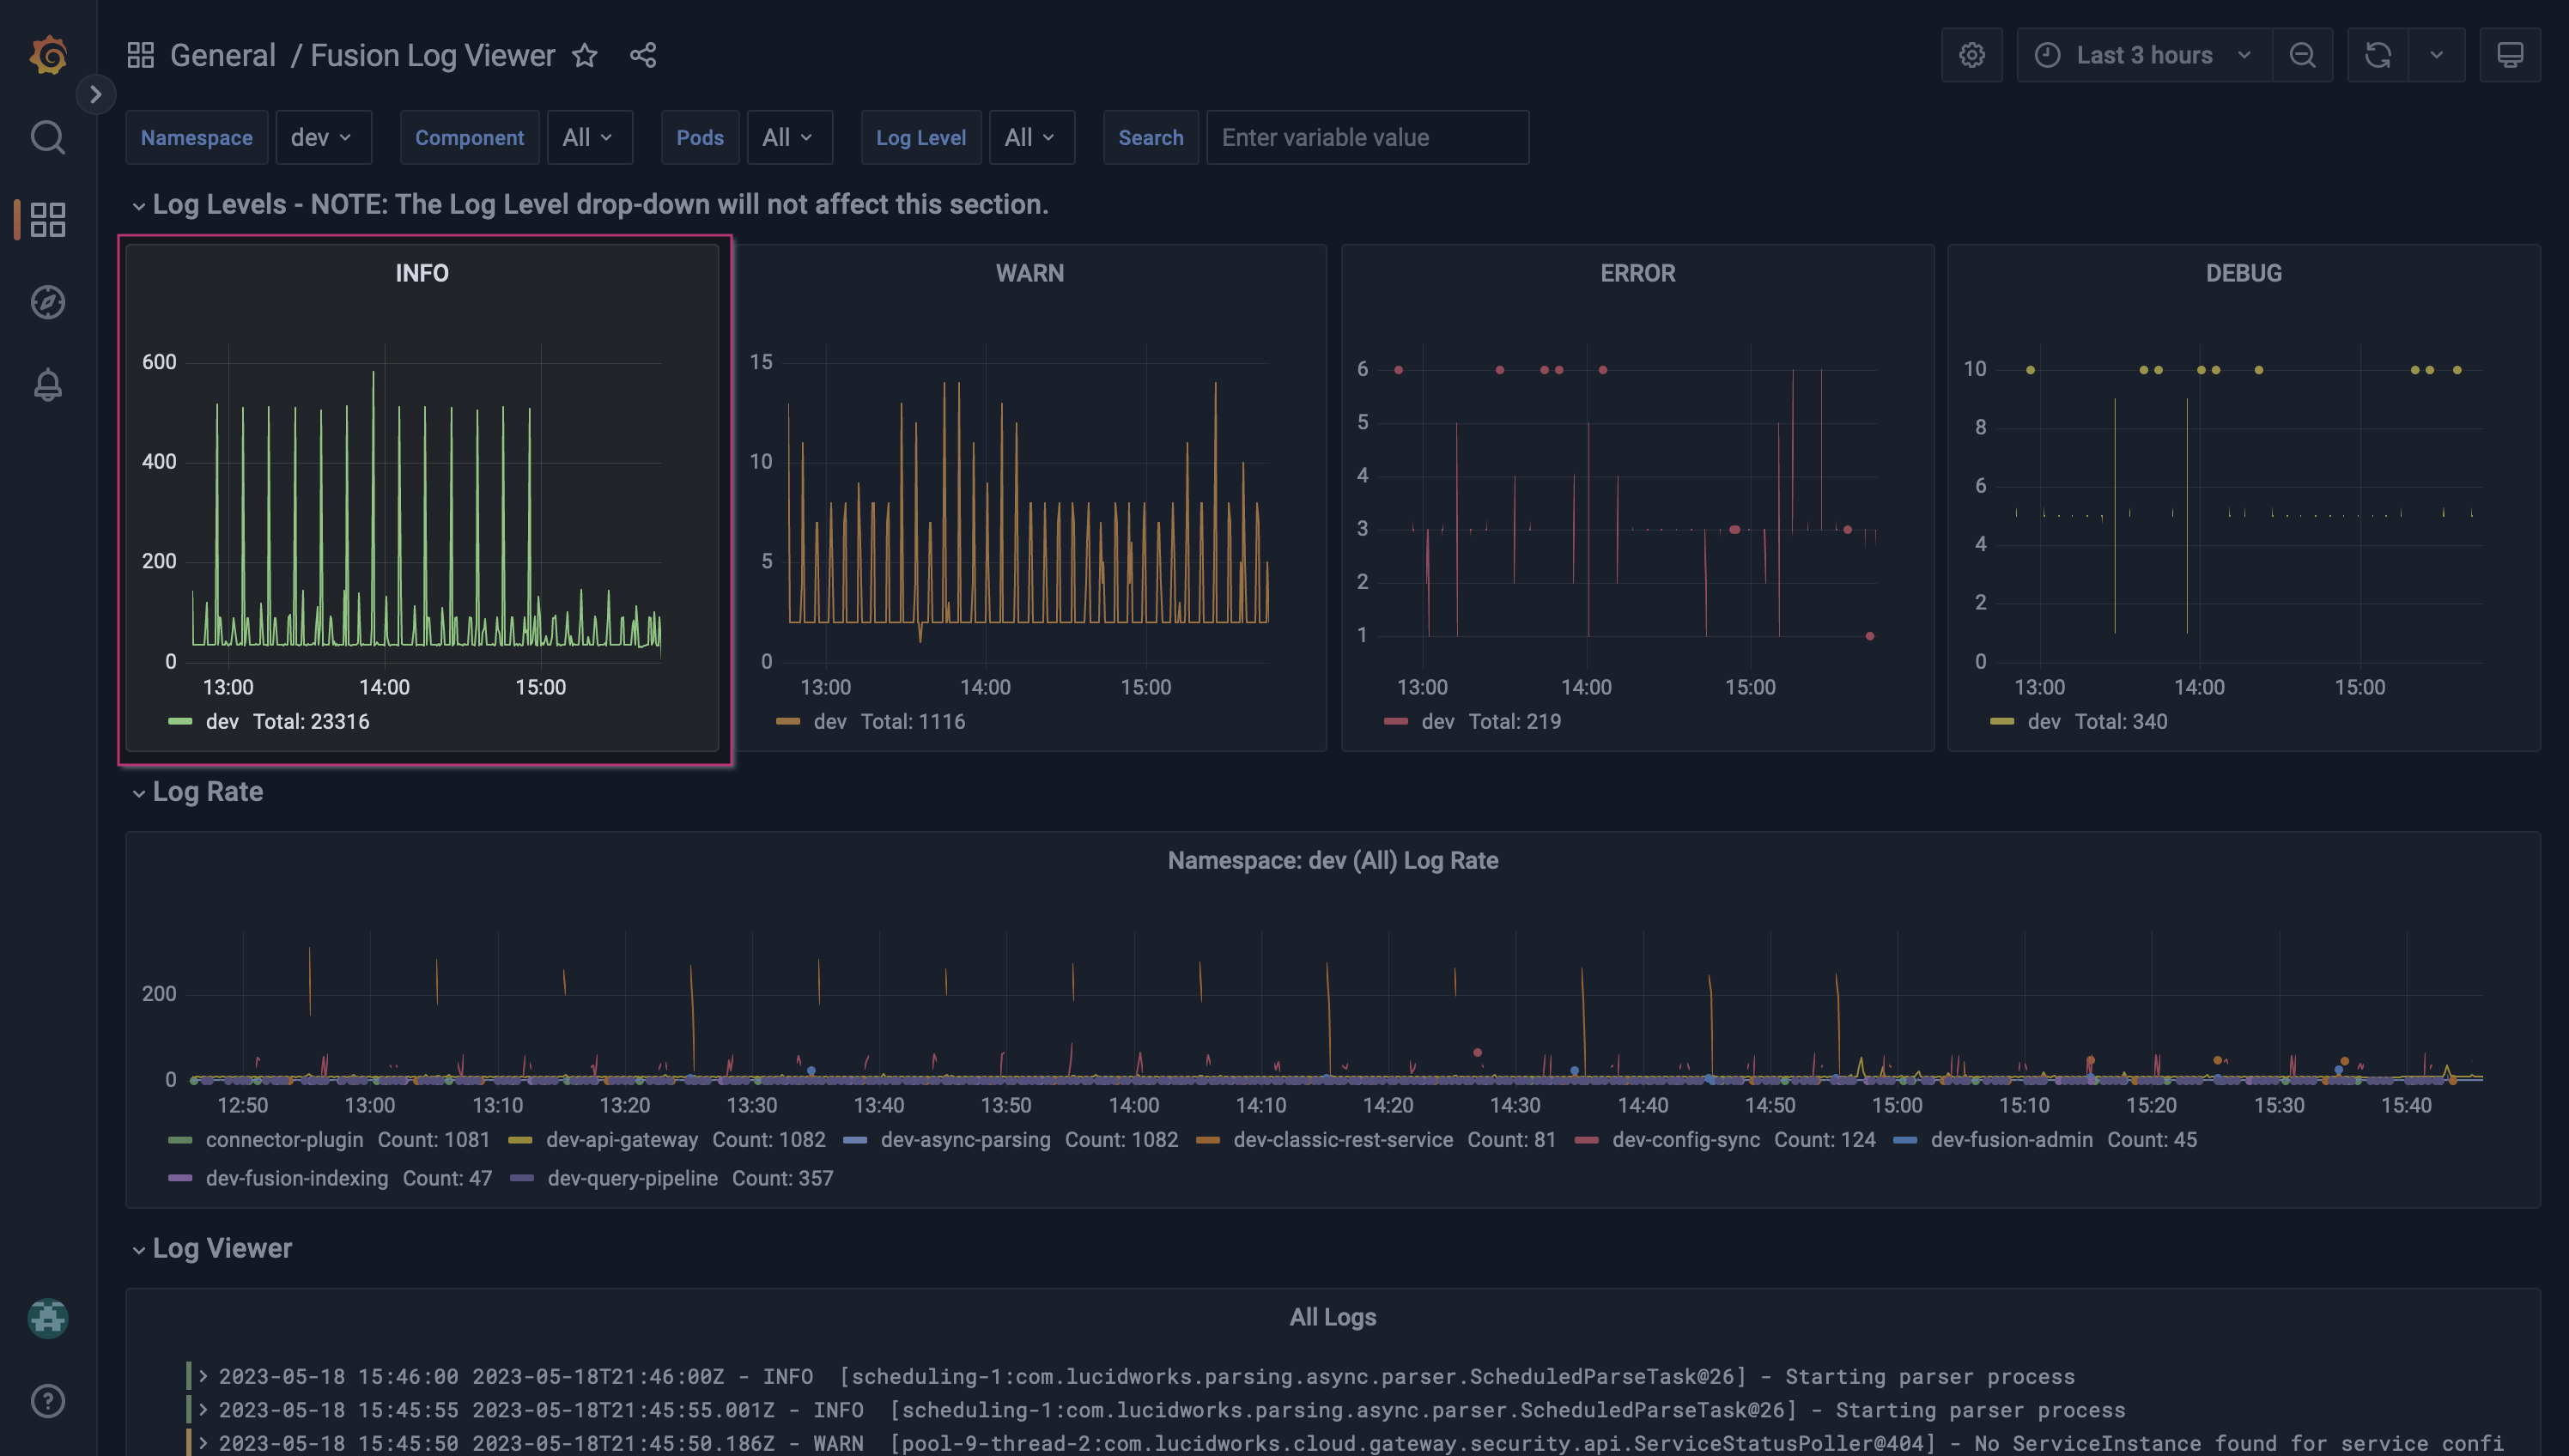
You have an indexing job that is scheduled to run on a frequent, regular basis. The Log Levels panels show a sudden change in INFO log reporting. Although changes to log frequency are expected, the sudden decline is new and should be investigated.
Set the time range
Focus your data stream on the time range from which the log entries started using the time range controls. You can do this using the time range control menu or by clicking and dragging to select the area on the chart.
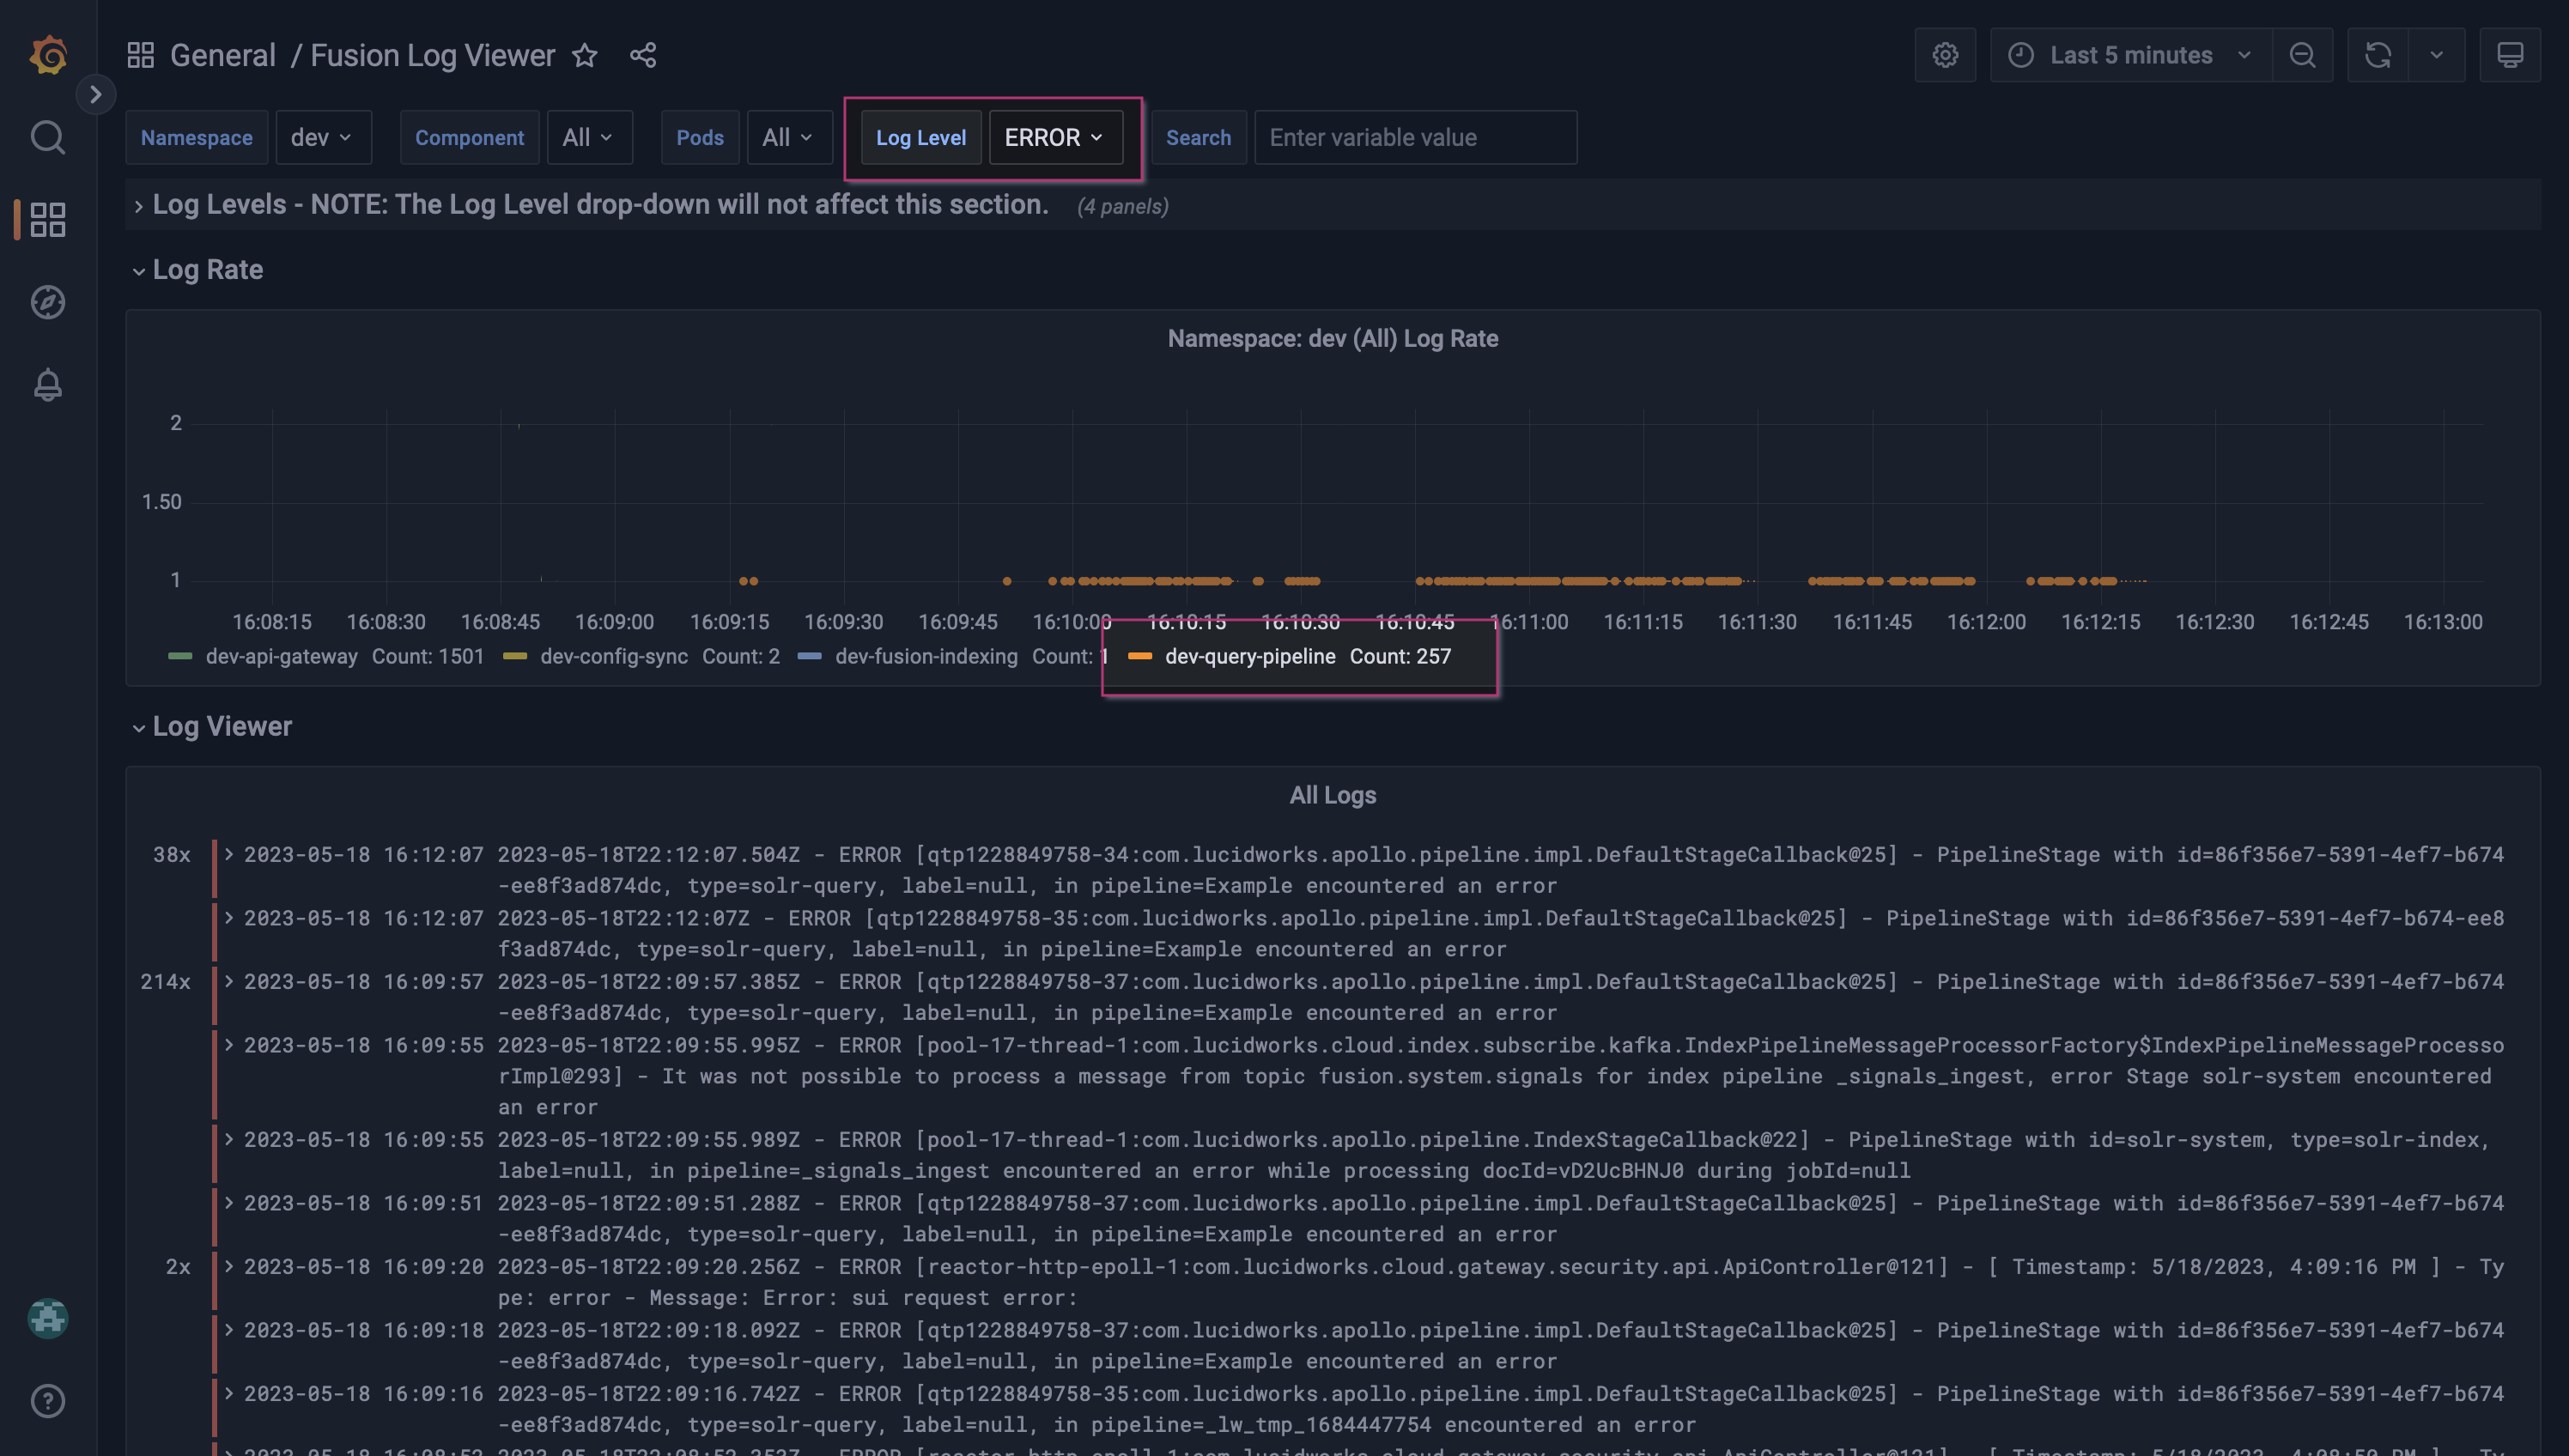
Apply a Log Level label
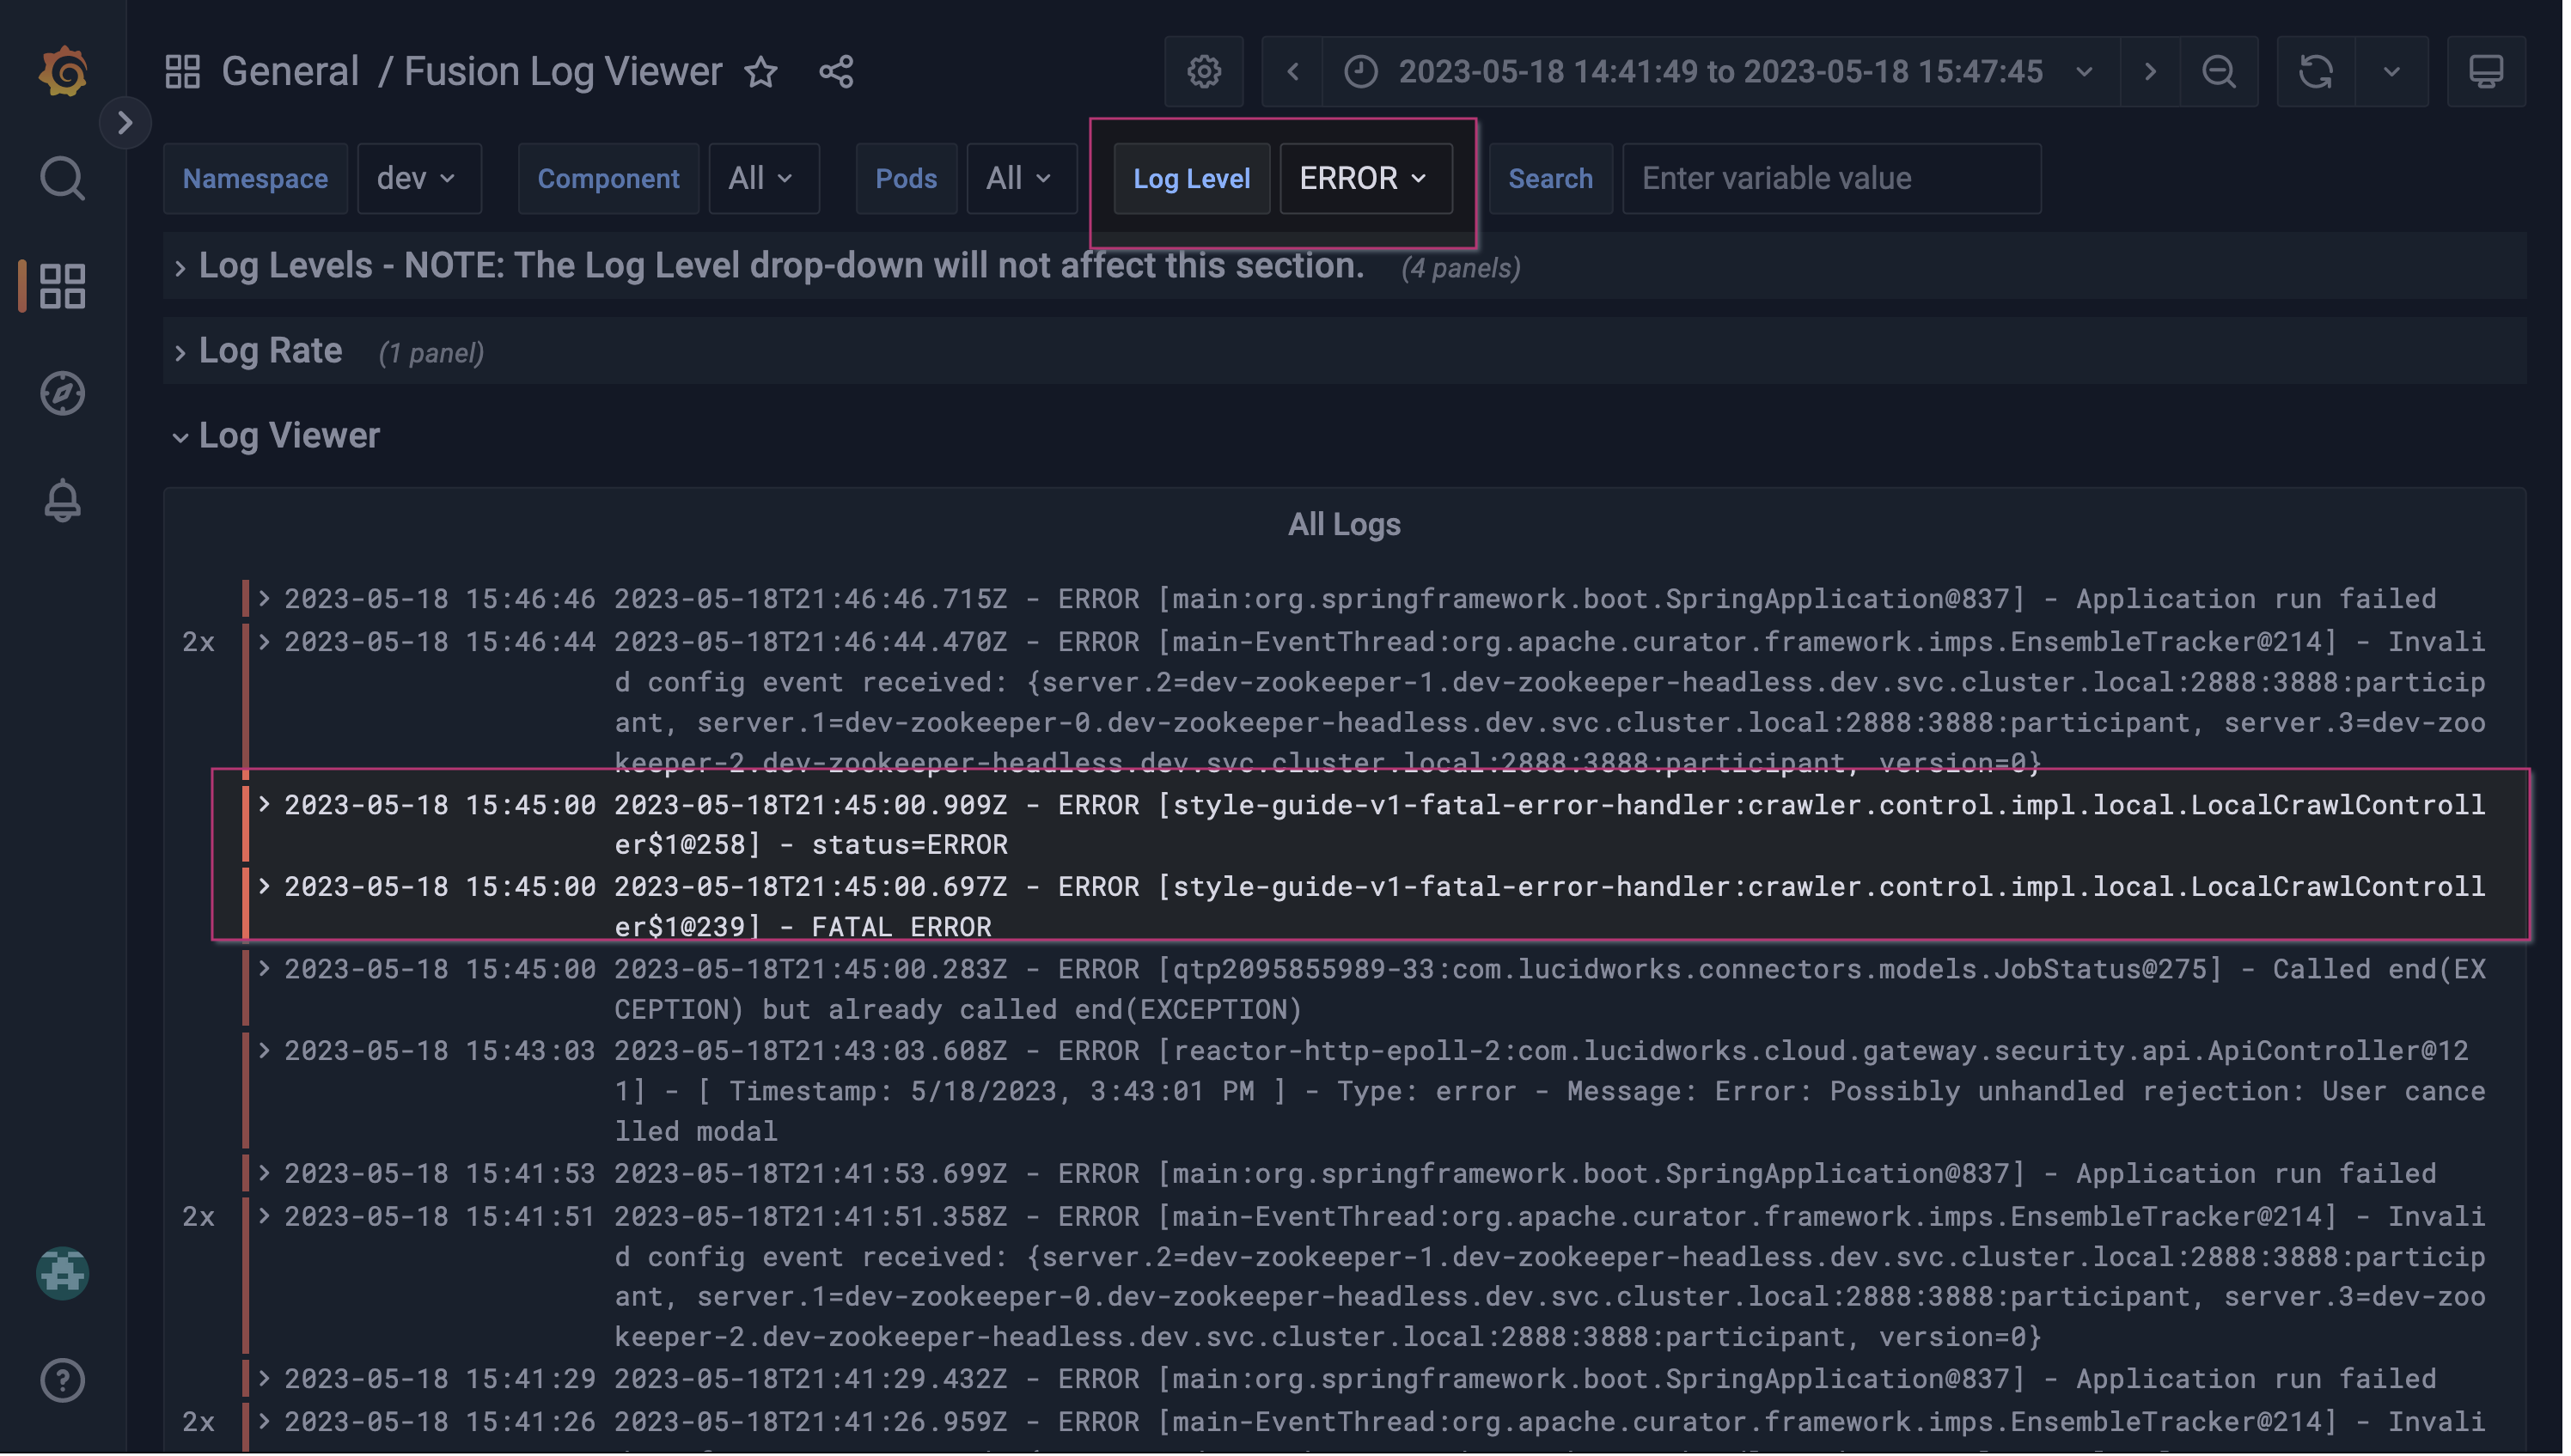
Although INFO logs decreased suddenly, you are investigating whether errors are occurring, so you should start with the ERROR logs. Apply the Log Level label ERROR to focus your data stream on ERROR logs.
The errors frequently involve the string style-guide-v1, which corresponds to a datasource named style-guide-v1.
| The Log Levels section will not update from changes to the Log Level label. |
Identify the component
Hover over the spikes in the Log Rate panel to see the responsible component. In this example, the Managed Fusion classic REST service is responsible for most of the logs.
Apply another Log Level label
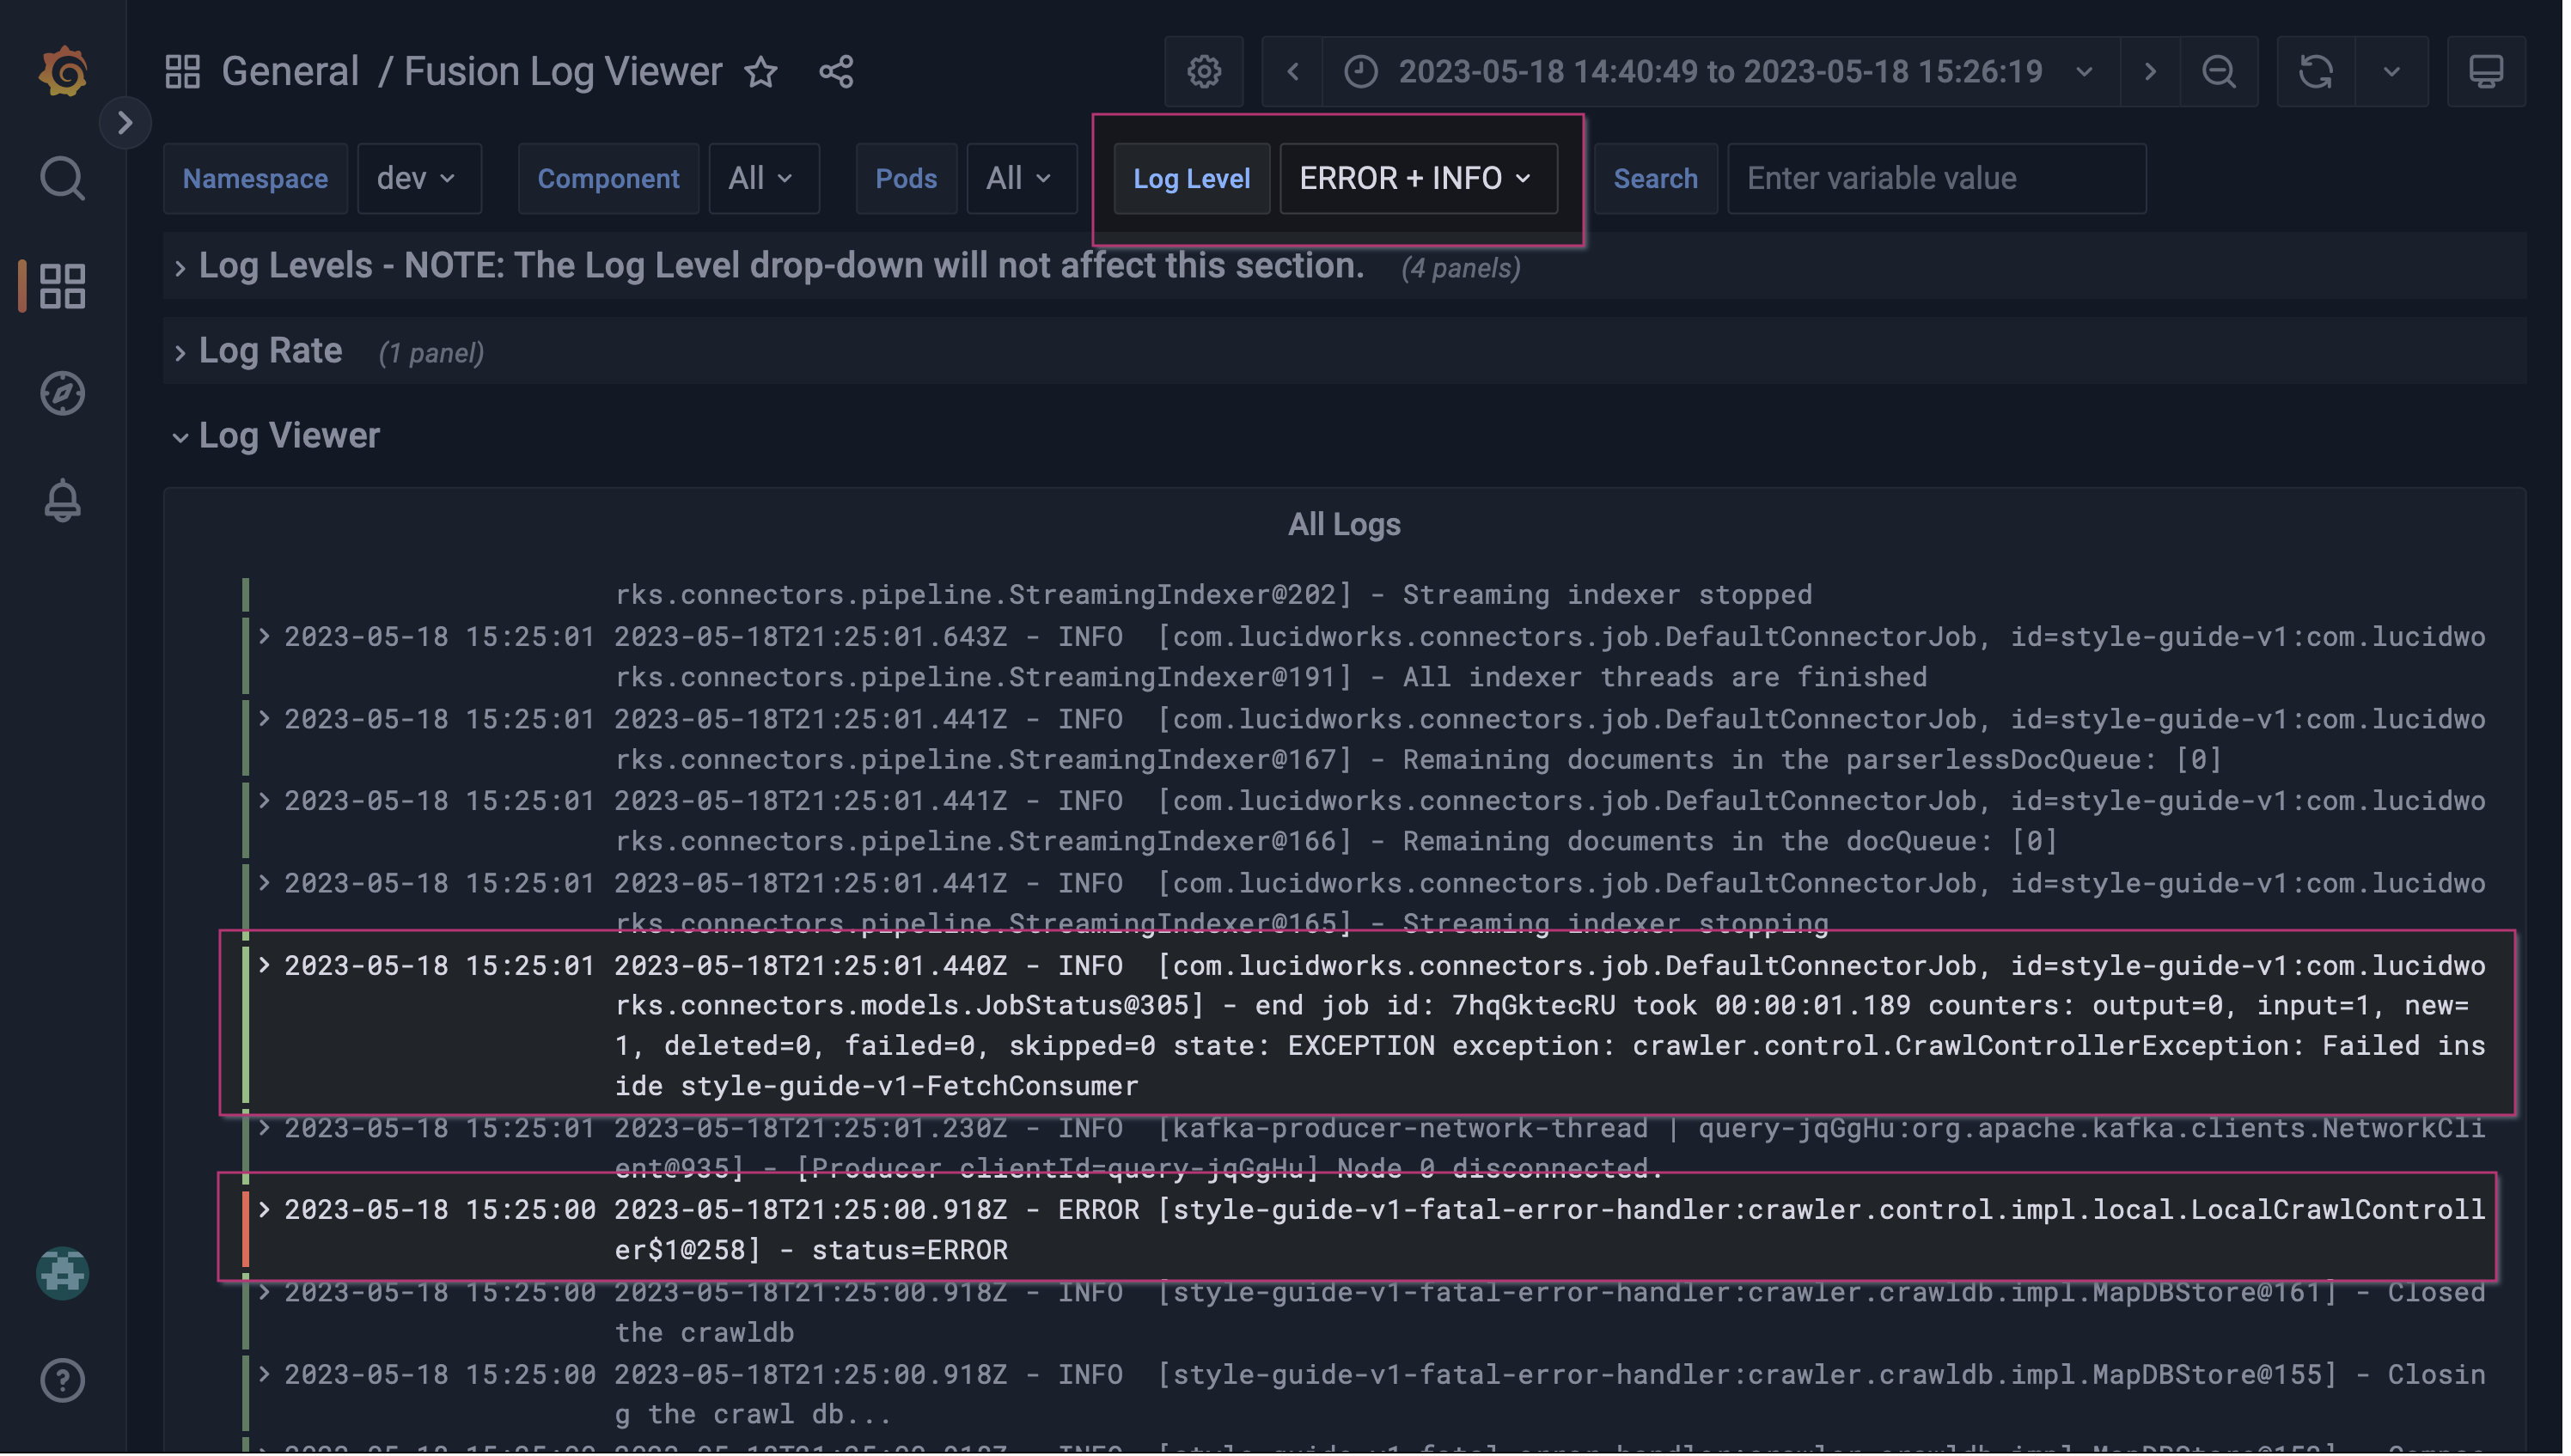
Sometimes, important details are shared in INFO or DEBUG logs. Apply the Log Level label INFO to focus your data stream on INFO and ERROR logs.
A neighboring INFO log has additional details relevant to the ERROR log. After visiting the datasource, you note an accidental change to the datasource was made. After correcting the mistake, the indexing log activity resumes as expected.
Query service
In a similar scenario, you notice a sharp increase in errors in the Log Rate panel that appear to coincide with recent changes to your query pipelines.
Apply a Log Level label
Apply the Log Level label ERROR to focus your data stream on ERROR logs. As expected, most of the error messages are for the query service.
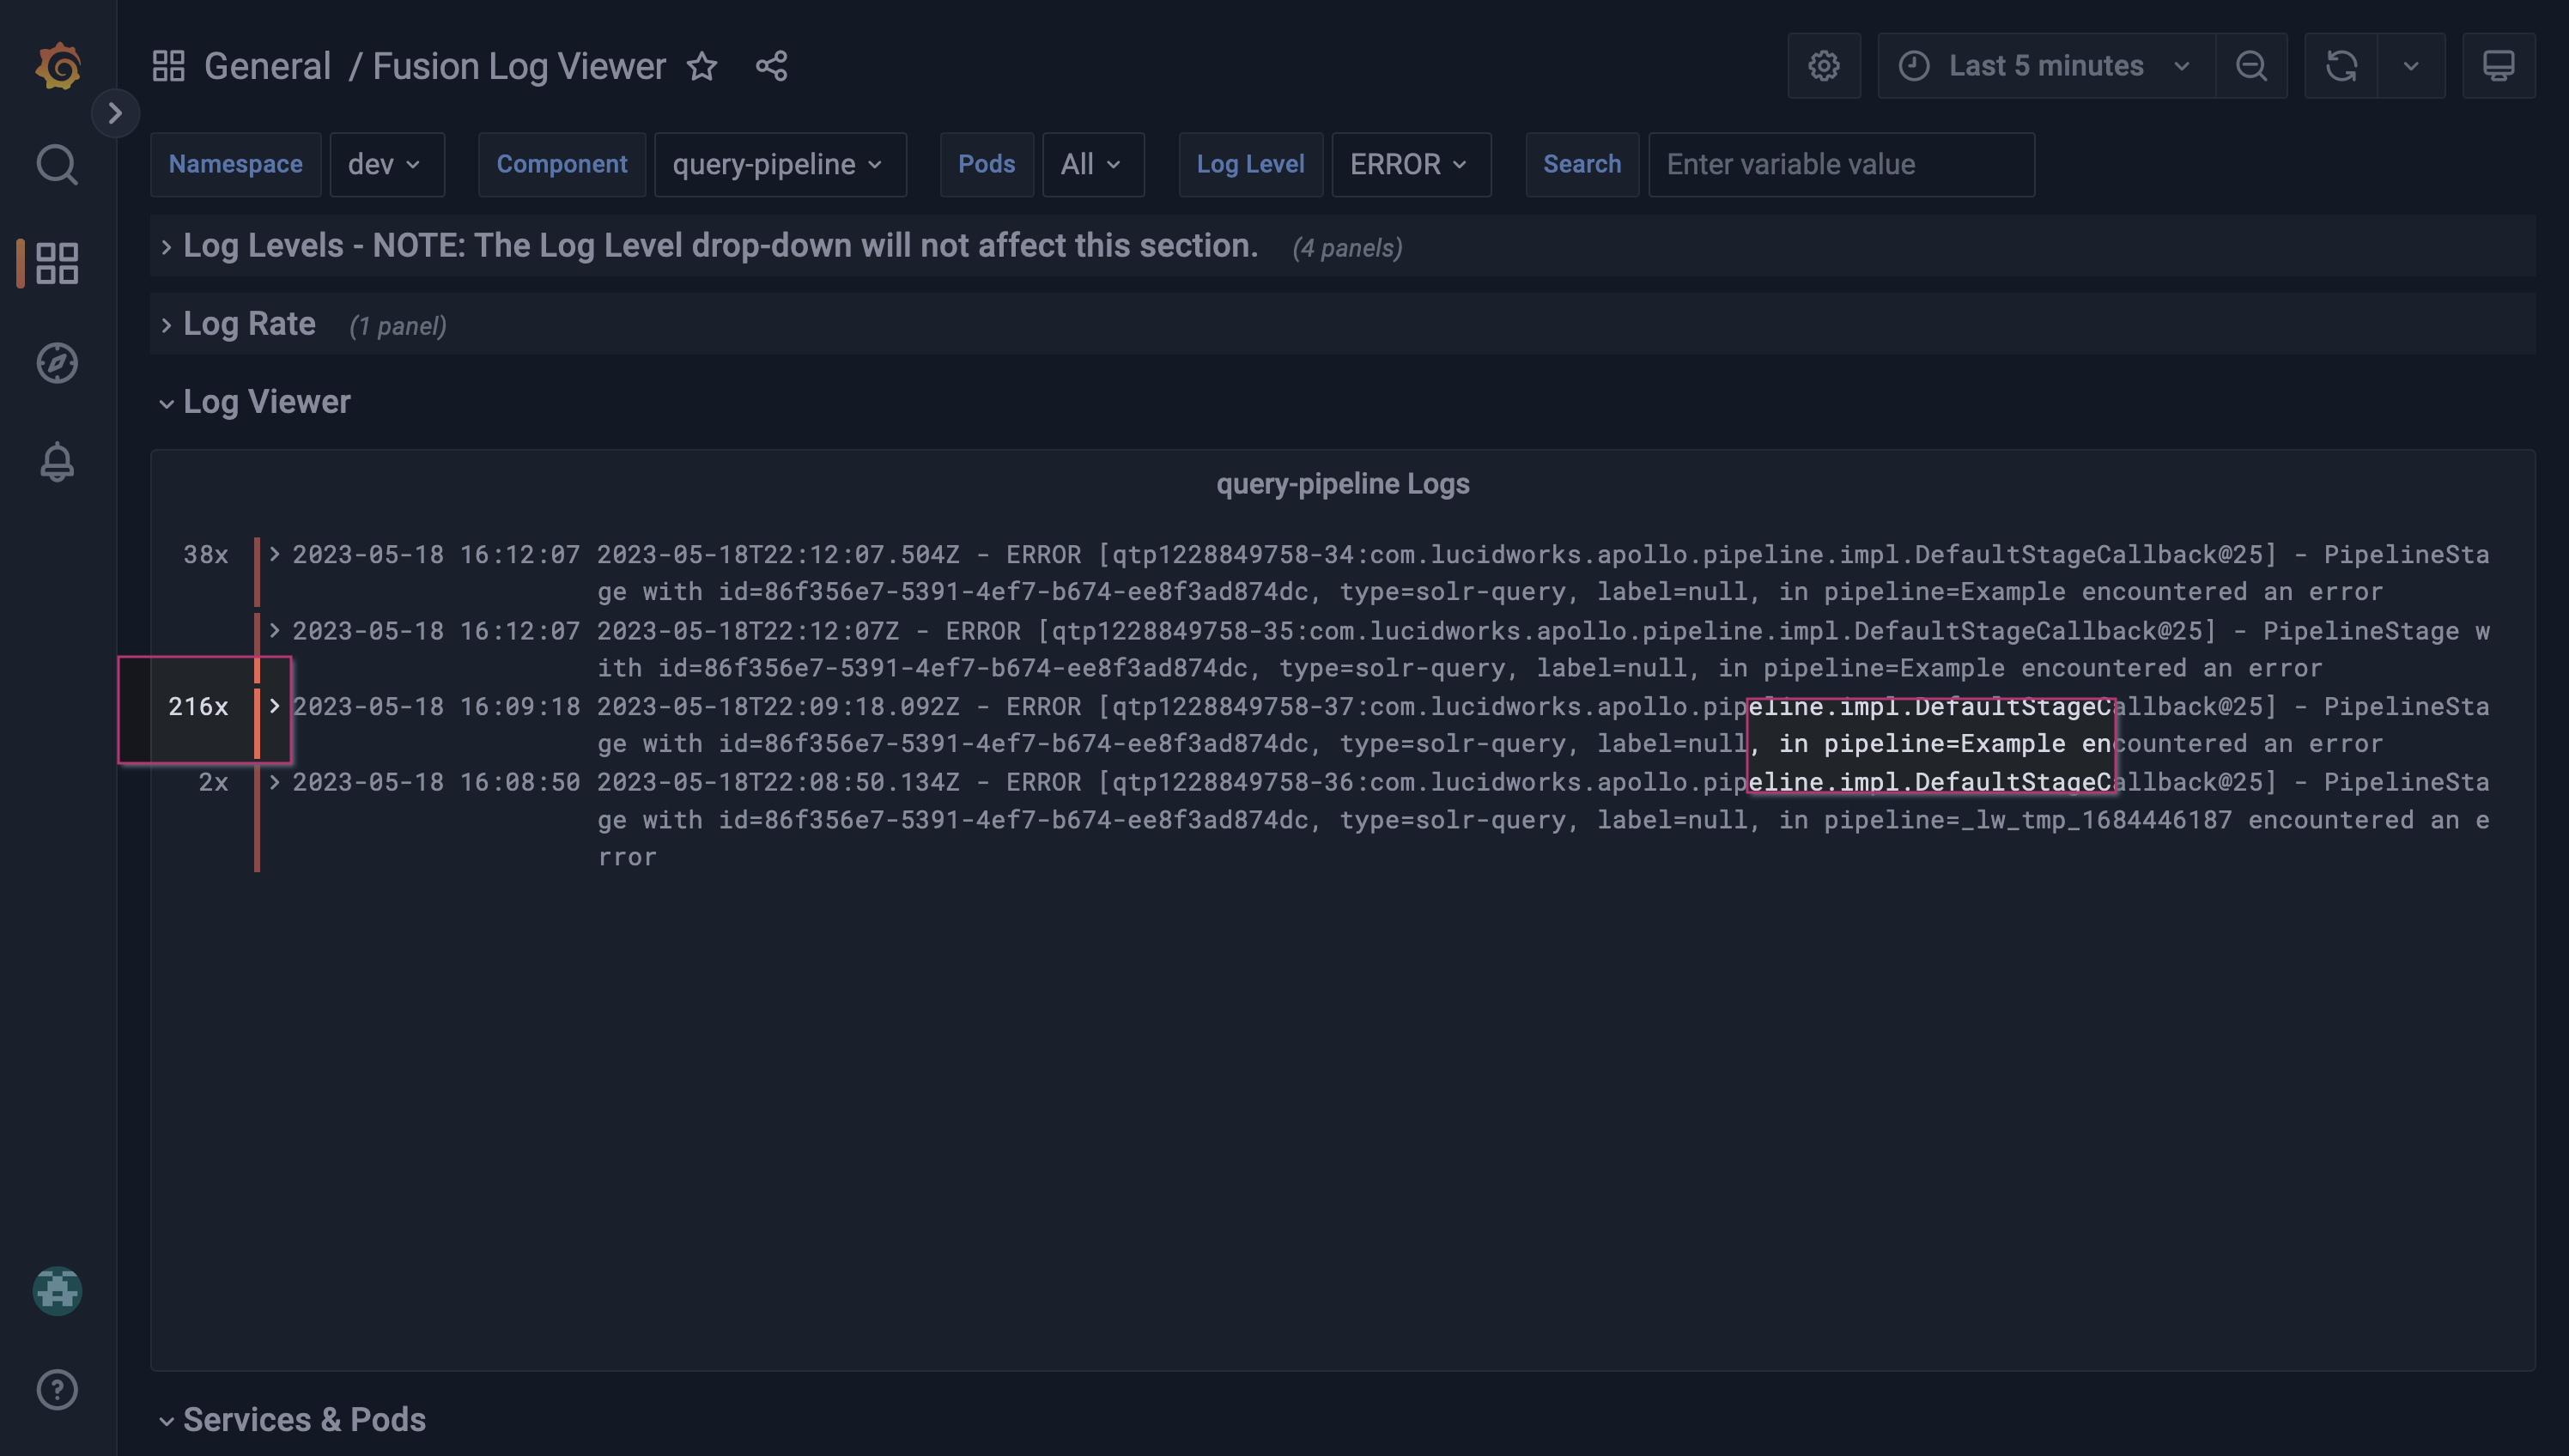
Filter the logs
Add a Component label to focus your log stream on the query-pipeline service only.
The error messages are grouped and all contain the string pipeline=Example, which corresponds to a query pipeline named Example.
After investigating the query pipeline, you notice an invalid search field was added to your Query Fields query pipeline stage. After correcting the stage, the frequent errors messages are resolved.
Explore further
The Explore tab gives additional insights for your logs data stream with Grafana Loki. To view the Log Viewer panel’s log stream in Grafana Loki, click logs to access the dropdown menu and select Explore.
For more information on these tools, see Grafana Loki for log exploration.
|
Lucidworks offers free training to help you get started. The Course for Grafana for Managed Fusion focuses on the best practices for utilizing the Grafana dashboard:
Visit the LucidAcademy to see the full training catalog. |