

top, du -h, and df; REST APIs; and JMX MBean metrics.
Lucidworks does not explicitly recommend any particular monitoring product, nor do we imply suitability or compatibility with Lucidworks Fusion. The aforementioned products are not detailed or reviewed in this topic.
Monitoring via Solr
The Solr Admin console lists information for one Solr node. This can be obtained via HTTP as needed.GET JVM metrics for a Solr node
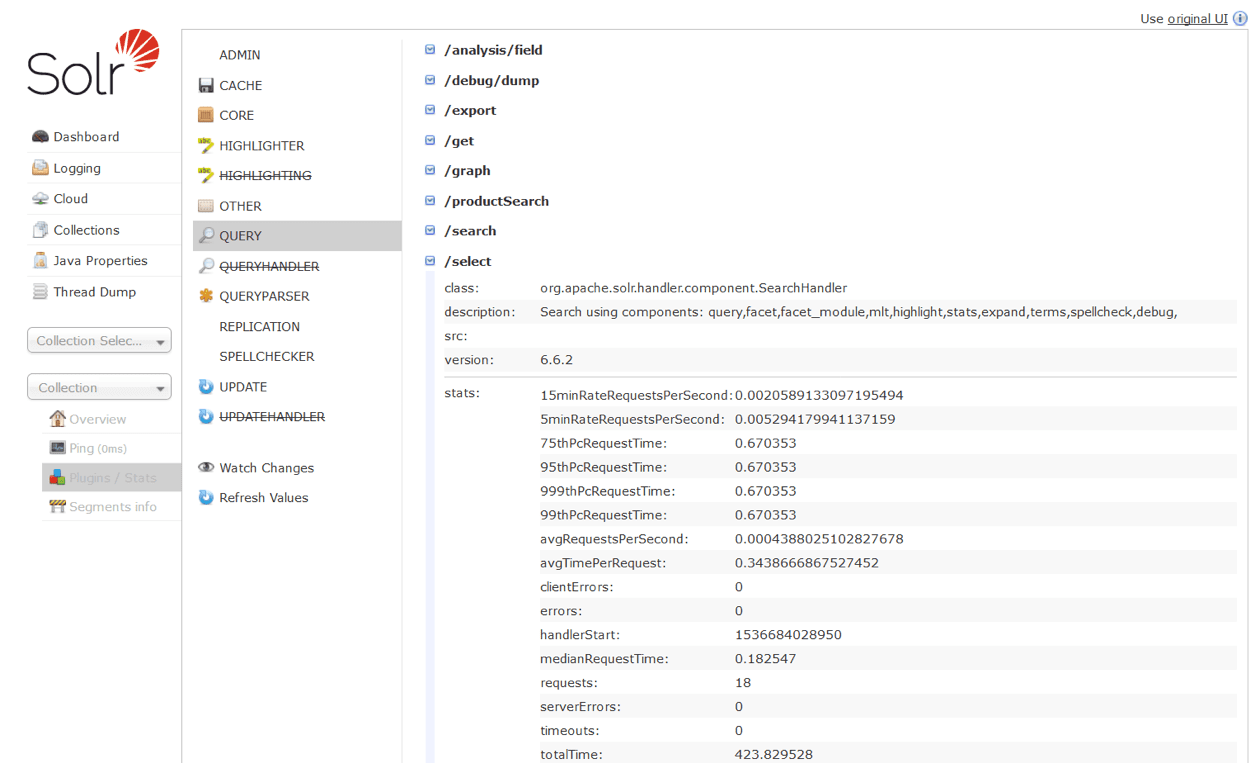
ENABLE_REMOTE_JMX_OPTS=true. Refer to Apache’s Solr reference guide for configuring JMX for more information.
Finding shard leaders in Solr
In Solr admin console
The Solr admin console’s Cloud > Graph view can show the Shards and replicas for all Solr collections in a cluster. The nodes on the right-hand side with the filled in dot are the current shard leaders. Query operations are distributed across both leaders and followers but index operations require extra resources from leaders.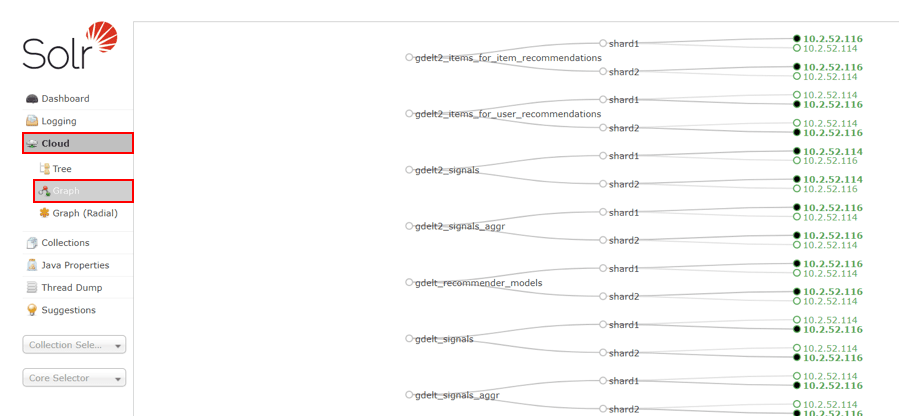
With the API
The Solr API allows you to fetch the cluster status, including collections, shards, replicas, configuration name, collection aliases, and cluster properties. Requests are made with the following URL endpoint:/admin/{parameter}?action=CLUSTERSTATUS.
Input
http://localhost:8983/solr/admin/collections?action=CLUSTERSTATUS
Output
Monitoring Fusion
The Fusion UI in Fusion 4.2 through 5.5 includes monitoring, troubleshooting, and incident investigation tools in the DevOps Center. The DevOps Center provides a set of dashboards and an interactive log viewer, providing views into this Fusion cluster’s hosts and services using metrics and events. You can monitor general system state and status via HTTP in several ways:Check the System State
Check the System State
Fusion runs several components as separate JVMs running on different ports. Each of the components is capable of reporting its status. The proxy component reports status for all of the other components.The response should look similar to the following. If ‘ping’ is true for each service, all of the system components are running.The response will be a JSON response, similar to the following:The As an alternative check, you can also query the The response looks like something like this:As an alternative check, you can also query the The response looks like something like this:
Status Check for Zookeeper and connectors-classic
To see whether each component has been started, a simple API call to the proxy (running on port 8764 by default) will return the status of each component of the system.Solr Health Check
The Fusion UI and API services are not accessible if ZooKeeper and Solr are not in healthy state. A Solr health check can be performed with a ping request, for example:status should be OK if Solr is able to return results for queries.REST API Services Health Check
All of the Fusion API backend services (except Connectors and the UI) are started at port 8765 when the run.sh script is executed. The Fusion UI depends on all these services.If all the services are started without any issues, then the below ping request should return the responseok.system/status endpoint, which returns the status.Connectors Classic Health Check
You can perform a health check of the Connectors Classic Service by sending a ping request to port 8984. Similar to the previous ping request, the returned response isok if the service started successfully.system/status endpoint, which returns the status.- Fusion 5.x.x DevOps Center
Fusion 5.x.x includes Grafana, which provides enhanced metrics collection and querying. Kubernetes containers may make some access methods more difficult. For example, JMX beans on a container. - Fusion 4.2.x DevOps Center
Fusion 4.x.x publishes a wide variety of metrics, including stage-by-stage performance for pipelines via the Fusion Metrics API. The Fusion metrics provide valuable insight into stage development, hot-spot identification, and overall throughput numbers. See Use System Metrics for more information.
Use System Metrics
Use System Metrics
Enable metrics indexing in the Fusion UI
- Navigate to System > System > Metrics.
- Enable Record System Metrics Over Time.
Enable metrics indexing using the REST API
/system/metrics endpoint of the System API lists all the metrics that the system is currently collecting. Metrics are returned for the current instance only; Fusion instances do not aggregate metrics between nodes.Adjust the system metrics retention period
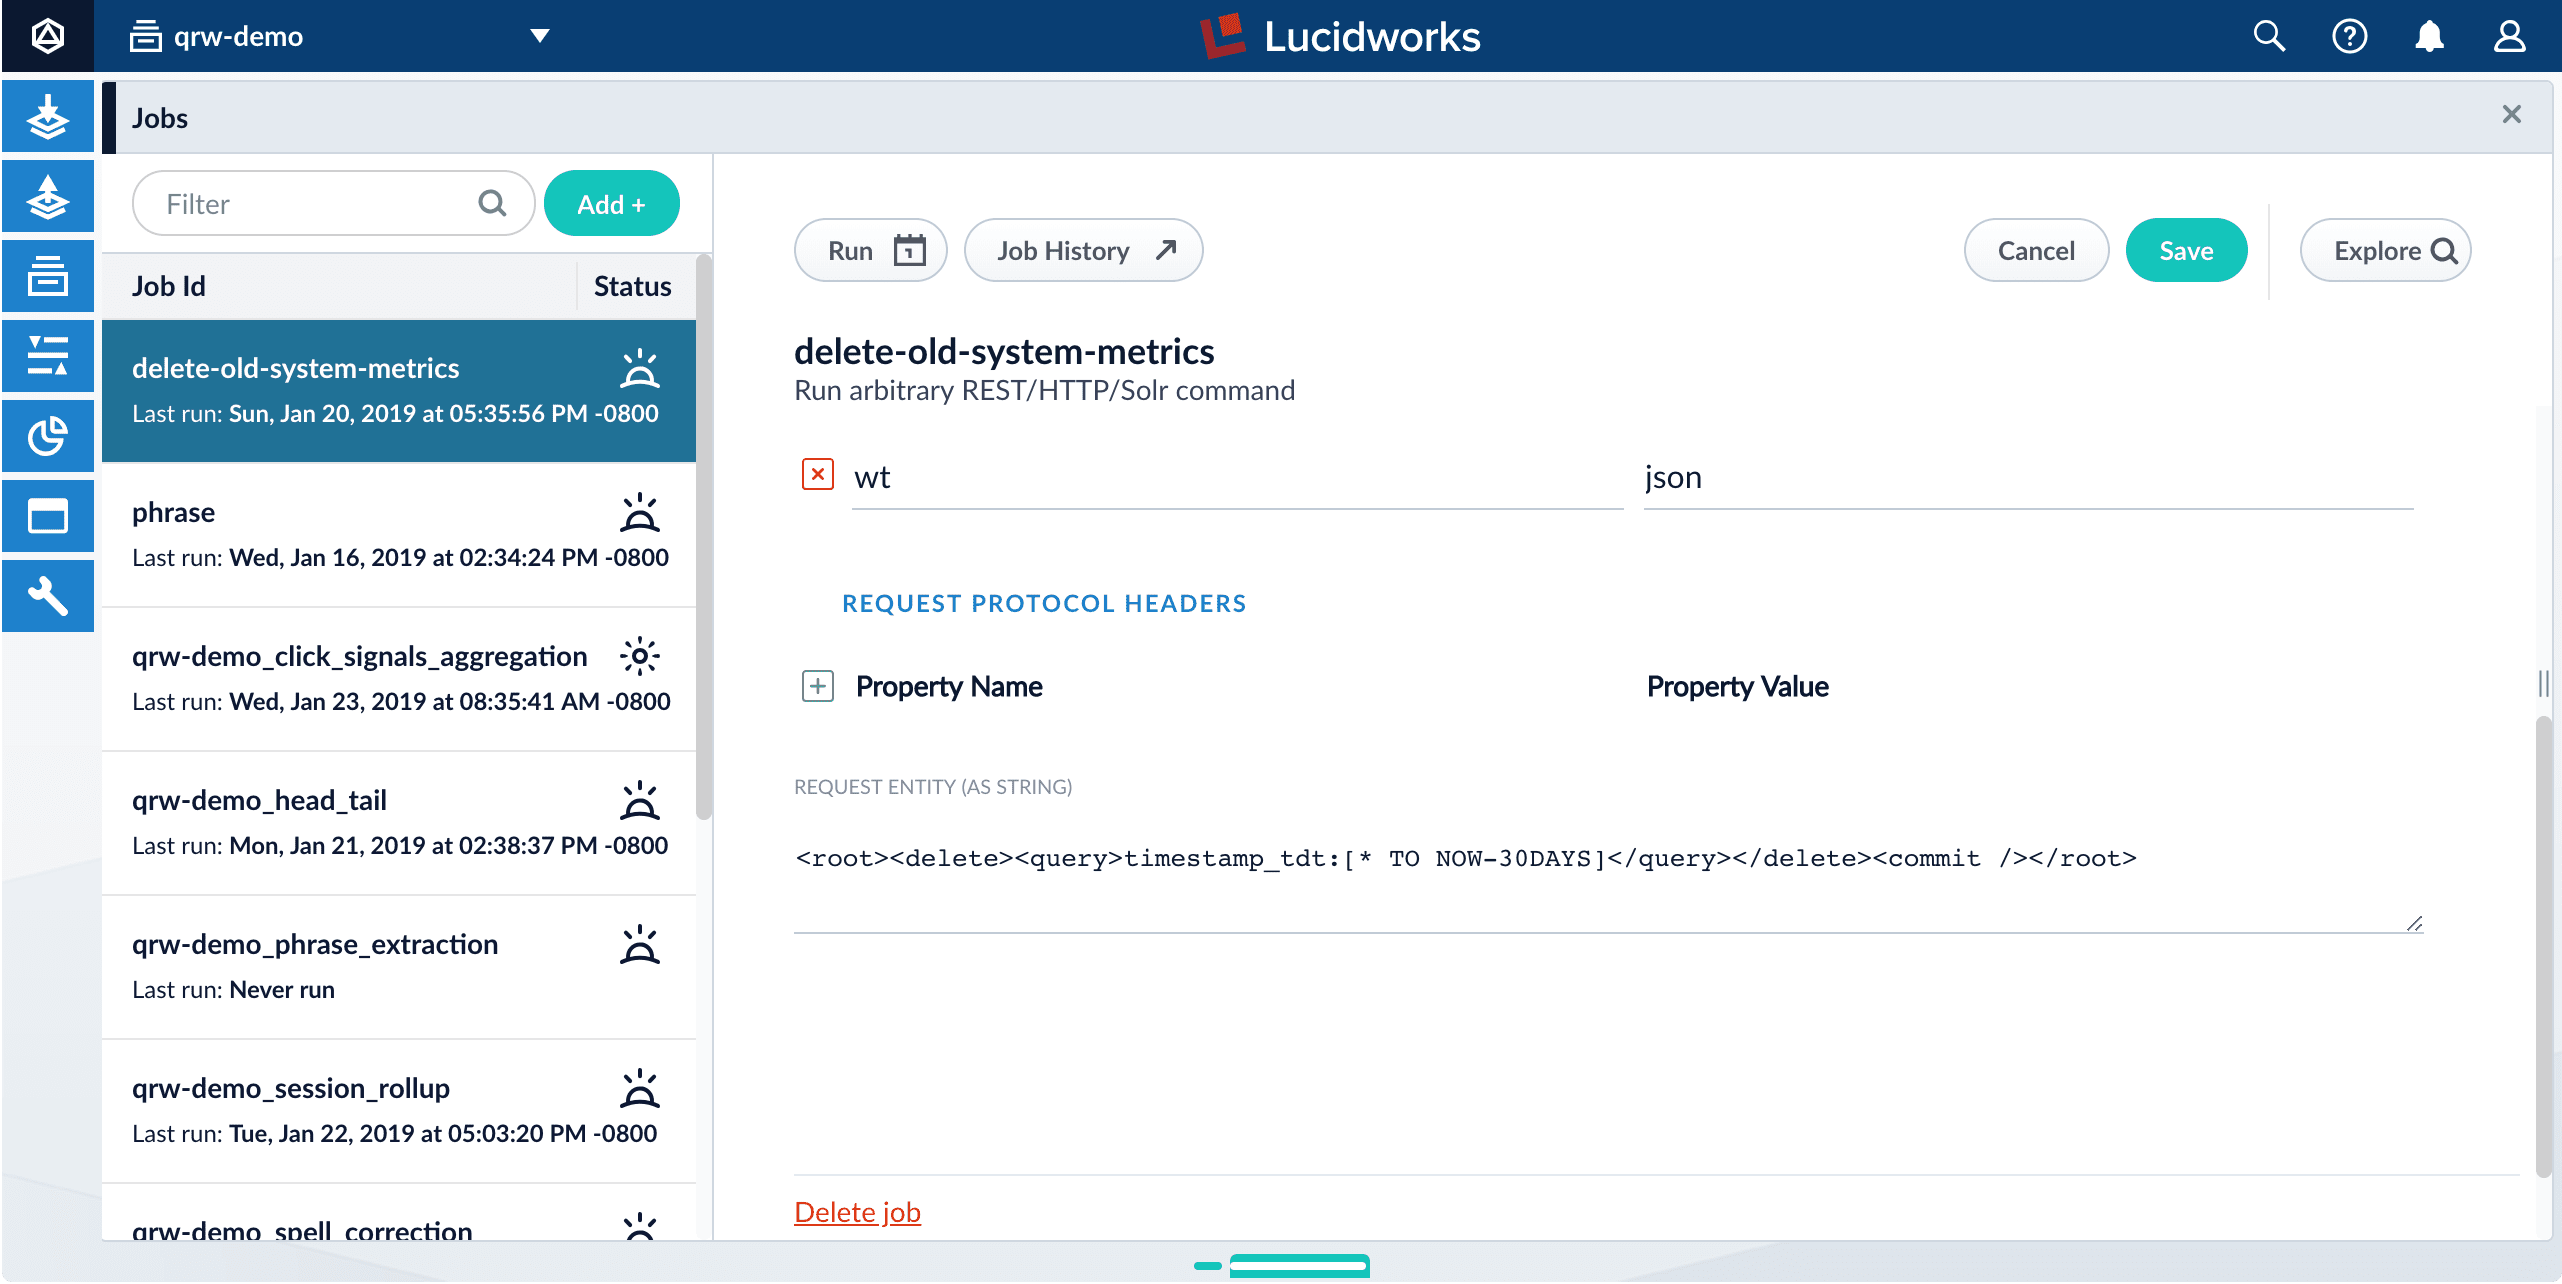
- Navigate to Collections > Jobs.
-
Select the
delete-old-system-metricsjob. -
In the job configuration pane, scroll down to REQUEST ENTITY (AS STRING).
-
Change
30DAYSto the desired period of time to retain system metrics.
Change Metric Collection Frequency
The default frequency to collect metrics is 60 seconds. Since the metrics are stored in a system collection (and a Solr instance), the data can grow to be quite large over time. If you do not need metrics collection to happen as frequently (perhaps during initial implementation), you can change the frequency by modifying thecom.lucidworks.apollo.metrics.poll.seconds configuration parameter with the Configurations API.For example:com.lucidworks.apollo.metrics.poll.seconds parameter to ‘-1’.Check which Fusion services are running
Check the cluster-wide status for a service
Monitor the logs collection
In addition to the on-disk log files, most of the key Fusion logging events are written to the Logs collection. You can monitor these logging events with the Logging Dashboard.The log creation process can be altered in the
fusion.cors (fusion.properties in Fusion 4.x) file located in /fusion/latest.x/conf/. If log files are not being created and stored in the logs collection, check the configurations in this file.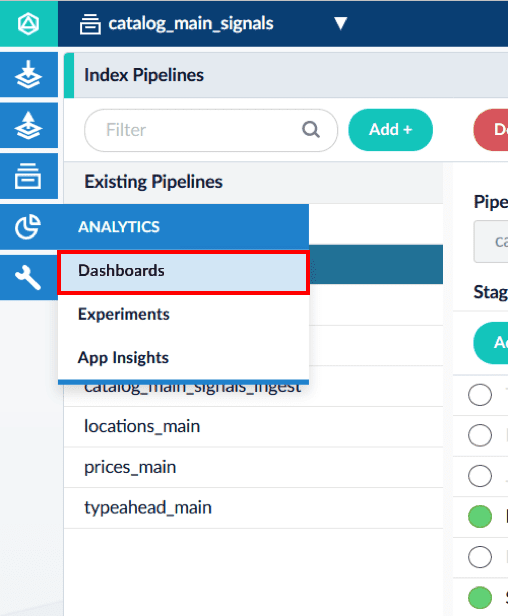
See what scheduled jobs are running
The Fusion UI’s Datasources and Jobs pages show the most recent status for data ingestion jobs and other jobs that can be scheduled.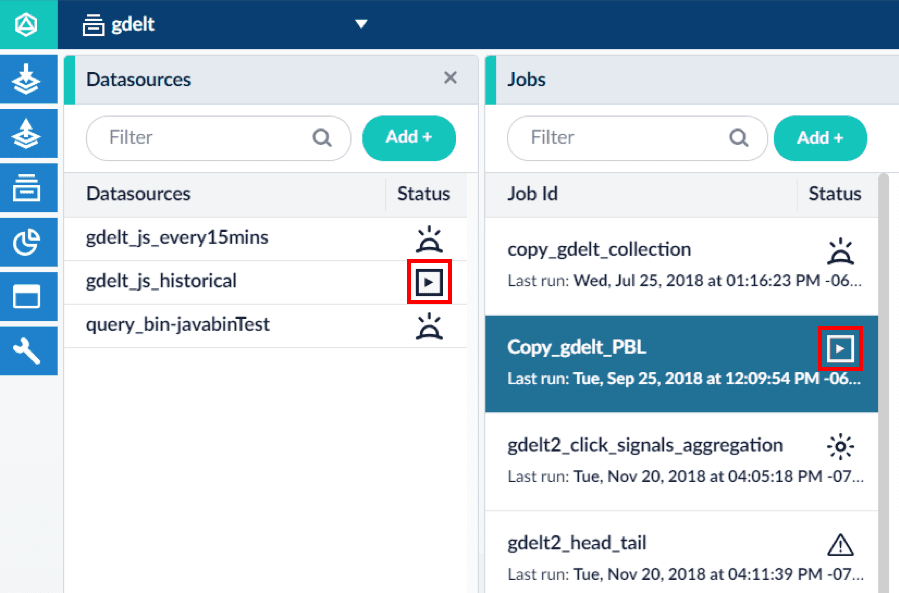
What to monitor
Several levels of information should be monitored, including hardware resources, performance benchmarks, the Java virtual machine, Lucene/Solr, and others. The point at which a monitored metric should trigger a warning or alarm condition is highly dependent on user-specific factors, such as the target audience, time tolerance thresholds, and real-time needs.Hardware and resources
This is just knowing what is going on with the overall system resources.Performance benchmarks
These benchmarks are available via JMX MBeans when using JConsole. They are found under the namespacesolr/<corename>. Some of these metrics can also be obtained via the fields below.
Java Virtual Machine
The Java Virtual Machine is found via JMX MBeans. Many are also available via REST API calls. See System API for details.JMX runtime
The JMX runtime value is an important piece of data that helps determine time frames and gather statistics, such as performance over the last five minutes. A user can use the delta of the runtime value over the last time period as a divisor in other statistics. This metric can be used to determine how long a server has been running. This JMX MBean is found at: ““java.lang:Runtime”,Uptime`.Lucene/Solr
This can be found via JMX as well.Learn more
View and Analyze Logs in Fusion 4.2
View and Analyze Logs in Fusion 4.2
Fusion has several features that make analysis of log files easier:
-
View log file dashboards.
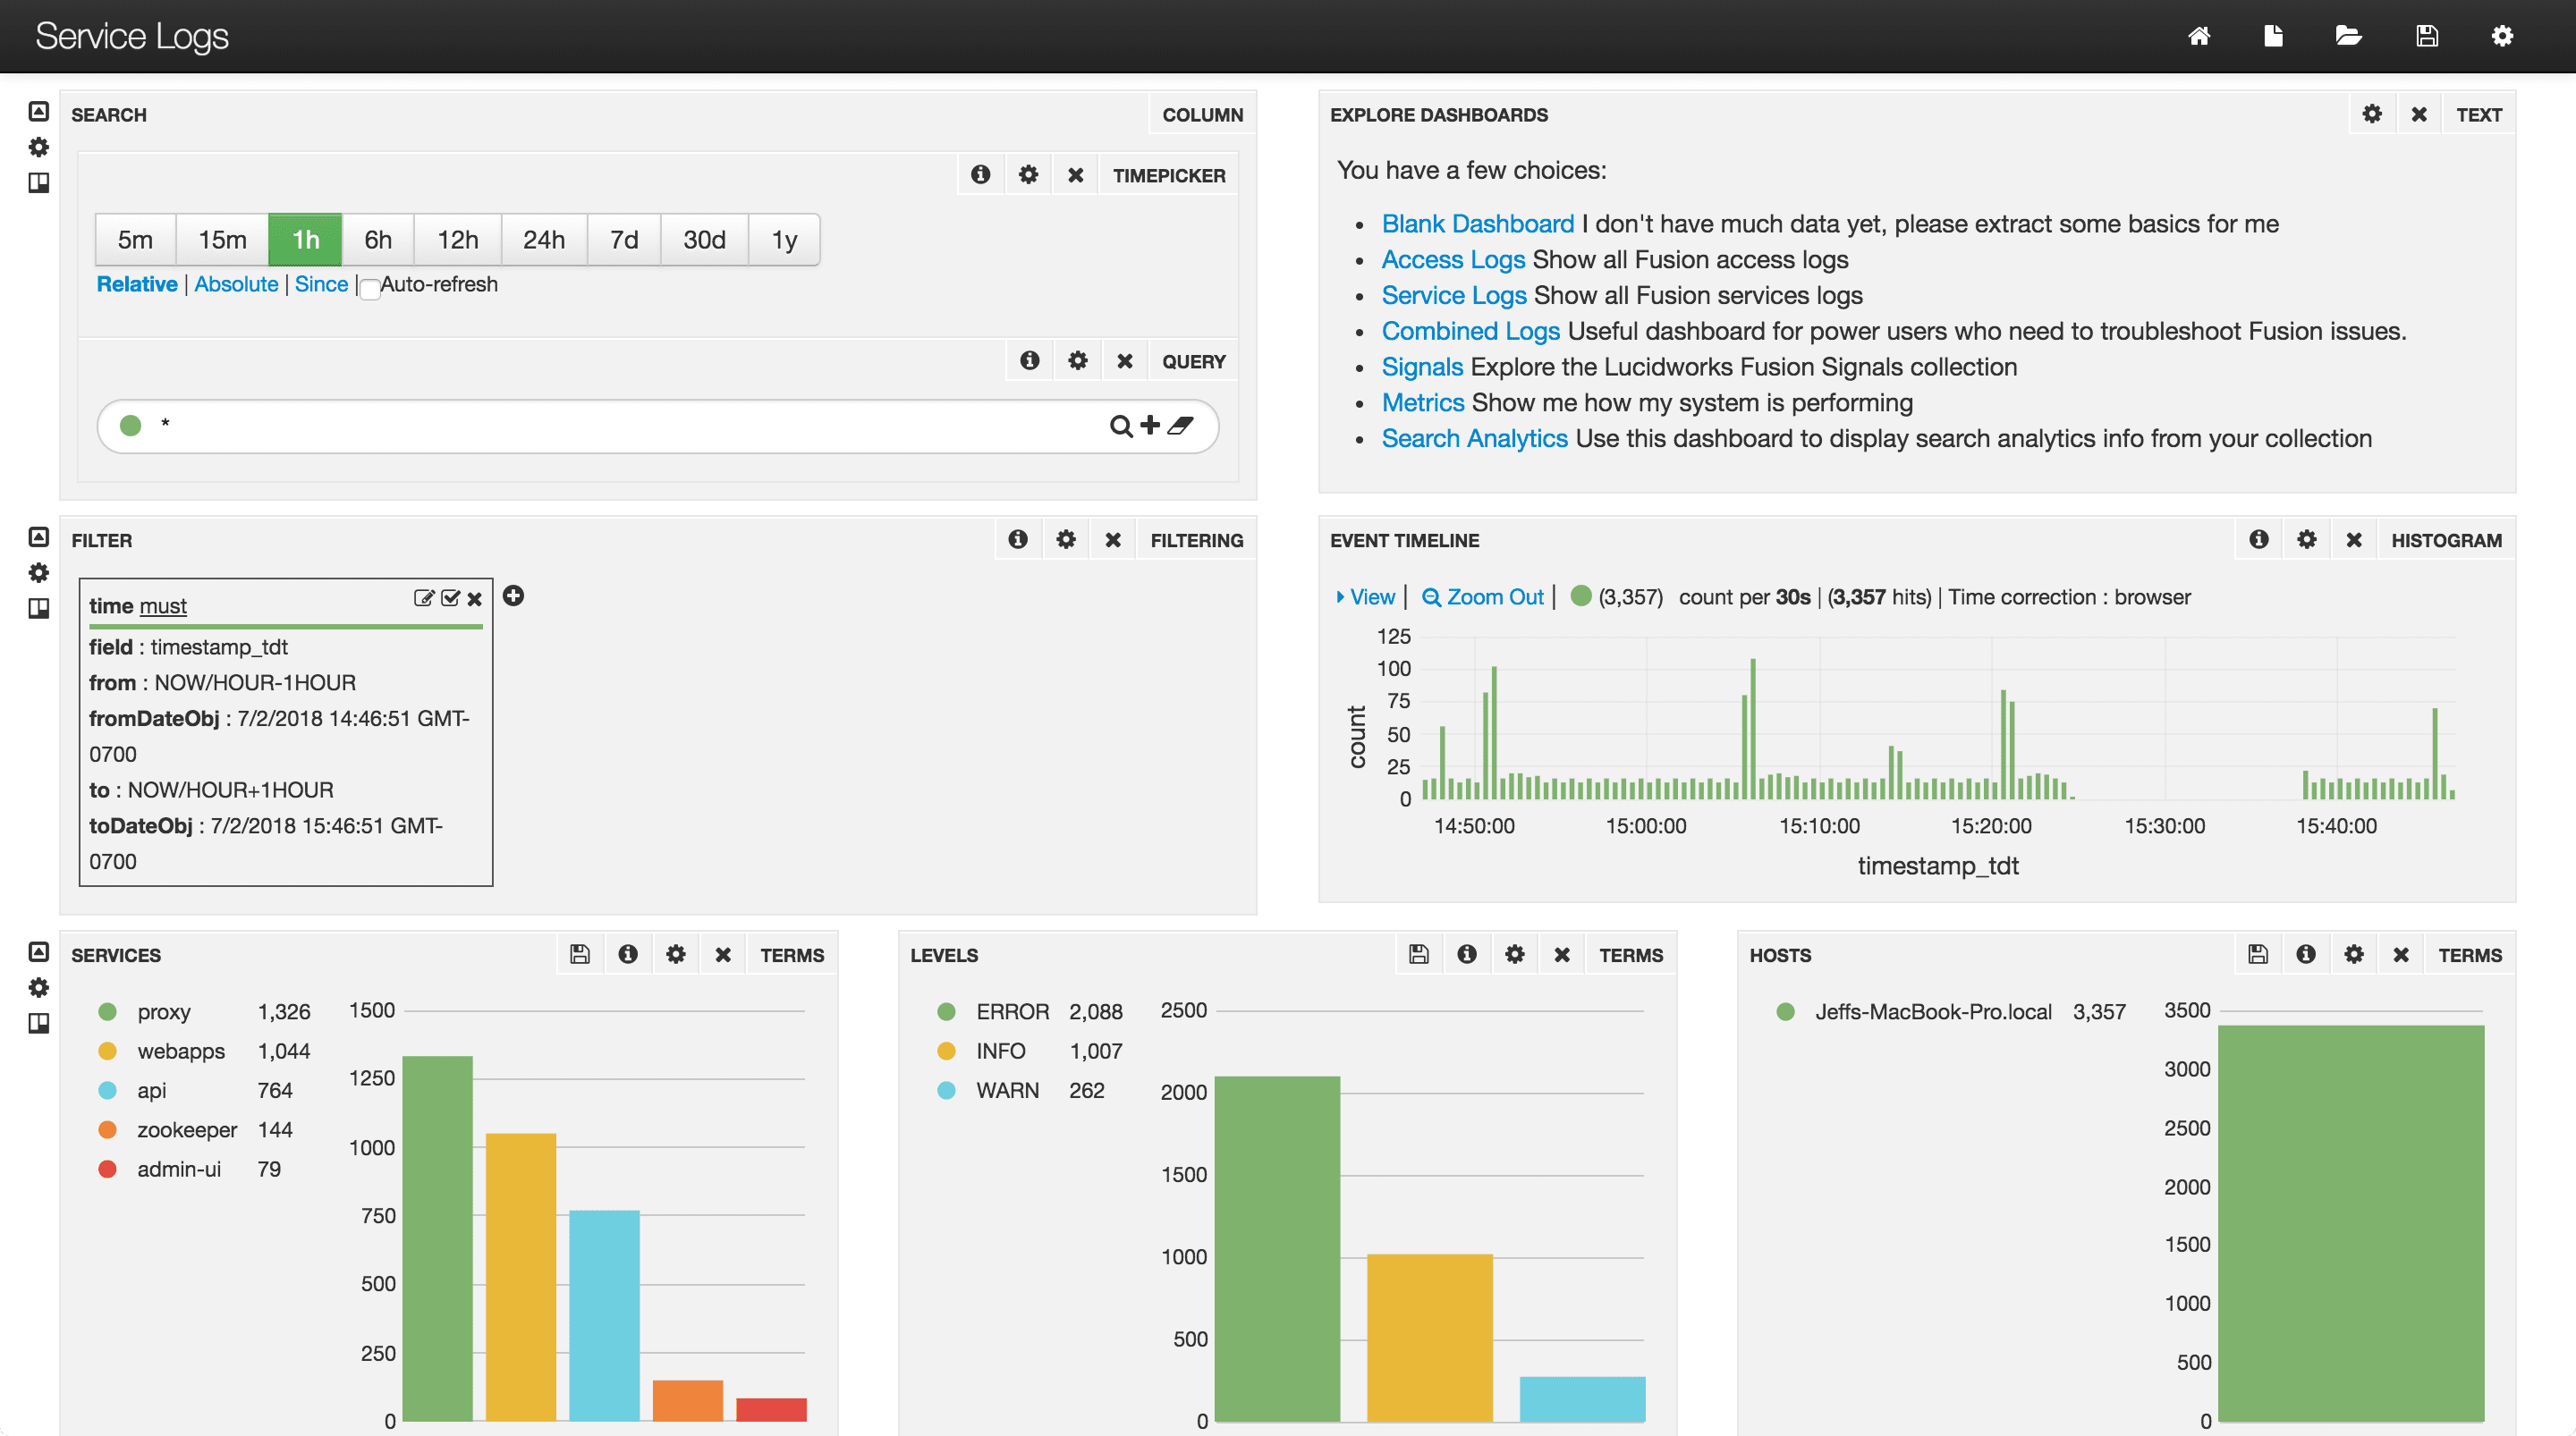
To open the default dashboard from the Fusion workspace, click Analytics > **Dashboards** or System  > Log Viewer.
- Assign Fusion request IDs. To make it easier to follow requests through the Fusion system, you can assign Fusion request IDs. If you do not, Fusion assigns request IDs automatically.
-
Filter log file dashboards by the Fusion request ID. In the log file dashboards, you can filter by Fusion request ID.
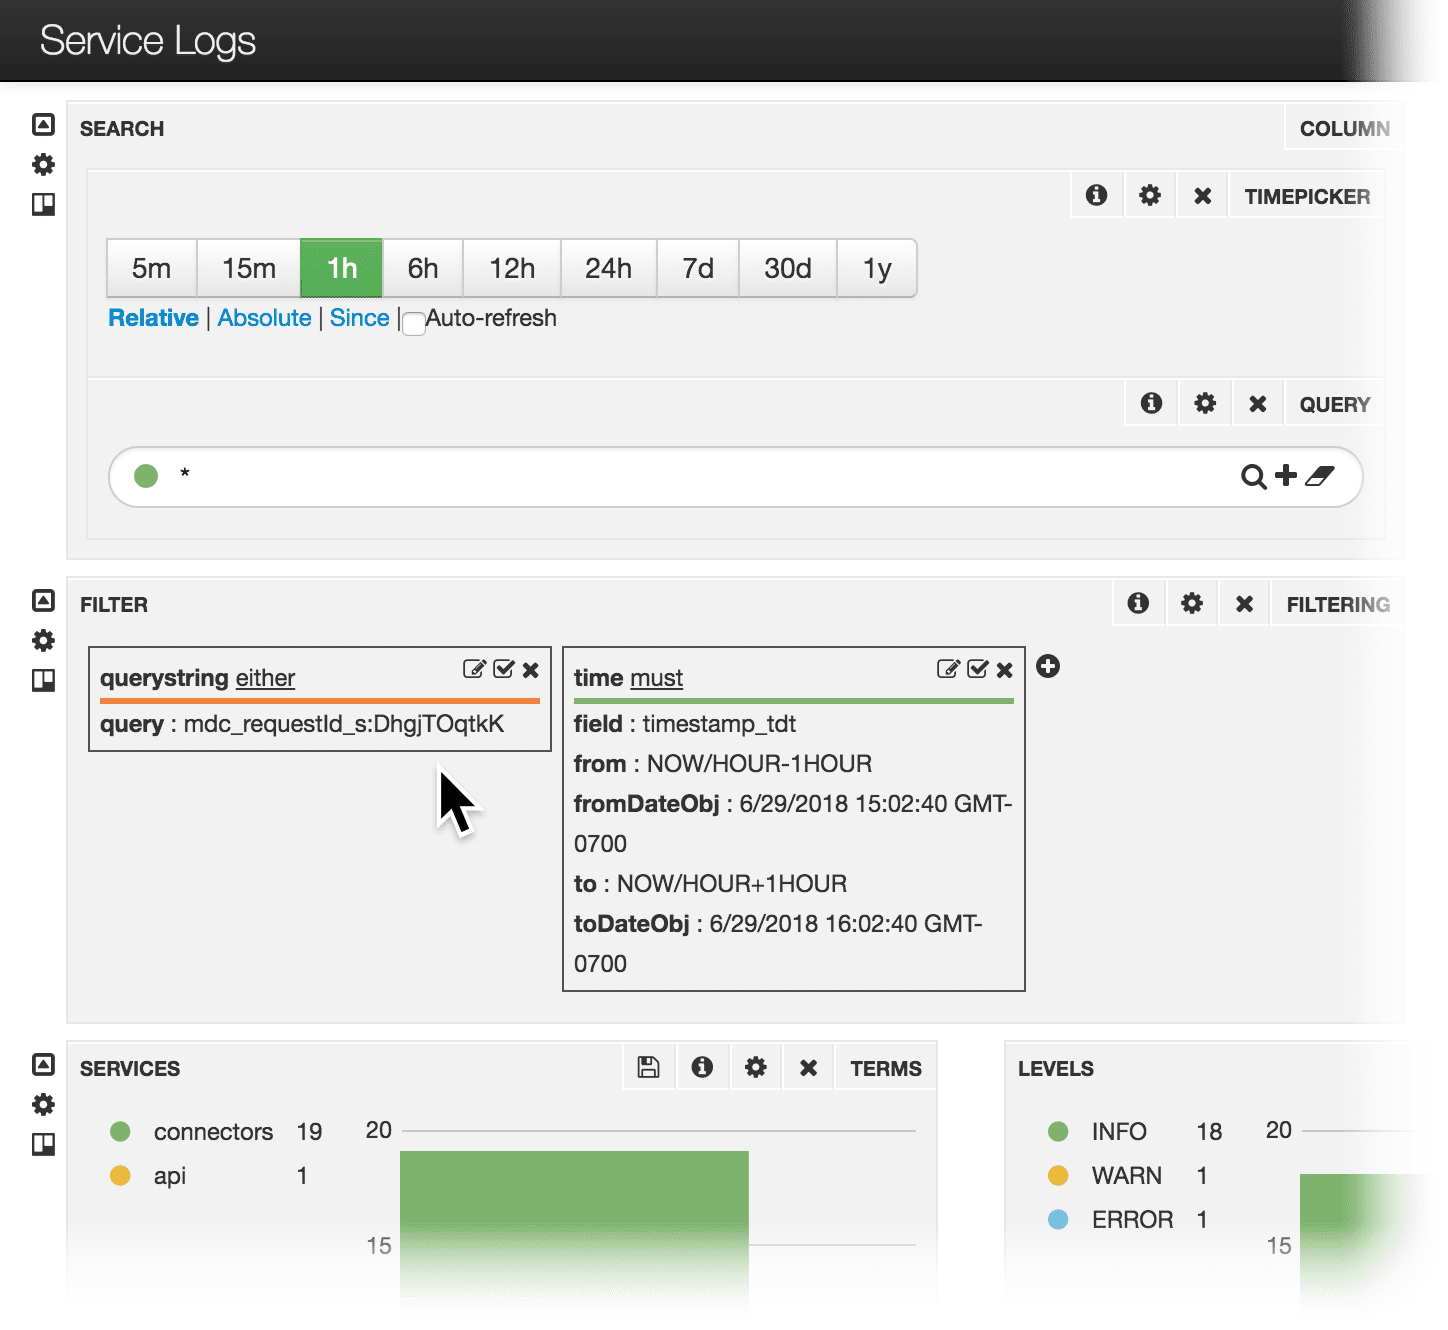
- Click through from API errors in the Fusion UI to the Service Logs dashboard filtered by the Fusion request ID of the request that resulted in the error.