View logs in Self-Hosted Fusion 5.6 and later
Table of Contents
Prerequisites
Before you view logs, complete the procedures in Configure Grafana, Prometheus, Promtail, and Loki in Fusion.
View logs
Use the following steps to view the logs.
-
Log in to Grafana.
-
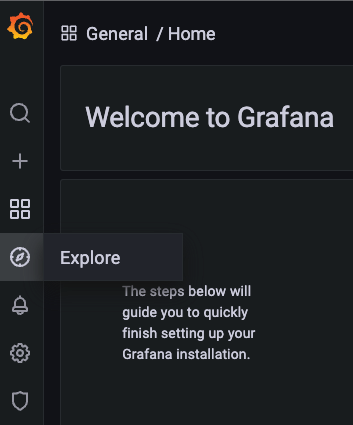
Select Explore from the icon menu.
-
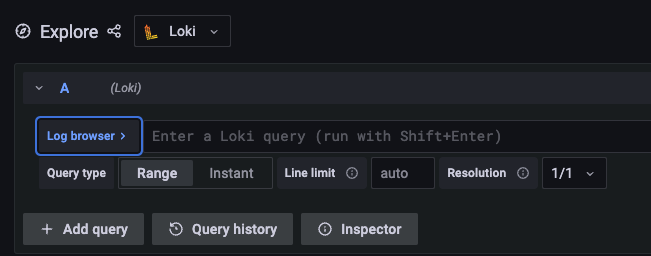
Click on Log Browser to display the advanced query options.
-
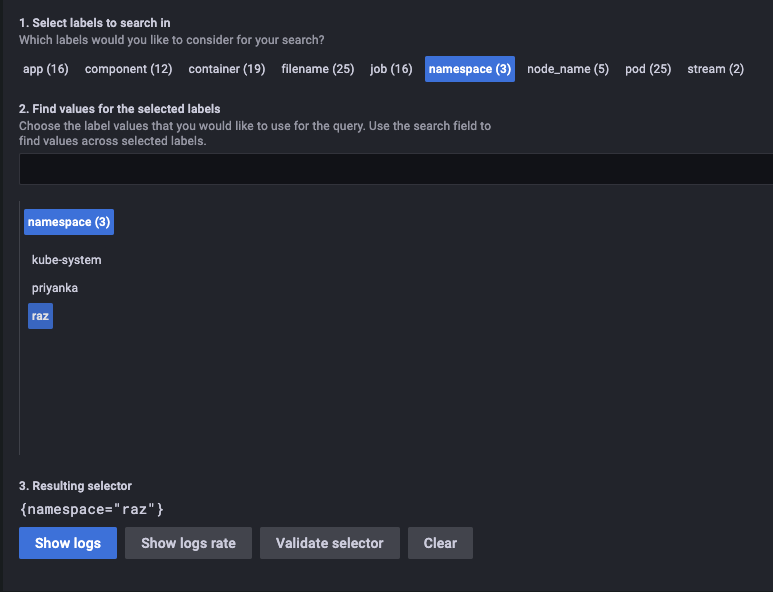
Use the Select labels to search in options to display the desired filtering criteria.

-
Click Show logs.
-
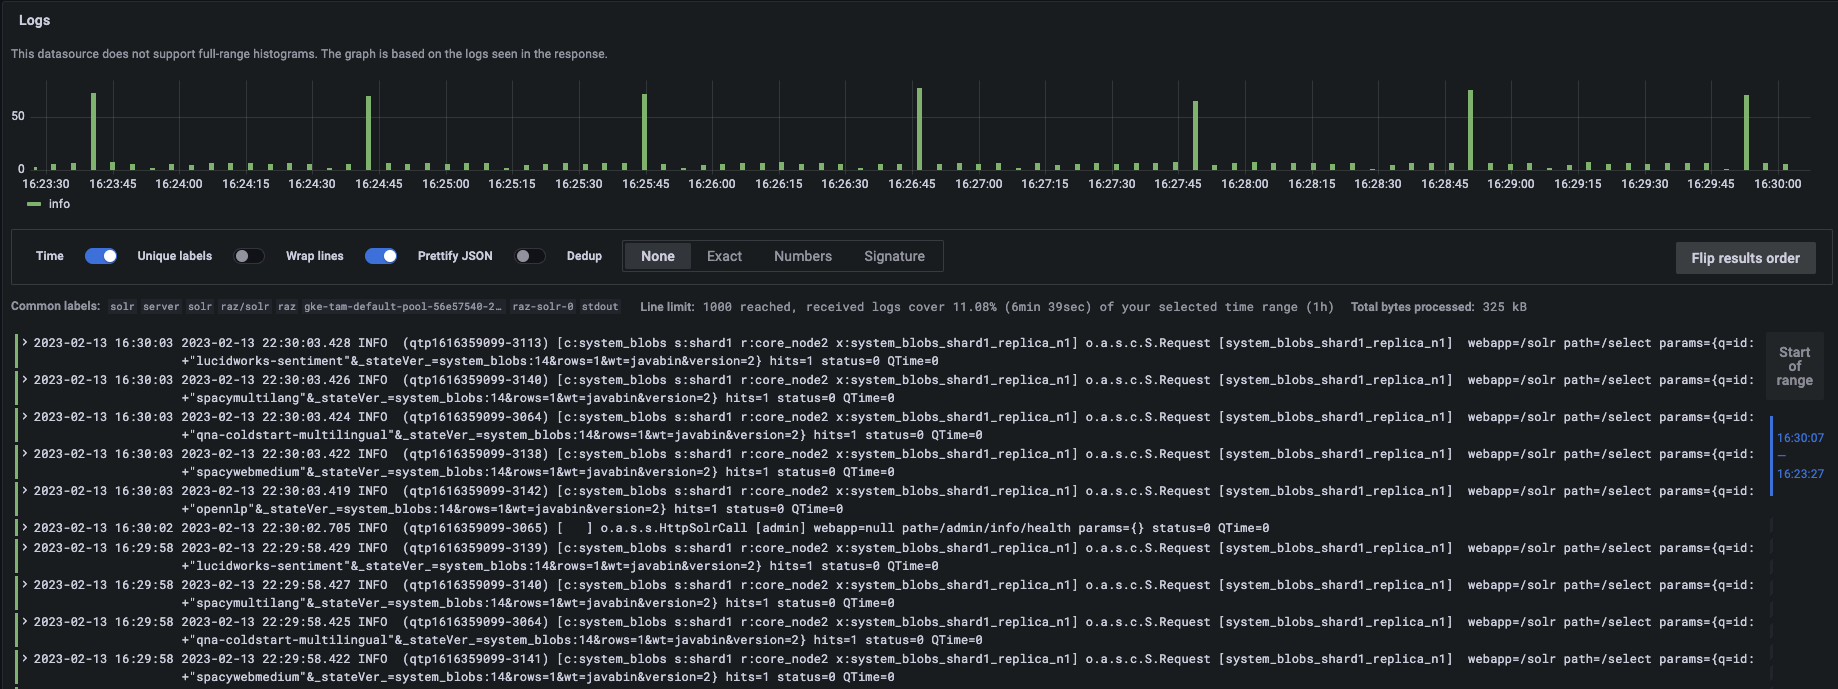
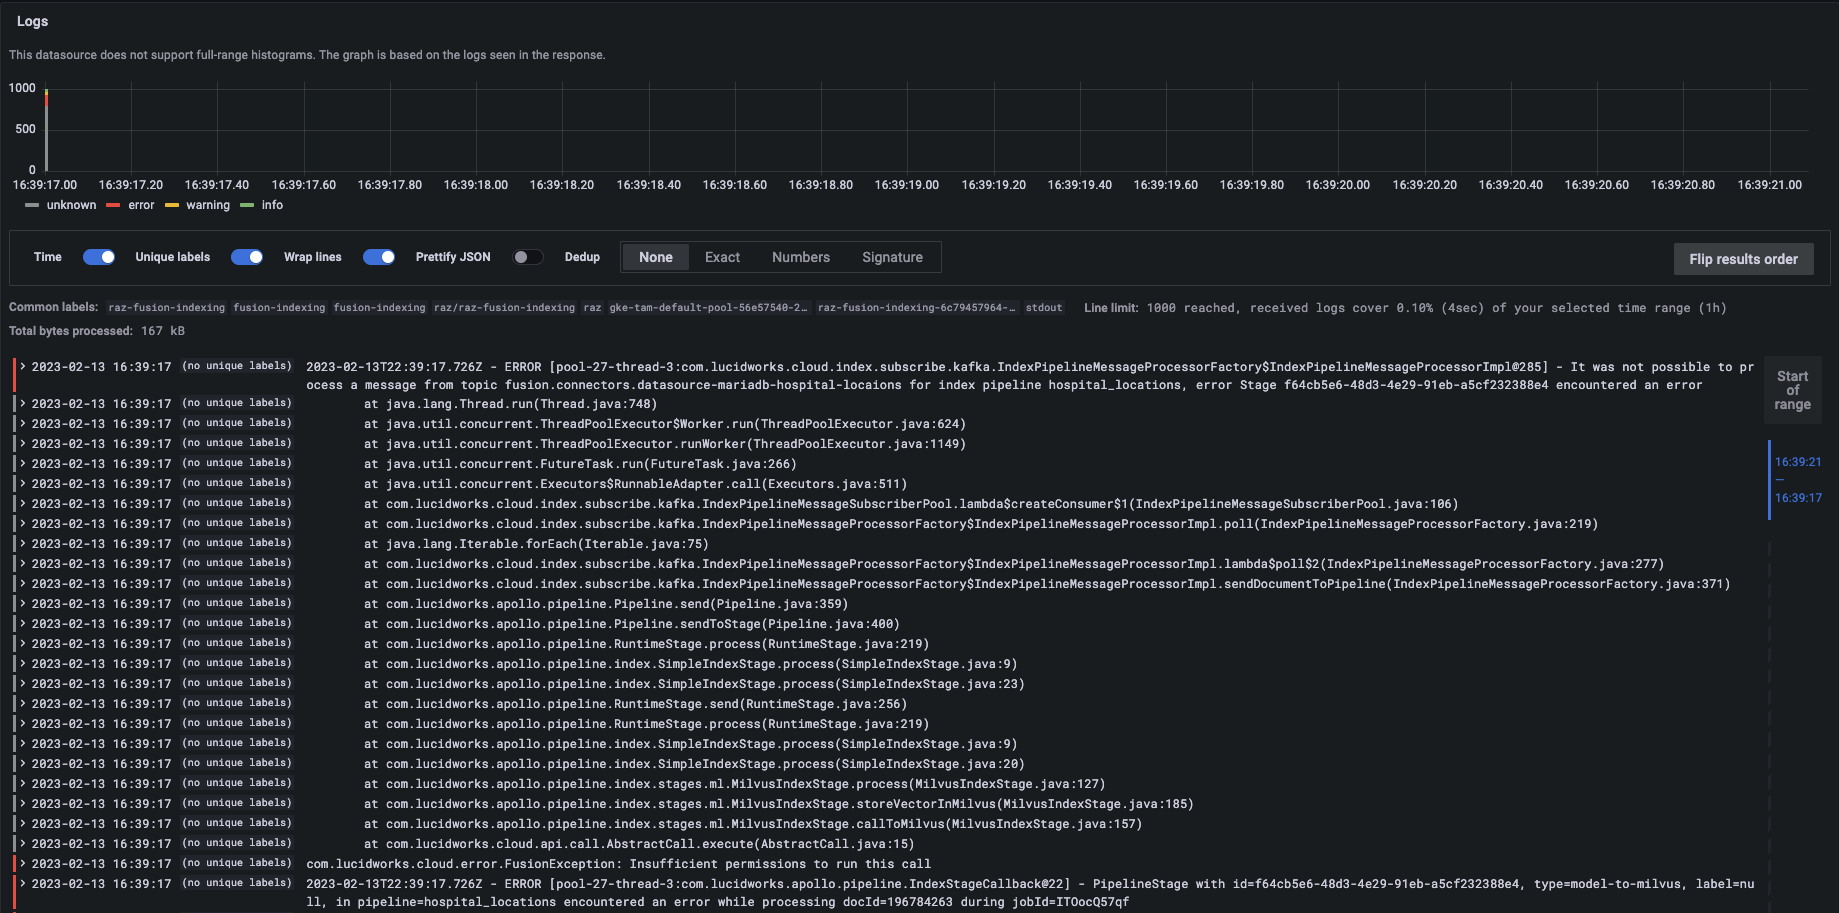
A histogram shows for the timeline.

-
You also see logs.
-
If there were any errors, the stack trace shows.
-