Significant Terms (significant_terms)
The significant_terms function finds anomaly terms in a text or string field that appear more frequently in a search result set than the entire index.
The significant_terms function takes four parameters:
-
The string or text field in which to find the terms.
-
The minimum term length to be considered a significant term.
-
The minimum document frequency for a term to be considered a significant term. If greater than one, this value is treated as an absolute number of documents. If the value is a float between 0 and 1, it is considered to be a percentage of total documents.
-
The maximum document frequency for a term to be considered a significant term. If greater than one, this value is treated as an absolute number of documents. If the value is a float between 0 and 1, it is considered to be a percentage of total documents.
Sample syntax
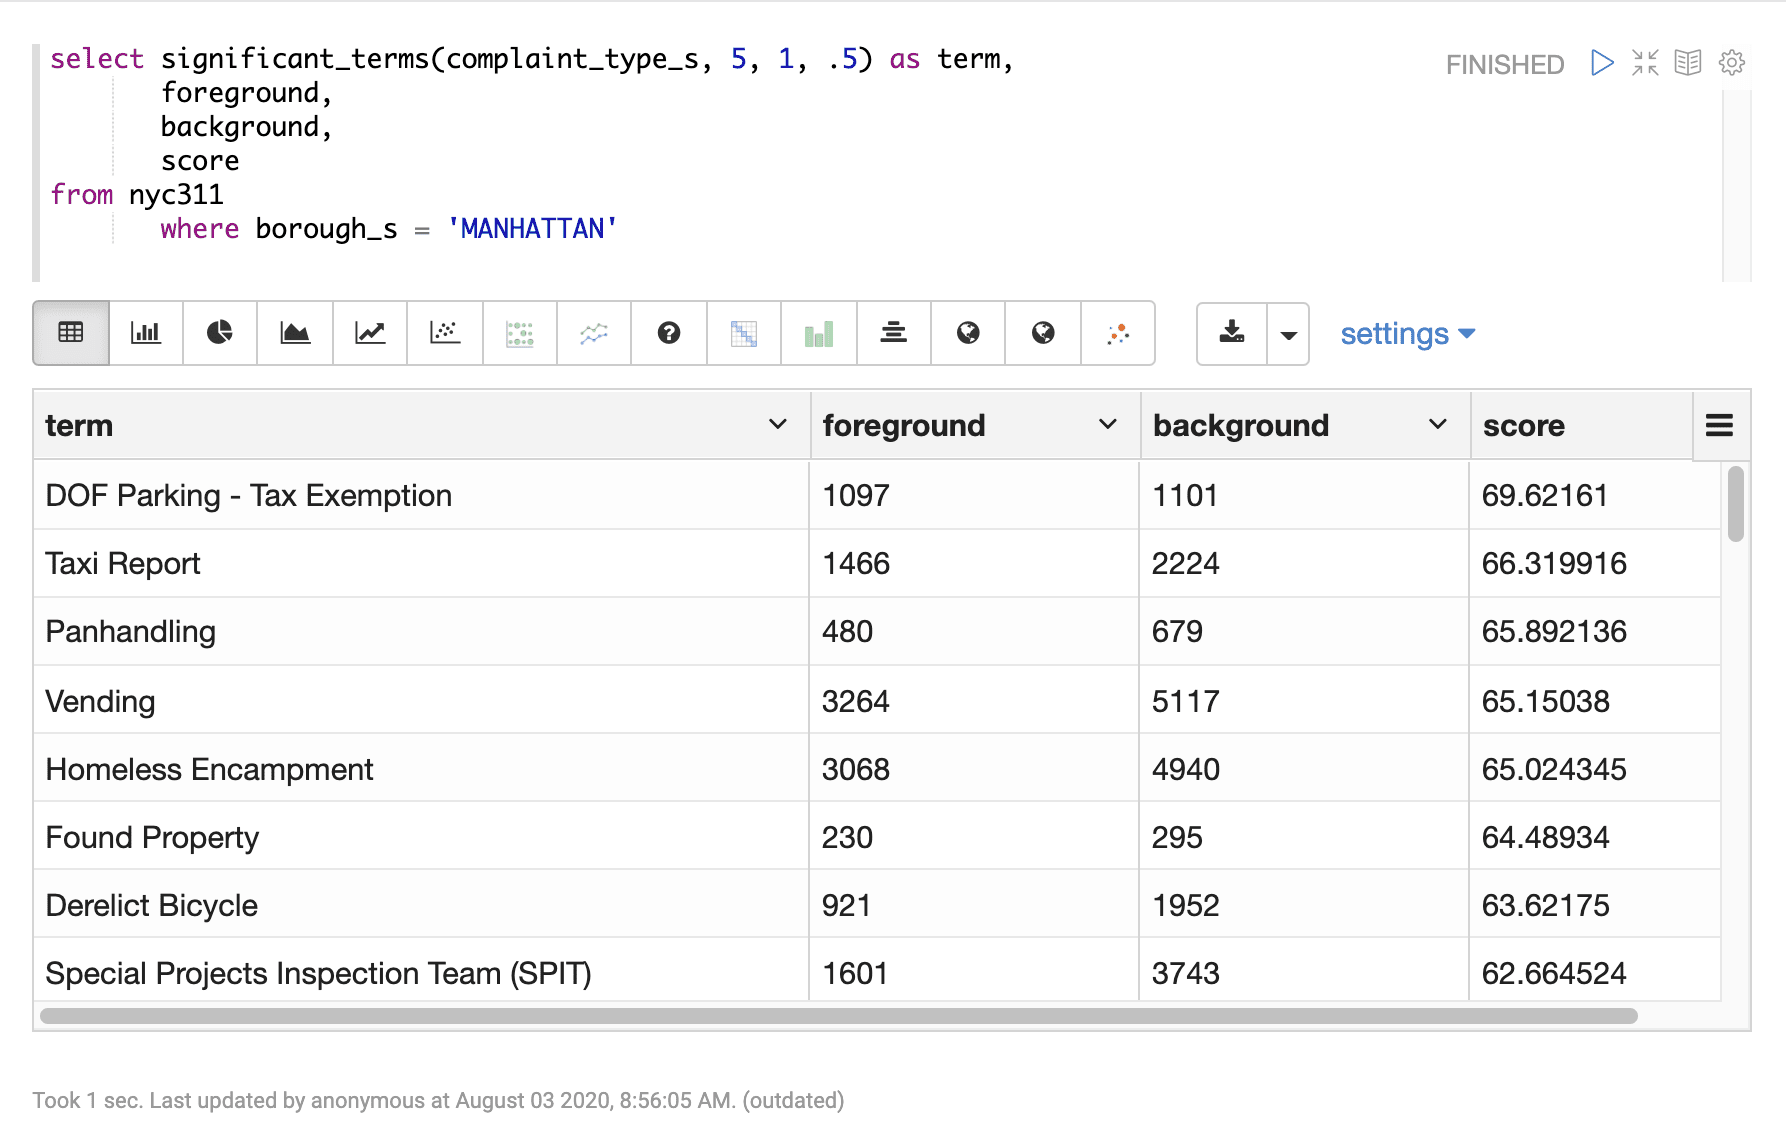
select significant_terms(complaint_type_s, 5, 1, .5) as term,
       foreground,
       background,
       score
from nyc311
       where borough_s = 'MANHATTAN'
limit 10
Result set
The result set for the significant_terms function contains one row for each significant term.
The significant_terms function returns the value of the term. There are three additional fields
available when the significant_terms function is used:
-
The foreground field returns the number of documents that contain the term within the result set.
-
The background field returns the number of documents that contain the term in the entire index.
-
The score field returns the score for the field which is calculated based on the background and foreground counts. Terms are returned in score descending order.

Visualization
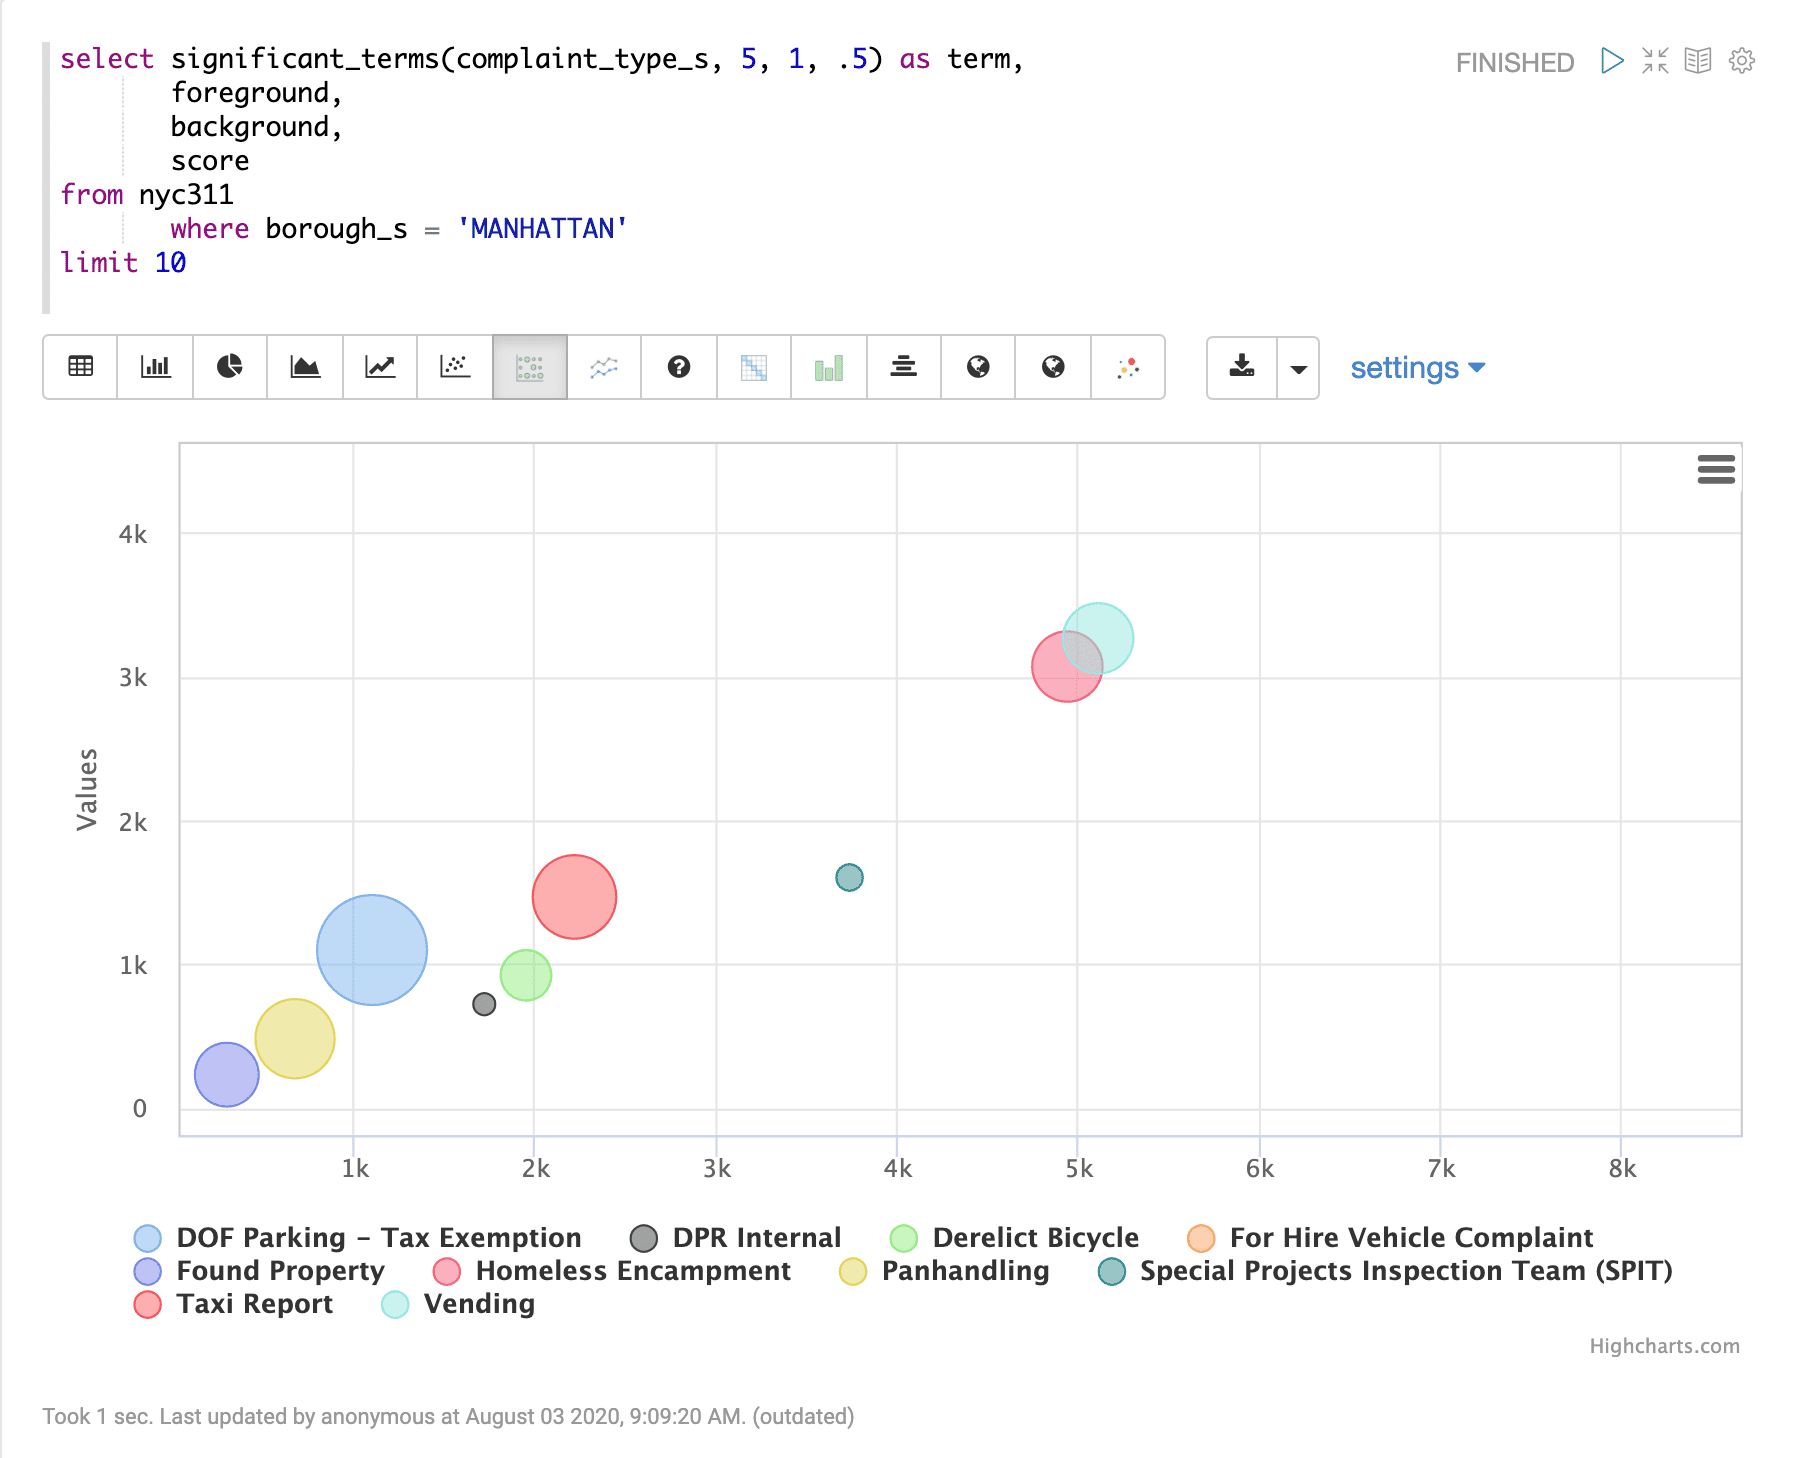
The significant_terms result is shown below visualized in an Apache Zeppelin bubble chart. In the bubble chart, the:
-
Background counts are plotted on the x-axis
-
Foreground counts are plotted on the y-axis
-
Bubble size is determined by the score
-
Term is displayed in the color coded legend
The bubble chart displays how many documents contain a term, both in the entire index and in the query result set, and how it influences the score.
