- Leveraging existing machine learning models and workflows
- Using popular tools (Python ML, TensorFlow, scikit-learn, and spaCy) to quickly create and deploy new models
- Index billions of records of any type, from any data source
- Process thousands of queries per second from thousands of concurrent users
- Conduct full-text search using standard SQL capabilities and powerful analytics
Key concepts
Fusion’s ecosystem allows you to manage and access your data in an intuitive fashion.Apache Solr
Solr is the fast open source search platform built on Apache Lucene™ that provides scalable indexing and search, as well as faceting, hit highlighting, and advanced analysis/tokenization capabilities. Solr and Lucene are managed by the Apache Software Foundation. For more information, see the Solr Reference Guide for your Fusion release.Apache Spark
Apache Spark is an open source cluster-computing framework that serves as a fast and general execution engine for large-scale data processing jobs that can be decomposed into stepwise tasks, which are distributed across a cluster of networked computers. Spark improves on previous MapReduce implementations by using resilient distributed datasets (RDDs), a distributed memory abstraction that lets programmers perform in-memory computations on large clusters in a fault-tolerant manner. See Spark Operations for more information.Connectors
Connectors are the out-of-the-box components for pulling your data into Fusion. Lucidworks provides a wide variety of connectors, each specialized for a particular data type. When you add a datasource to a collection, you specify the connector to use for ingesting data. Connectors are distributed separately from Fusion. For complete information, see Fusion Connectors. Fusion offers dozens of connectors so you can access your data from a large variety of sources. To learn more about Fusion connectors, see connectors concepts or the connectors section.Pipelines
Pipelines dictate how data flows through Fusion and becomes accessible by a search application. Fusion has two types of pipelines: index pipelines and query pipelines. Index pipelines ingest data, indexes it, and stores it in a format that is optimized for searching. Query pipelines filter, transform, and augment Solr queries and responses to return all and only the most relevant search results.How-to information
Want to start right away? See our 4-part Getting Started with Fusion tutorial below for detailed instructions.Part 1: Run Fusion and Create an App
Part 1: Run Fusion and Create an App
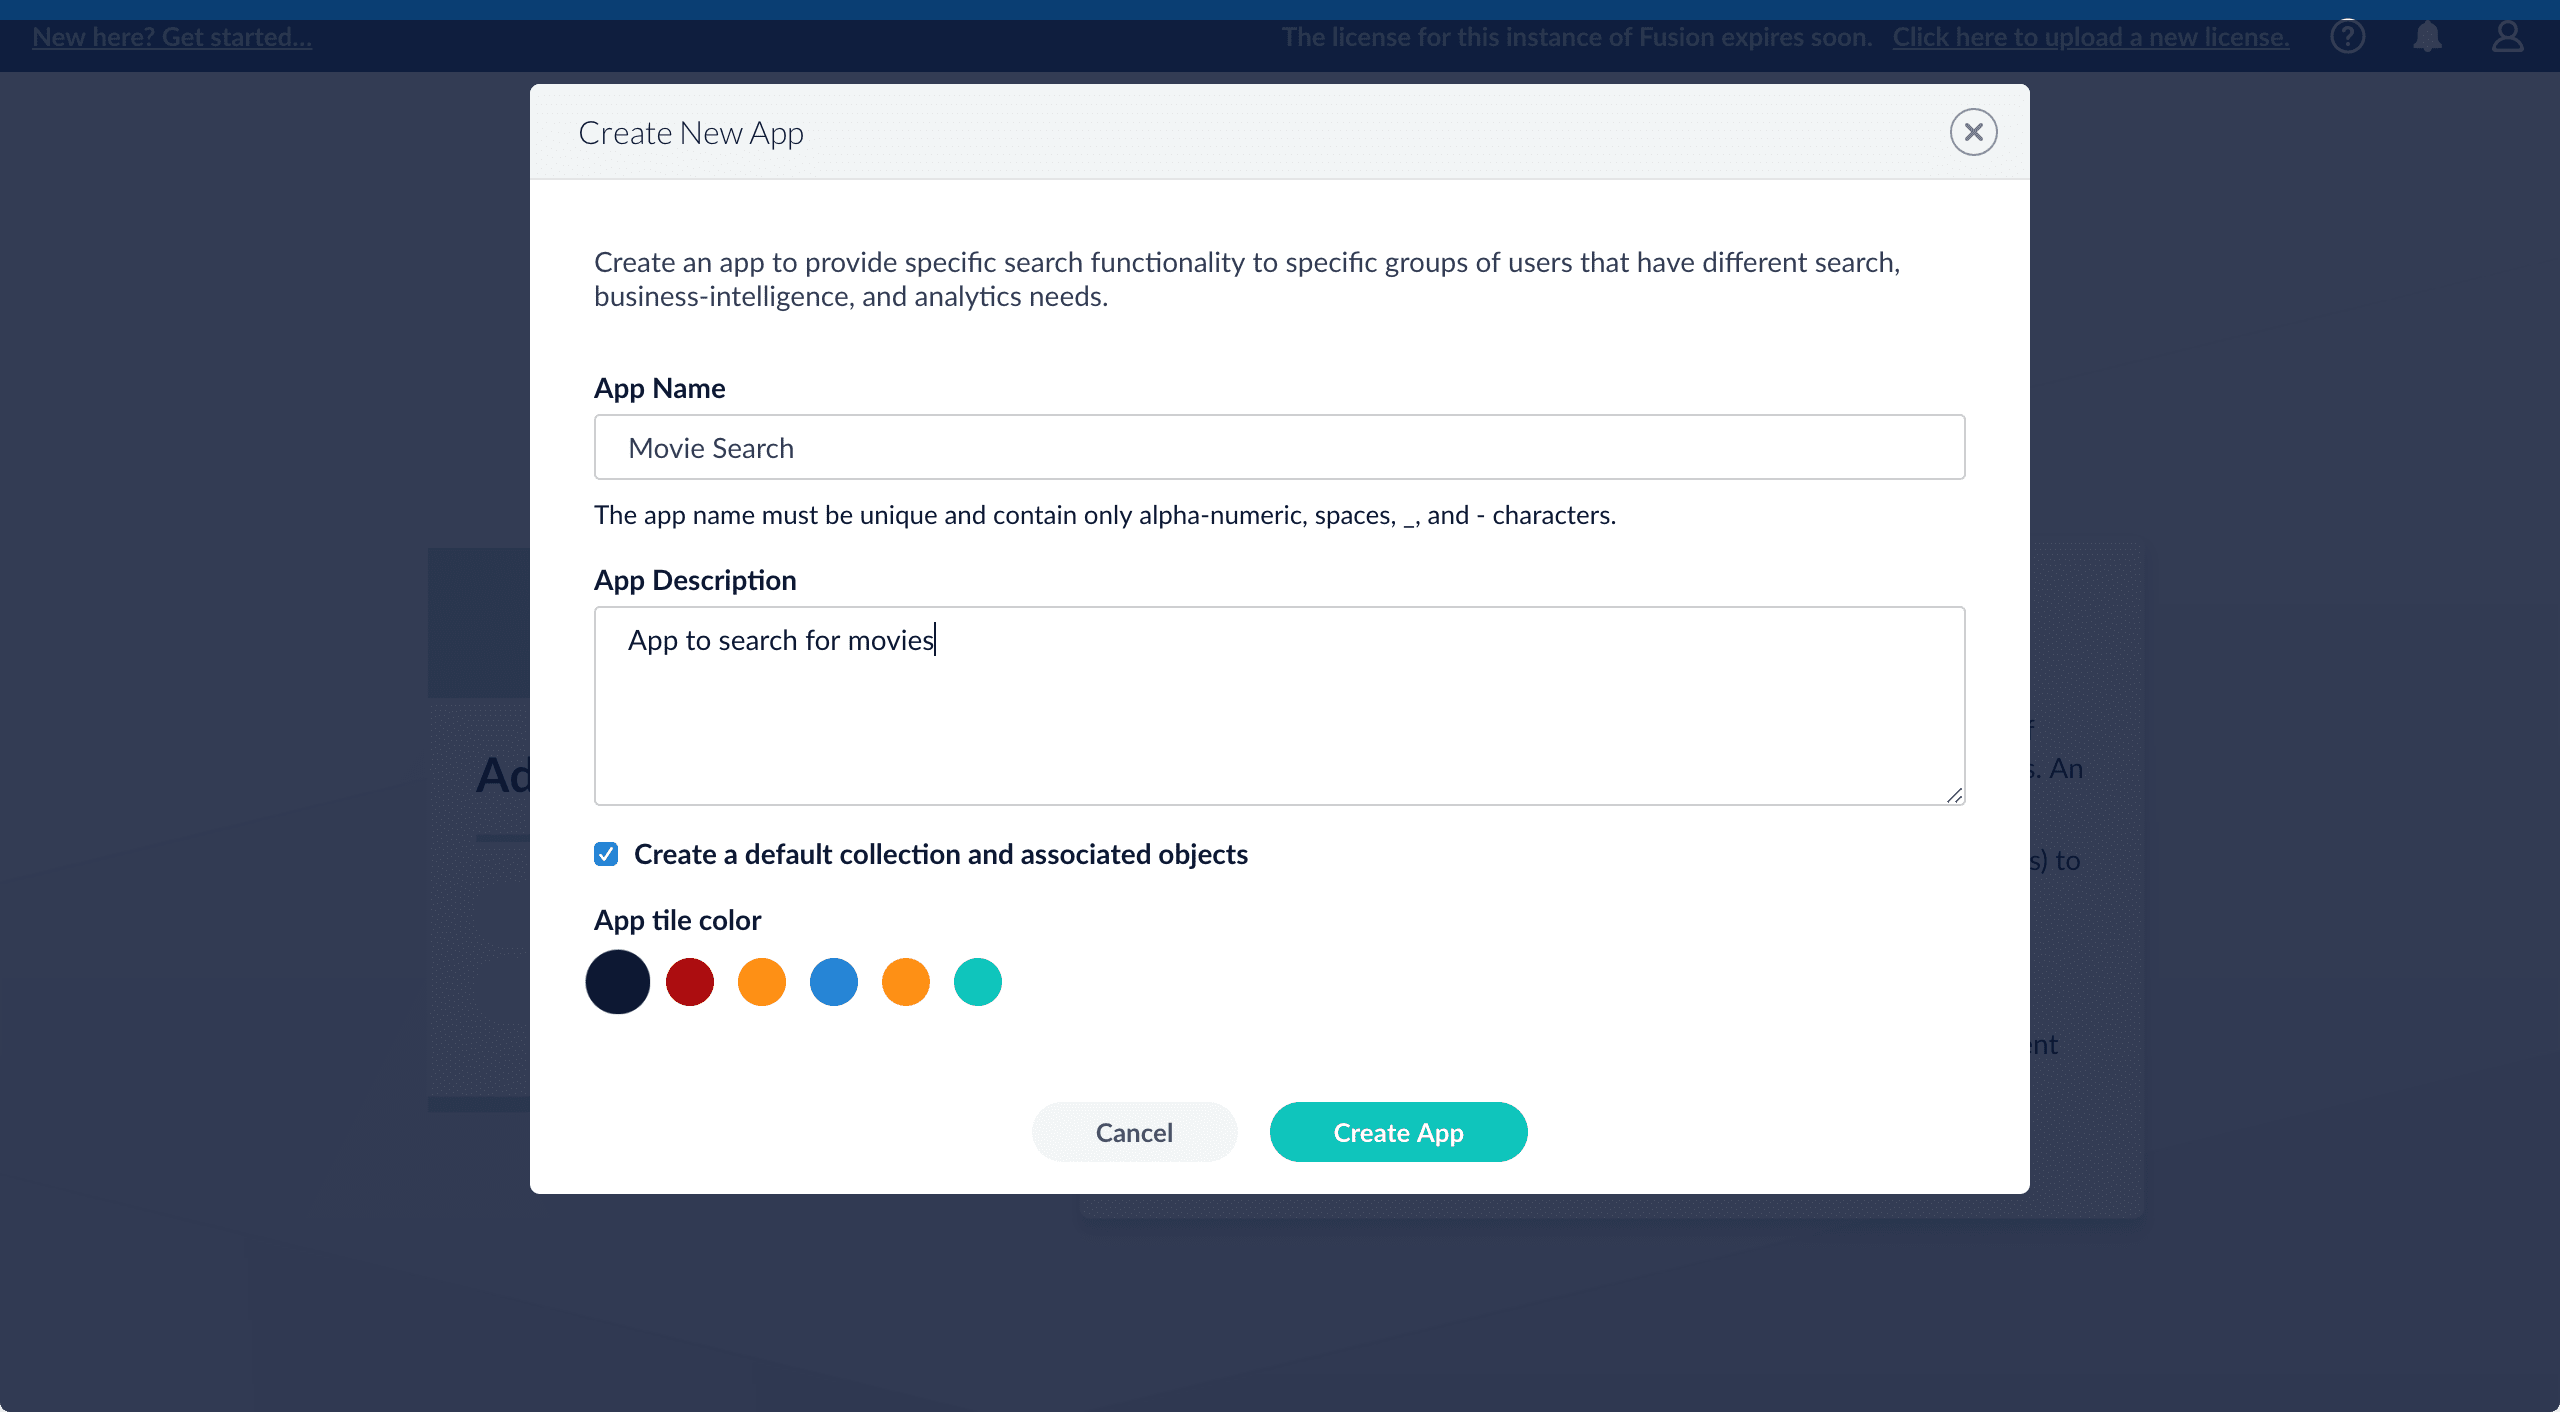
Create an app
Create a Movie Search app. An app is a set of Fusion objects that performs a specific searching task (such as searching for movies).- In the Fusion launcher, click Create new app.
-
In the App Name field, enter
Movie Search. -
In the App Description field, enter
App to search for movies. -
Click Create App.
Next steps
You now have the MovieLens dataset from which you will use a CSV file that contains data about movies. And you have a Fusion app that you will transform into a movie search app.In Part 2, you will use Index Workbench to get the MovieLens dataset into Fusion.Part 2: Get Data In
Part 2: Get Data In
Fusion’s Index Workbench provides the tools to configure datasources, parsers, and index pipelines. It lets you preview the results of indexing before you load your data into the actual index.Index Workbench first sets up the necessary data extraction configuration, and then retrieves a small number of documents as sample data. You can use the sample documents to test and refine your index pipeline. All processing is simulated processing of the test data. No actual data ingestion takes place.After you have a complete configuration, Index Workbench saves this as a Fusion datasource.
To load your data into Fusion, use the Fusion Datasource tool to run the resulting configuration.Part 2 takes you through configuring a datasource using Index Workbench. In Part 3, you will load the data into Fusion and view it using Query Workbench.
In Part 3, you will use Query Workbench to get search results from your collection and configure the query pipeline that customizes those results. You will add faceting using the
Before you begin
To proceed with this part of the tutorial, you must first complete Part 1, which gives you a Fusion app.Download the MovieLens dataset
- Download the dataset. This is a MovieLens dataset created by the Grouplens research lab.
-
Unpack the
ml-latest-small.zipfile. Fusion can parse.zipfiles, but for simplicity we will index just one file from the archive (movies.csv).
movies.csv file contains a list of 9,125 movie titles, plus a header row. Here is a truncated listing:Open the Movie Search app
- If the Fusion UI is not already open, then open it.
-
Enter the password for the user
admin, and then click Log in.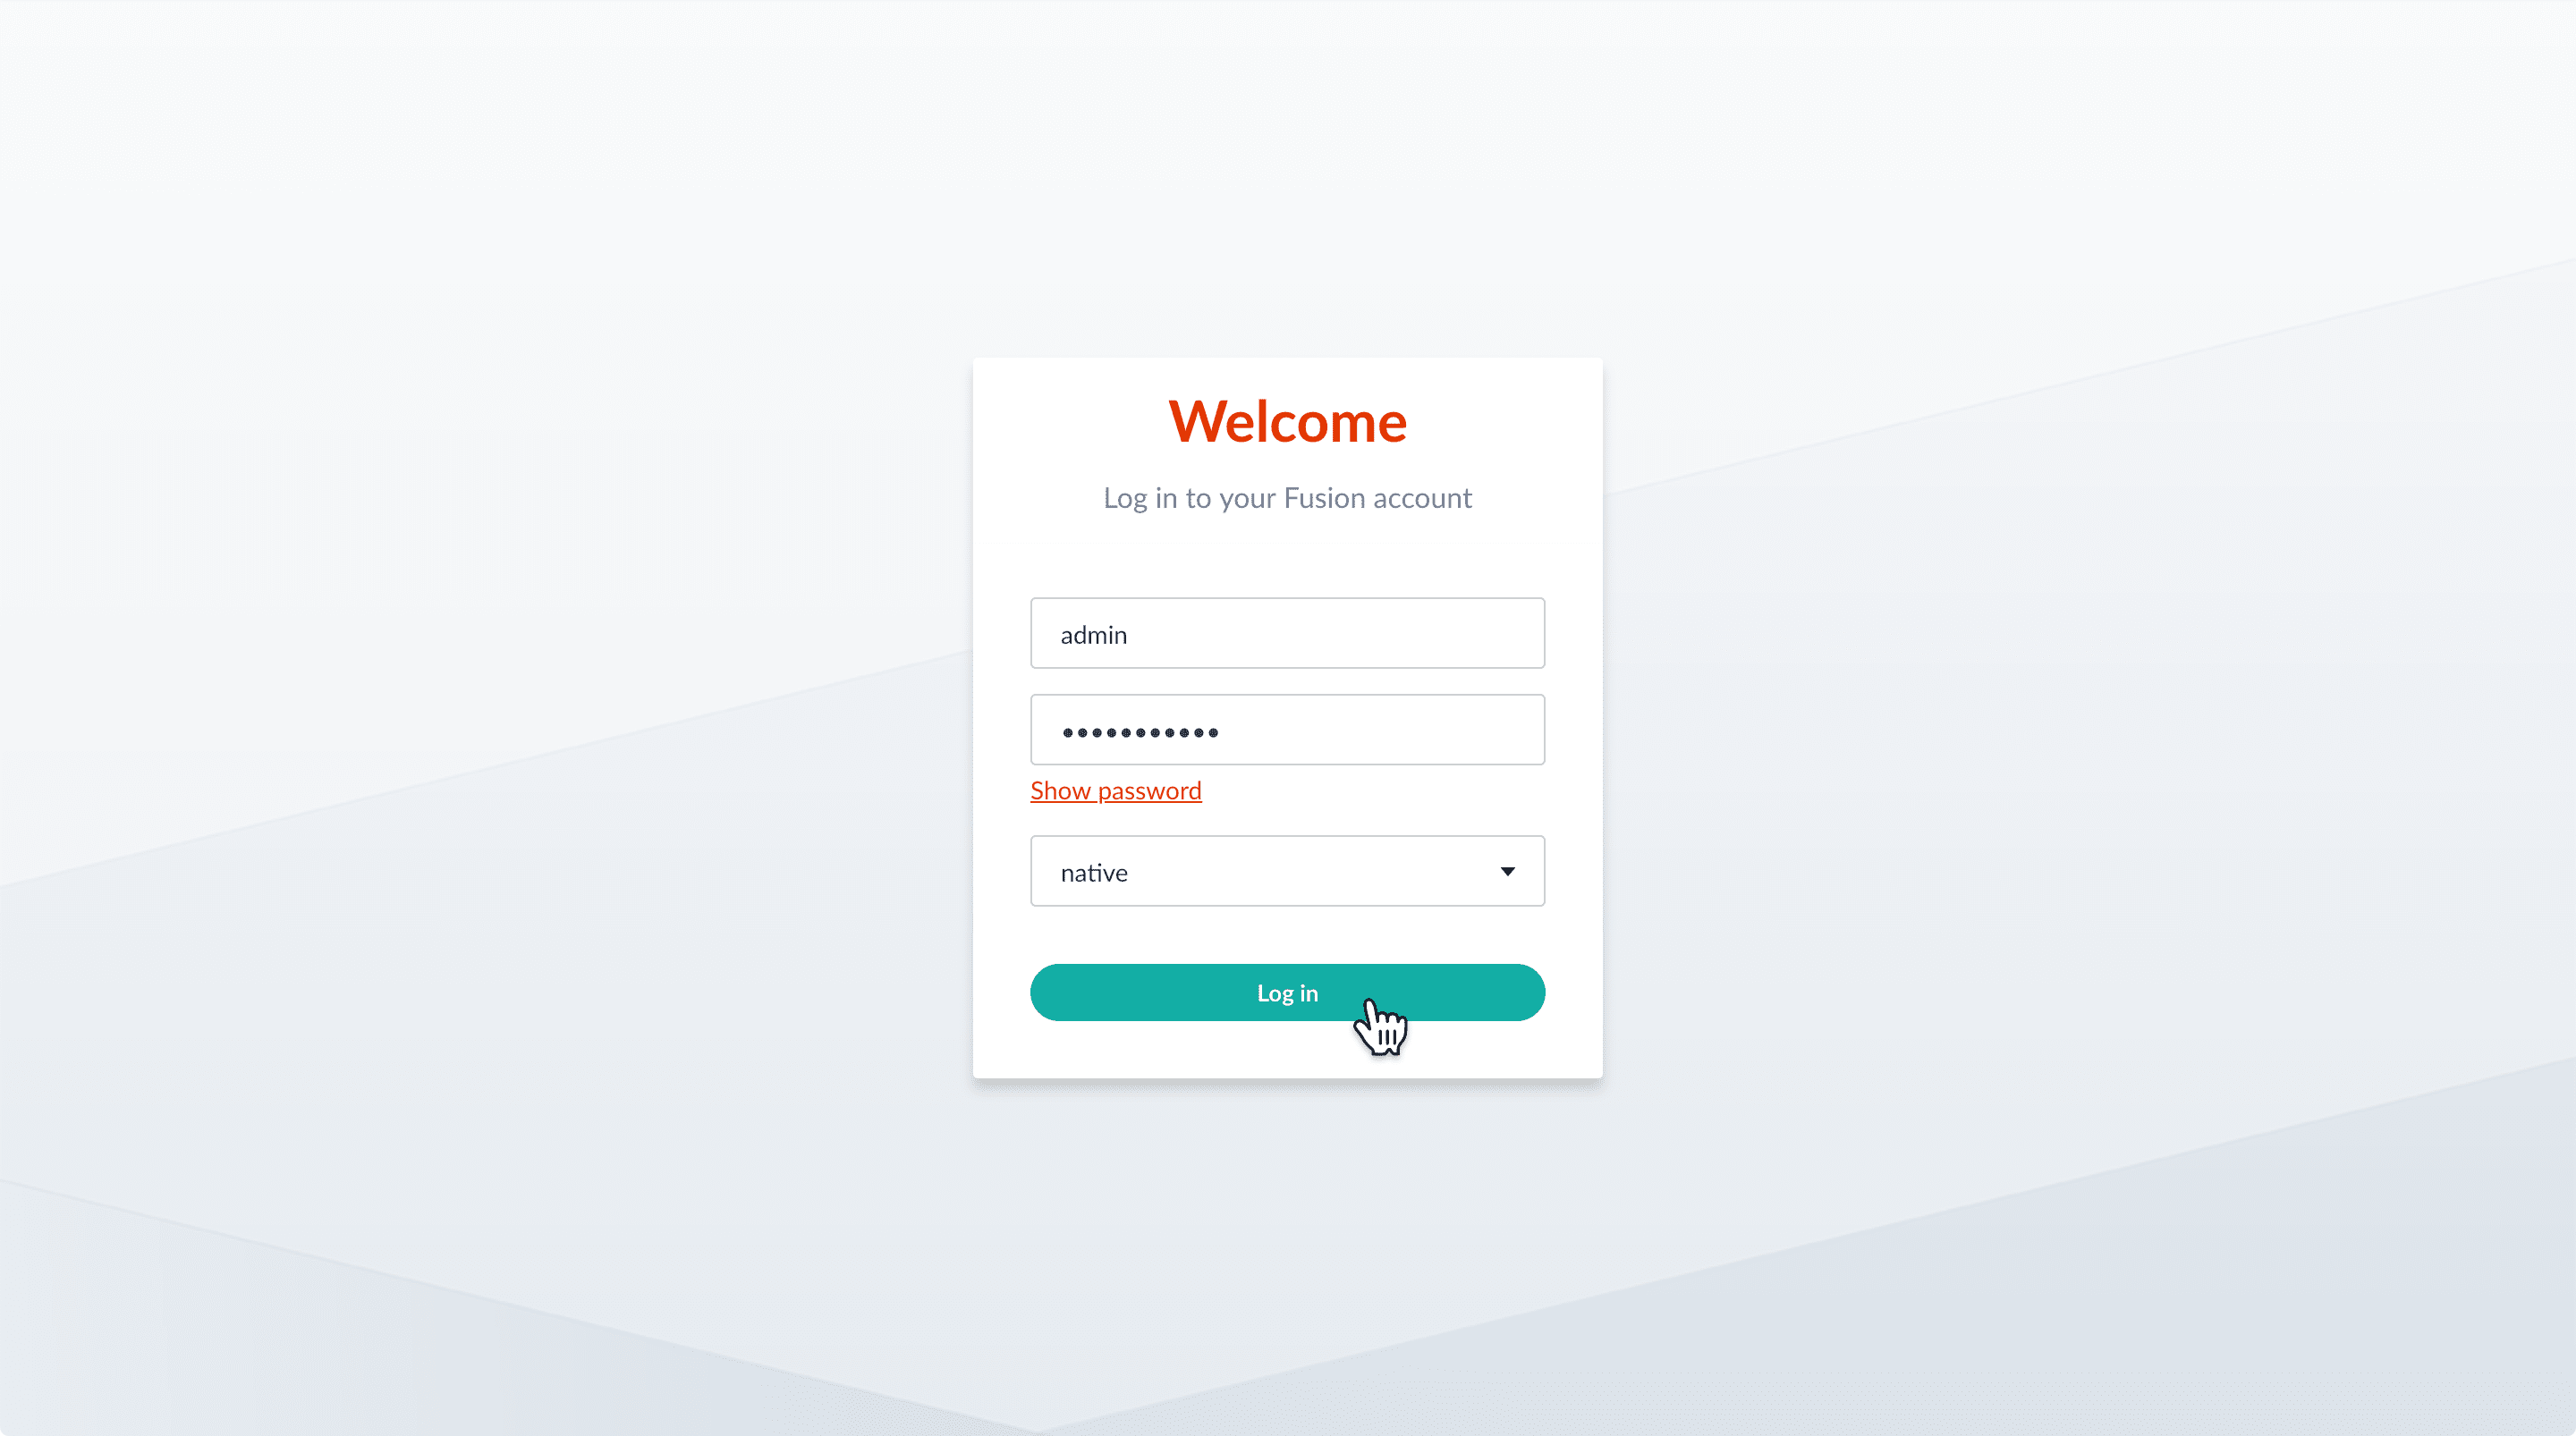
-
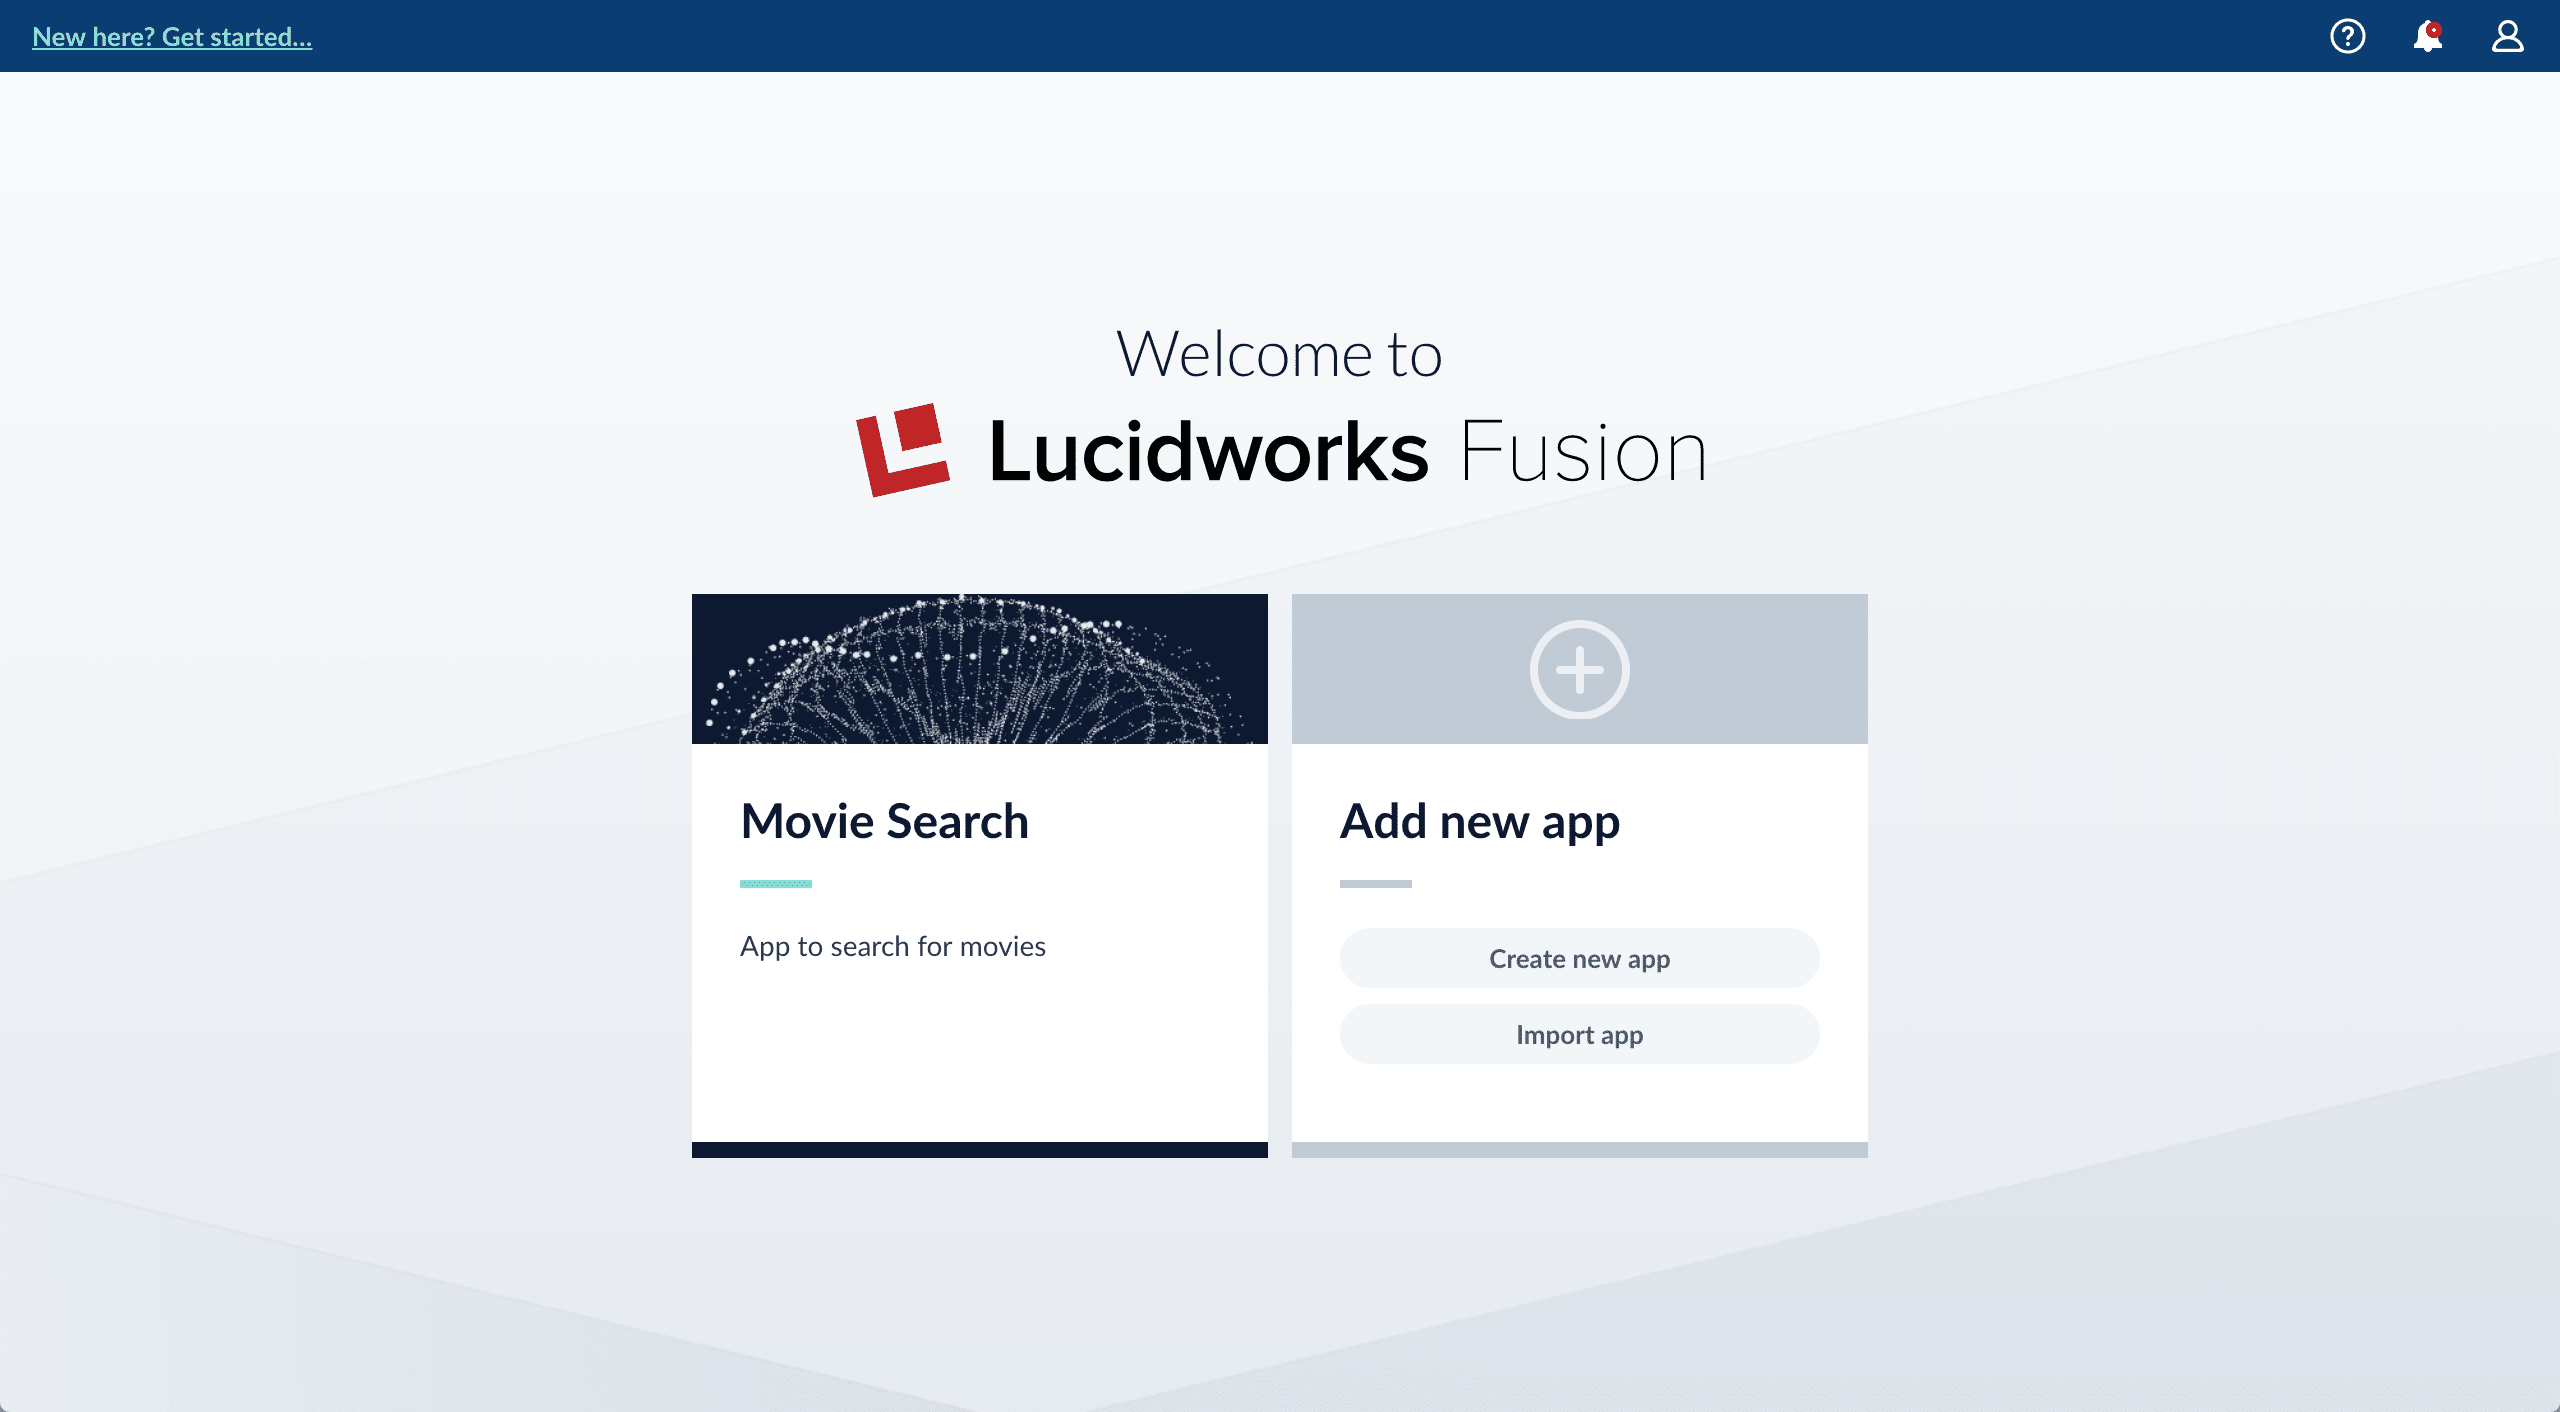
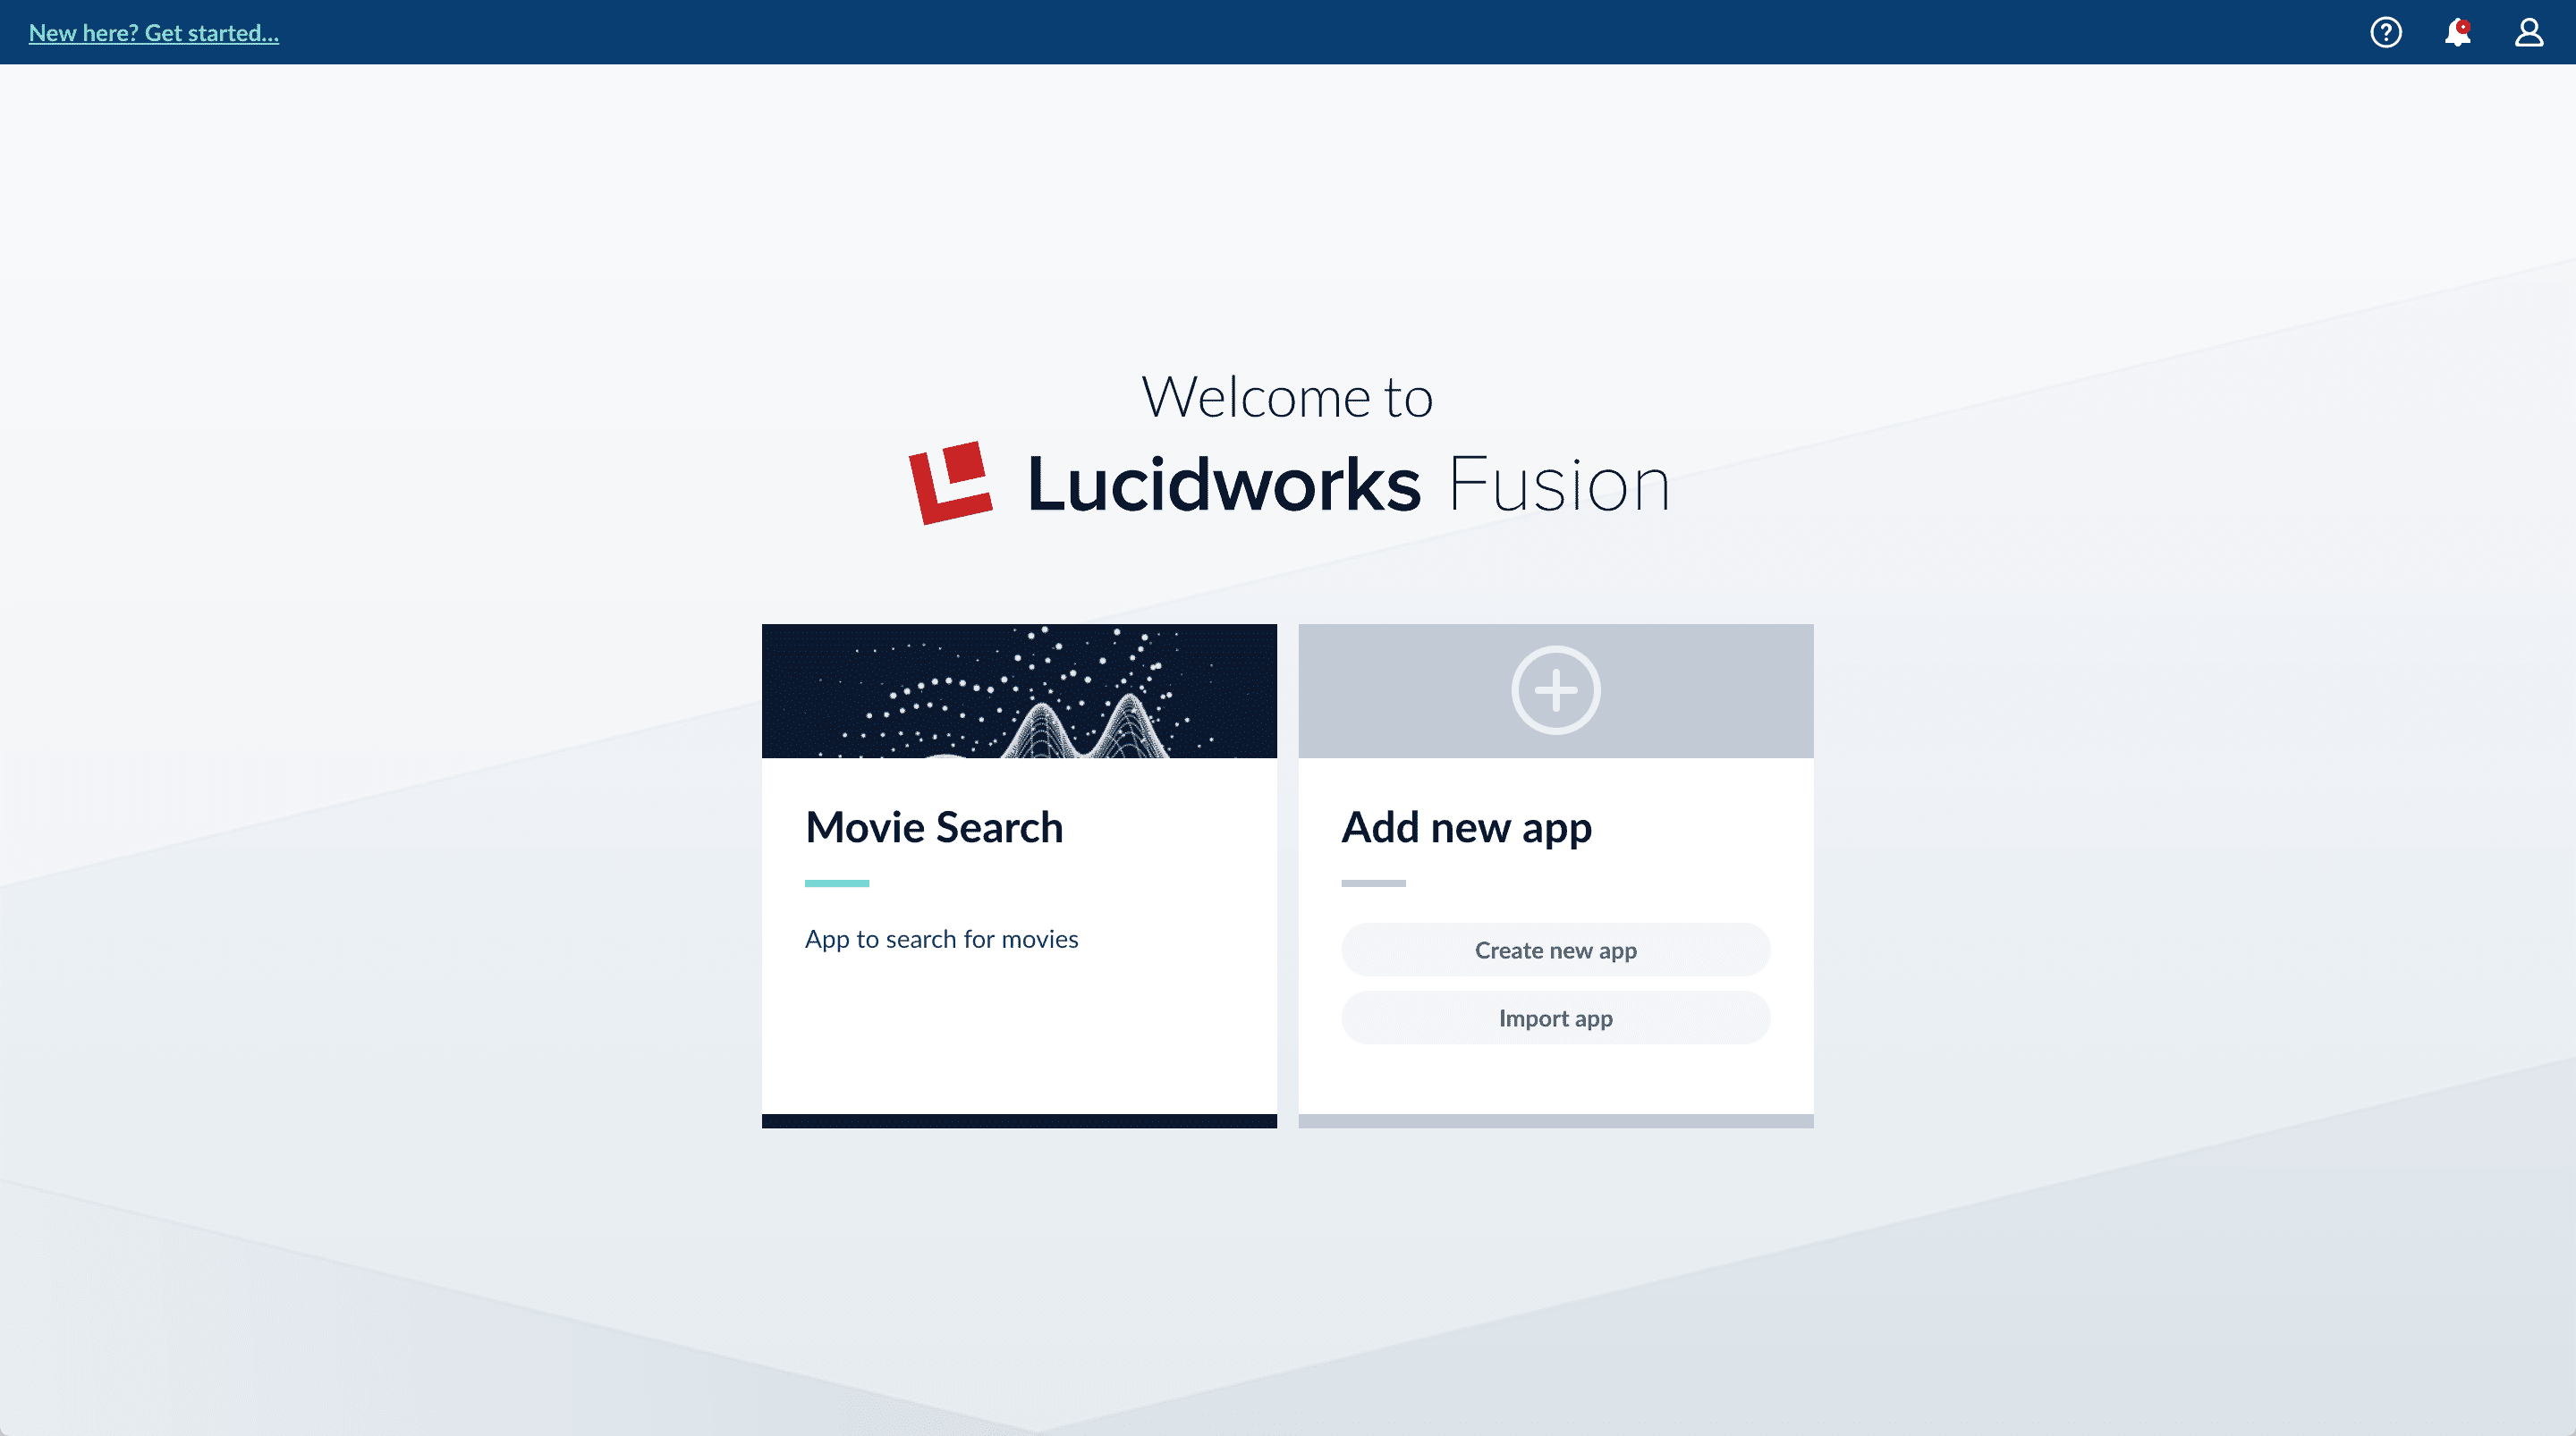
In the Fusion launcher, click the Movie Search app.
The Fusion workspace appears. It has controls along the left and top sides.
-
In the upper left, hover over Apps . You can see that Movie Search is the currently selected app.
Also, the user collection
Movie_Searchis selected in the collection picker. This is the default collection for the Movie Search app, and where Fusion will place index data.
Configure the datasource
A collection includes one or more datasources. A datasource is a configuration that manages the import, parsing, and indexing of data into a collection. You will use Index Workbench to configure a datasource for the movie data.-
In the collection picker, verify that the collection Movie_Search is selected.

- Open Index Workbench. Navigate to Indexing > Index Workbench. Initially, no data preview appears because no datasource has been configured. When you configure a datasource, Fusion samples the data and displays a preview of how it would be formatted in the index using the default parsing and index pipeline configurations.
- In the upper right, click New.
- Select Or, upload a file.
- Click Choose File.
-
Navigate to the
movies.csvfile, select it, and then click Open.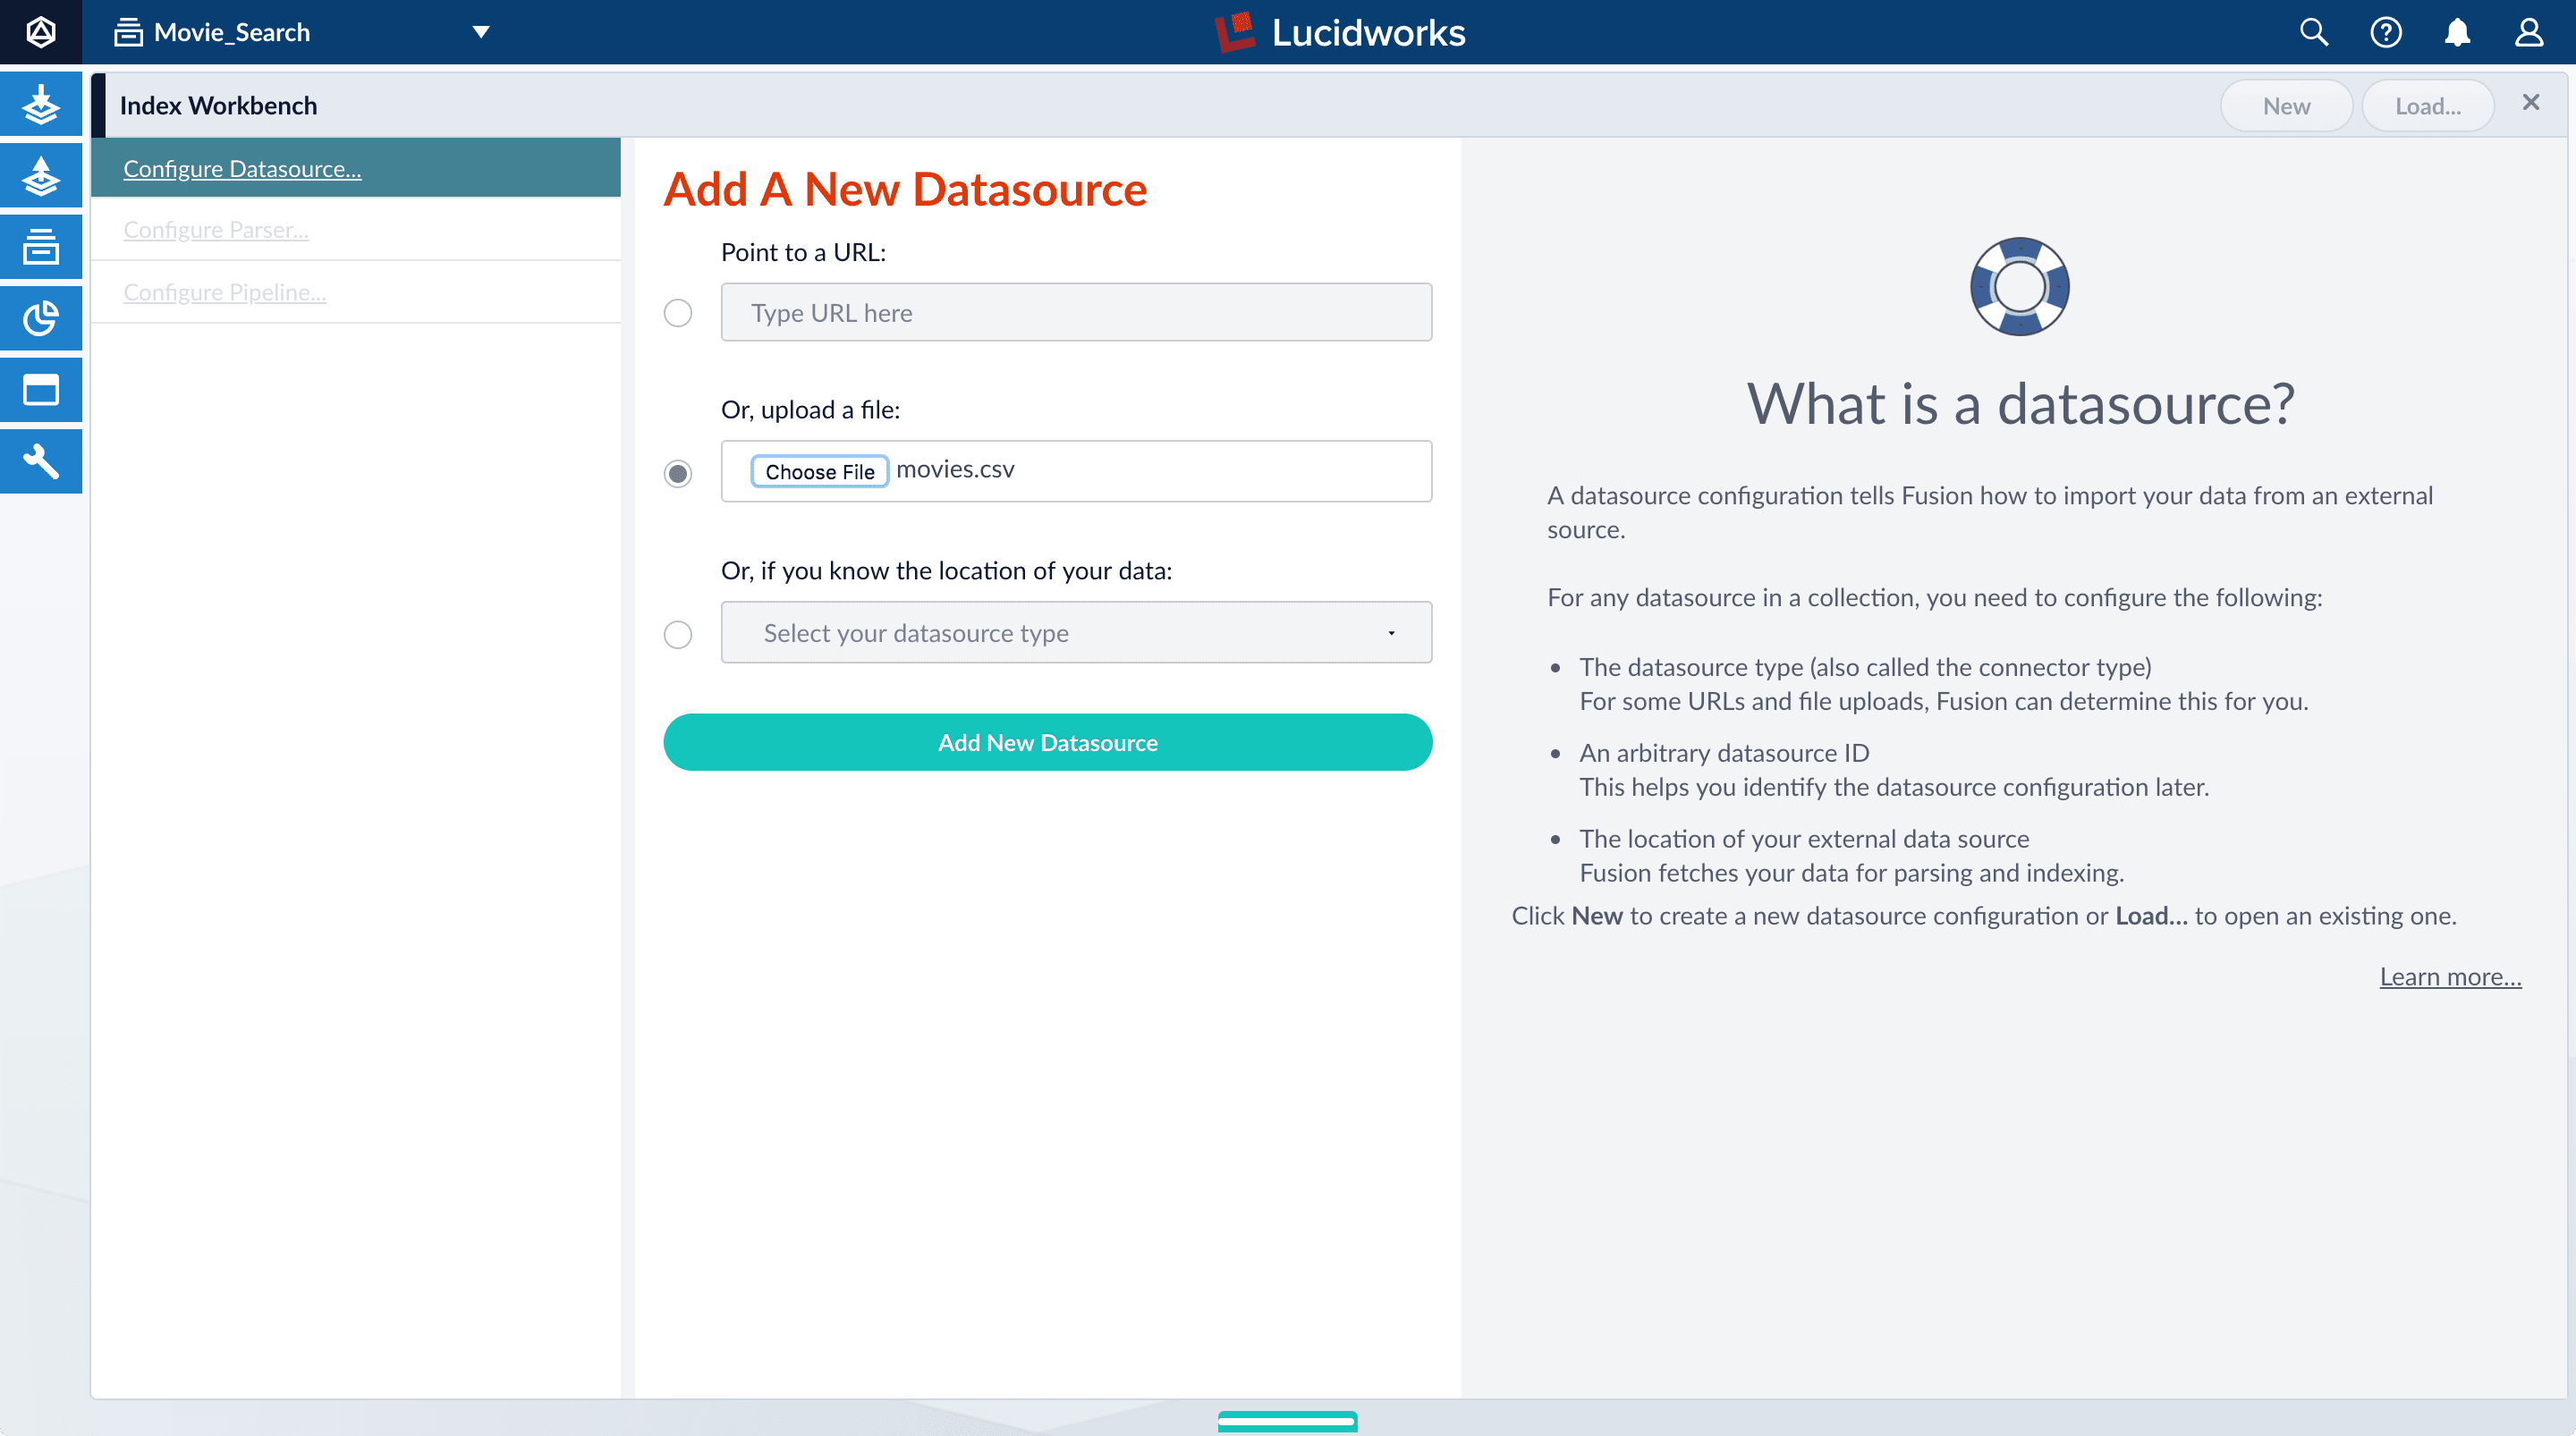
-
Click Add New Datasource.
The Datasource (File Upload) configuration panel appears, with the default datasource ID
movies_csv-Movie_Searchand the default file IDmovies.csv. These default values are fine. -
Enter the Description
Movies CSV file.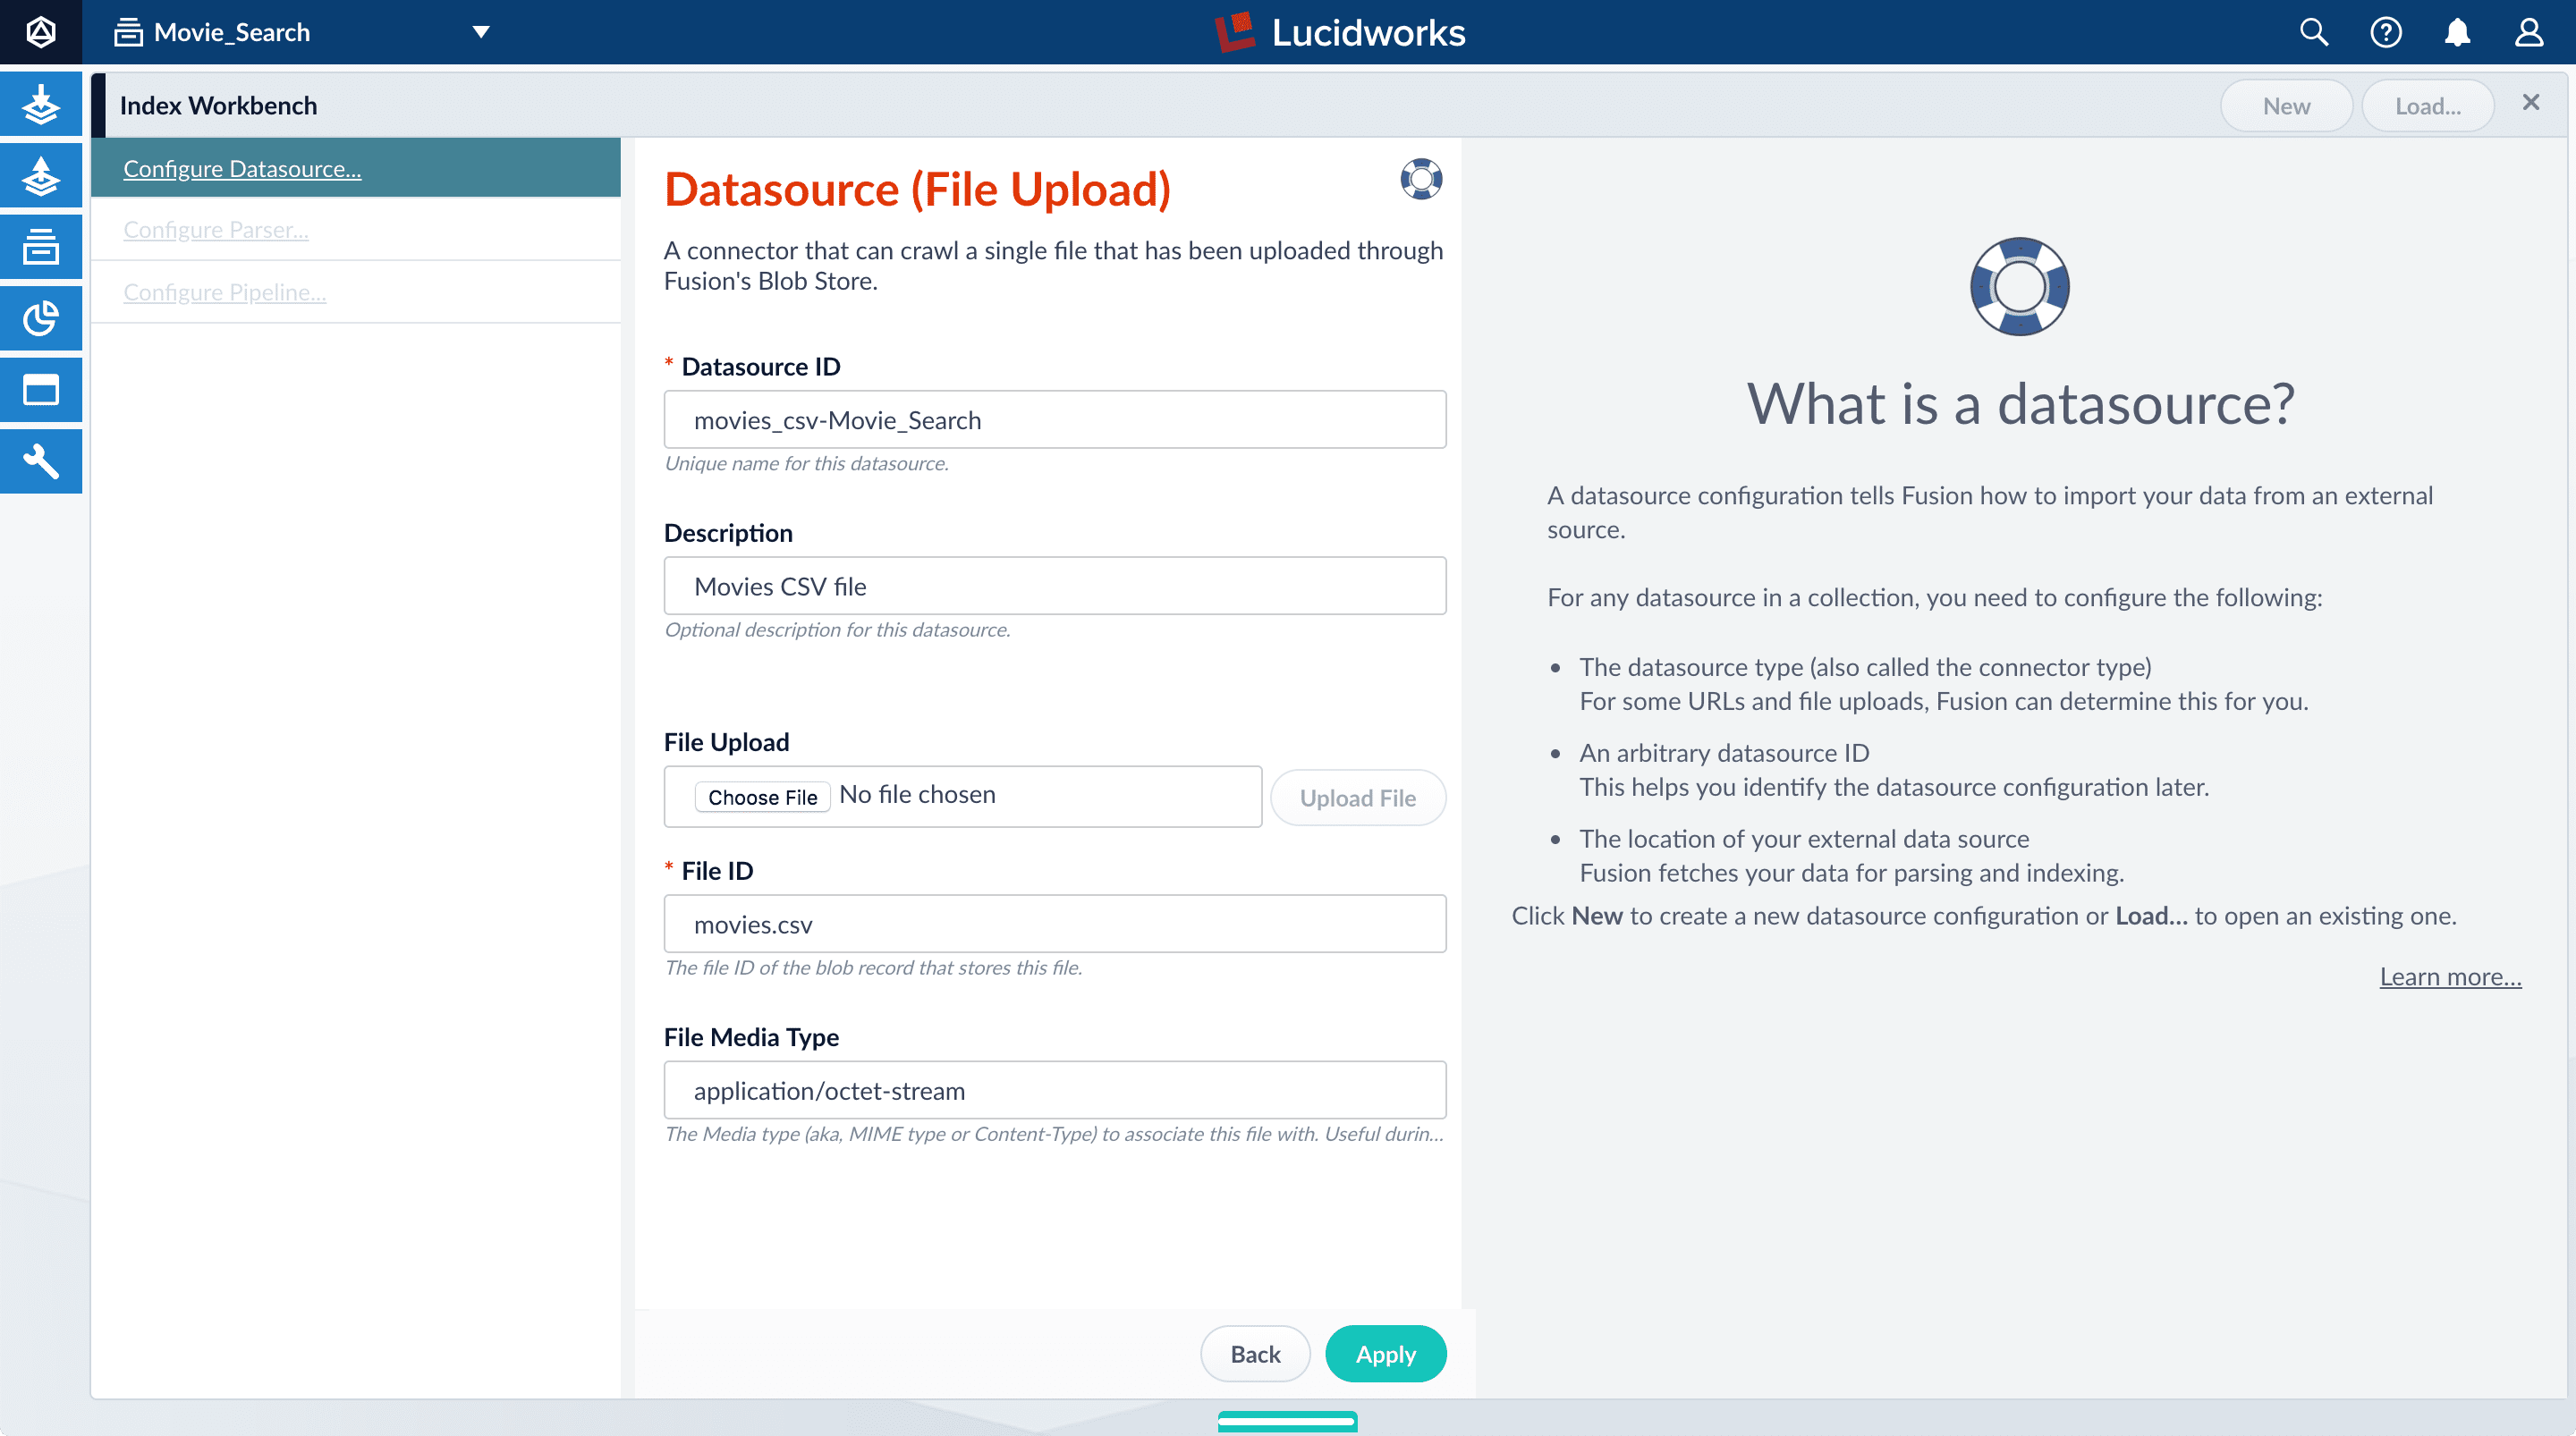
-
Click Apply.
Index Workbench reads up to 20 documents into memory from the
movies.csvfile, and then displays a preview of how they would be indexed. You have finished configuring the datasource. At the bottom of the page, click Cancel.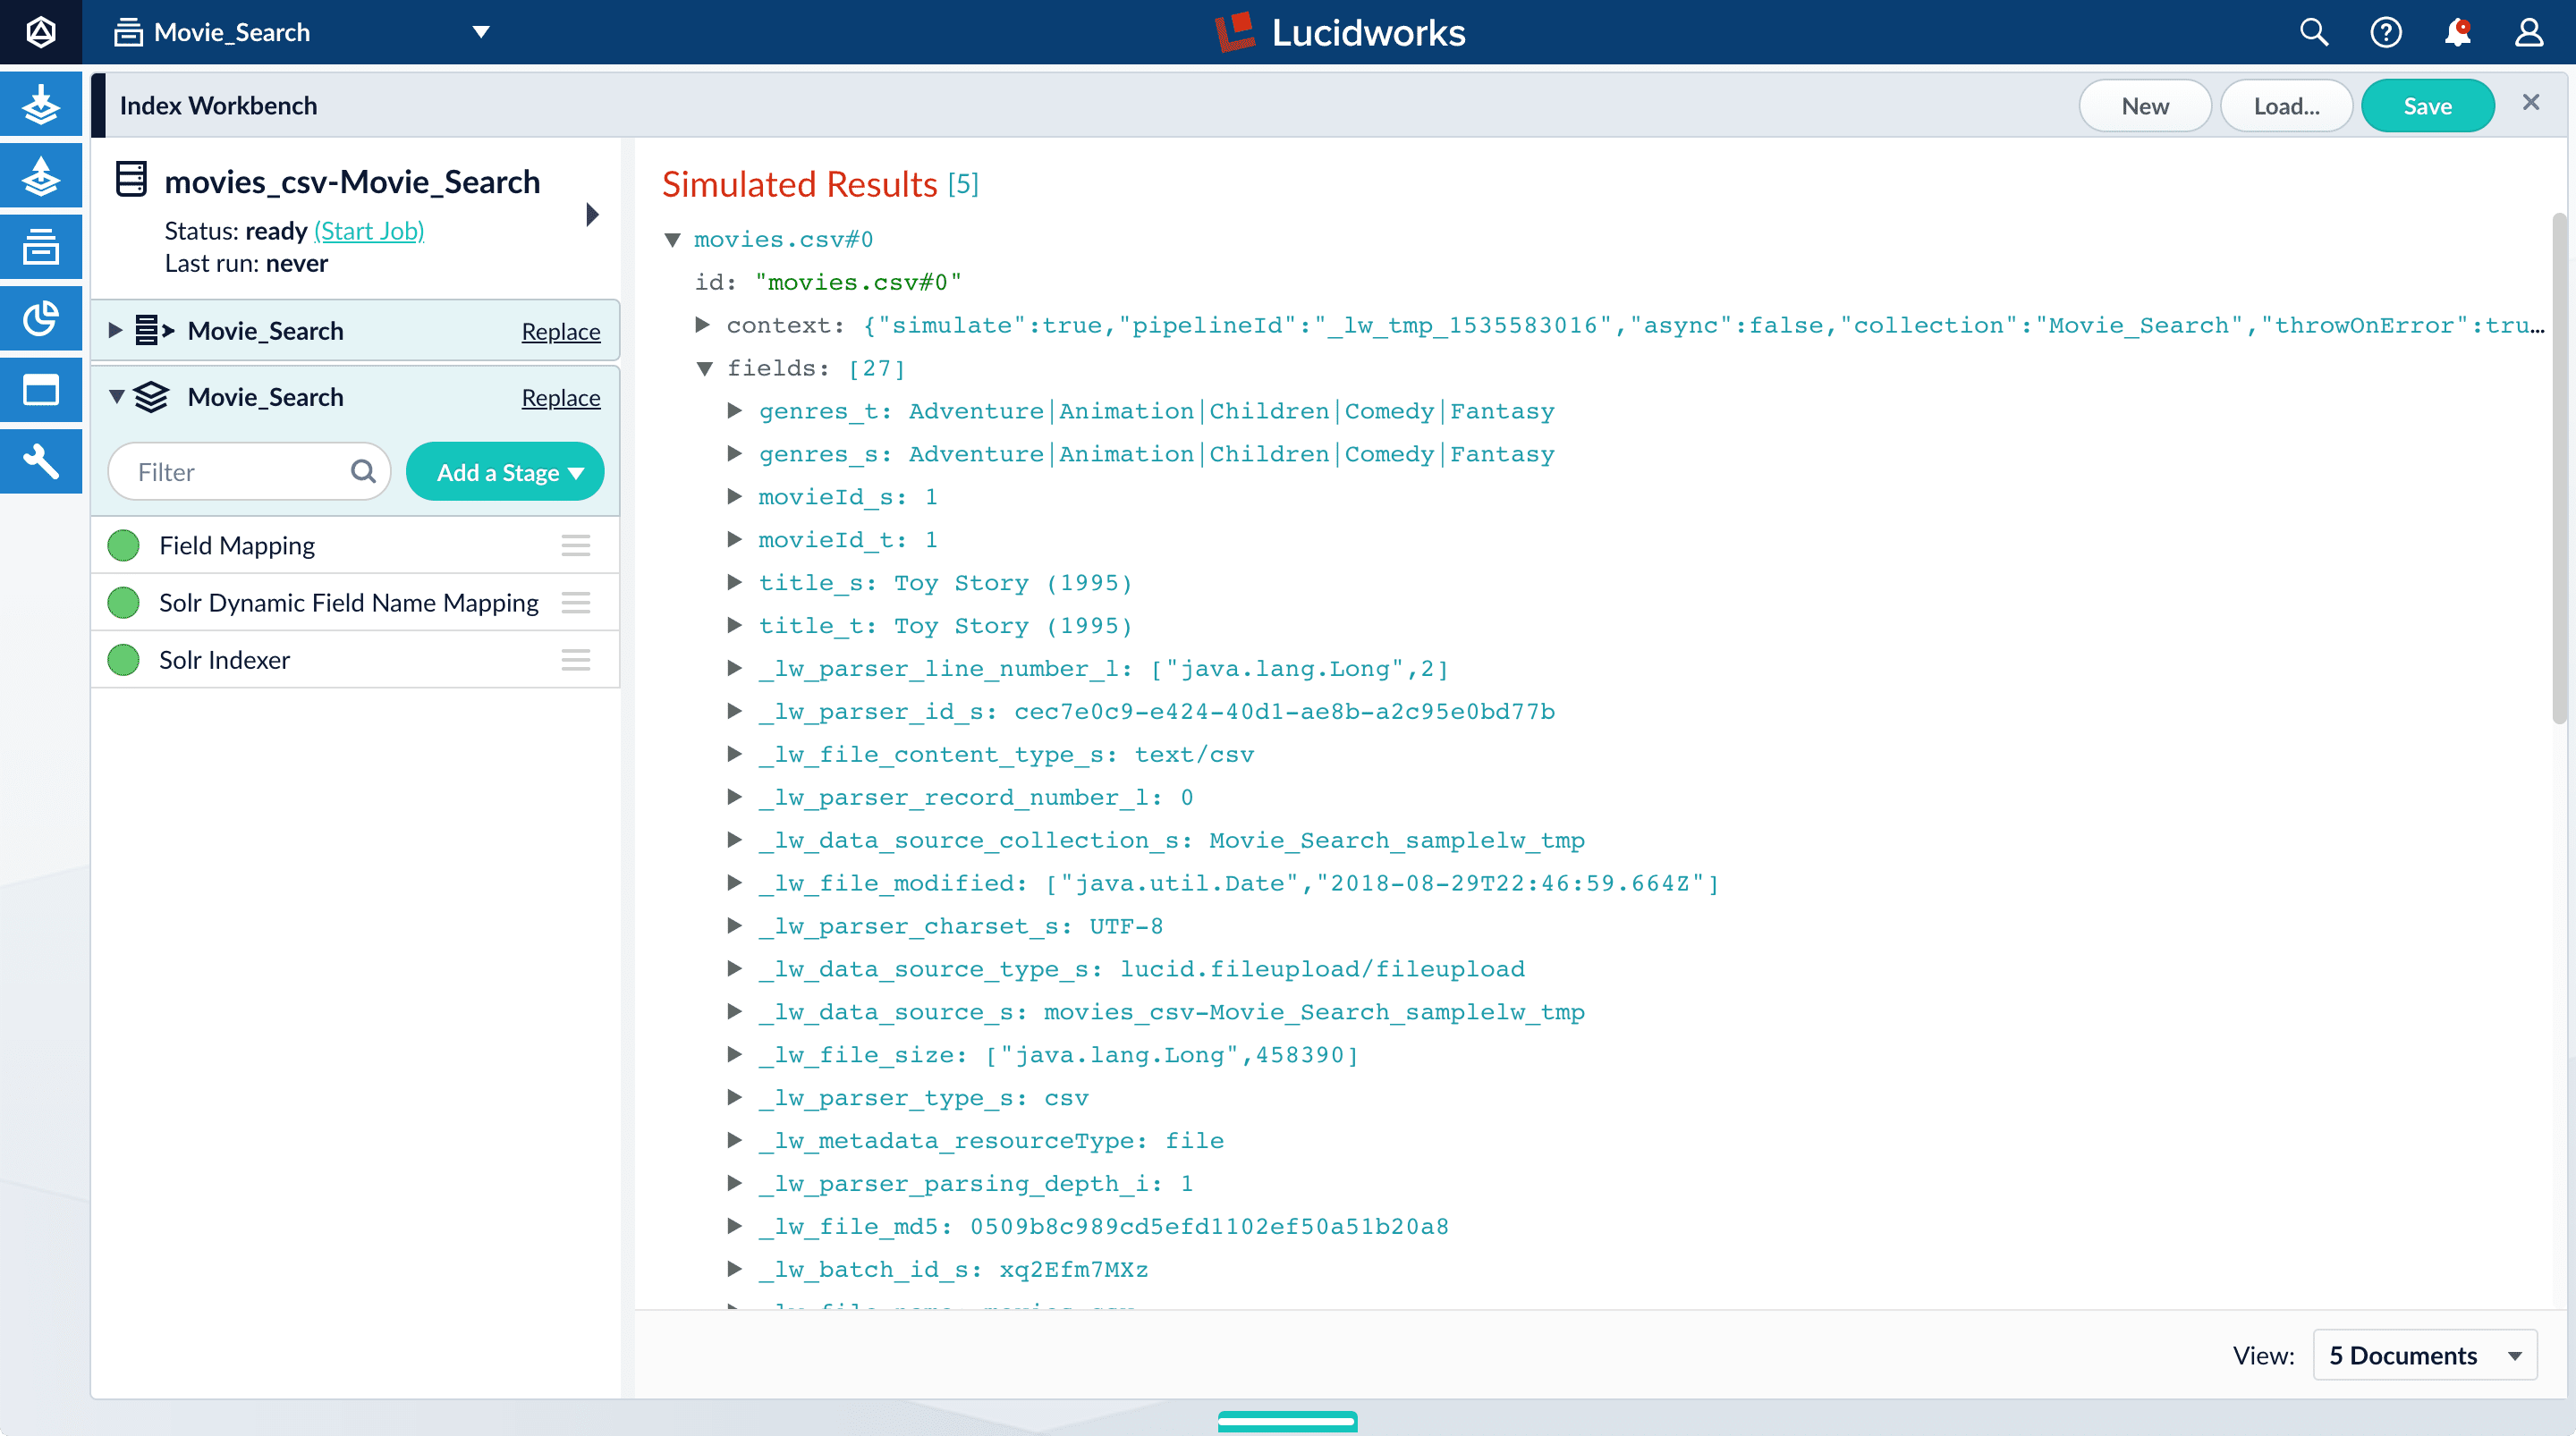
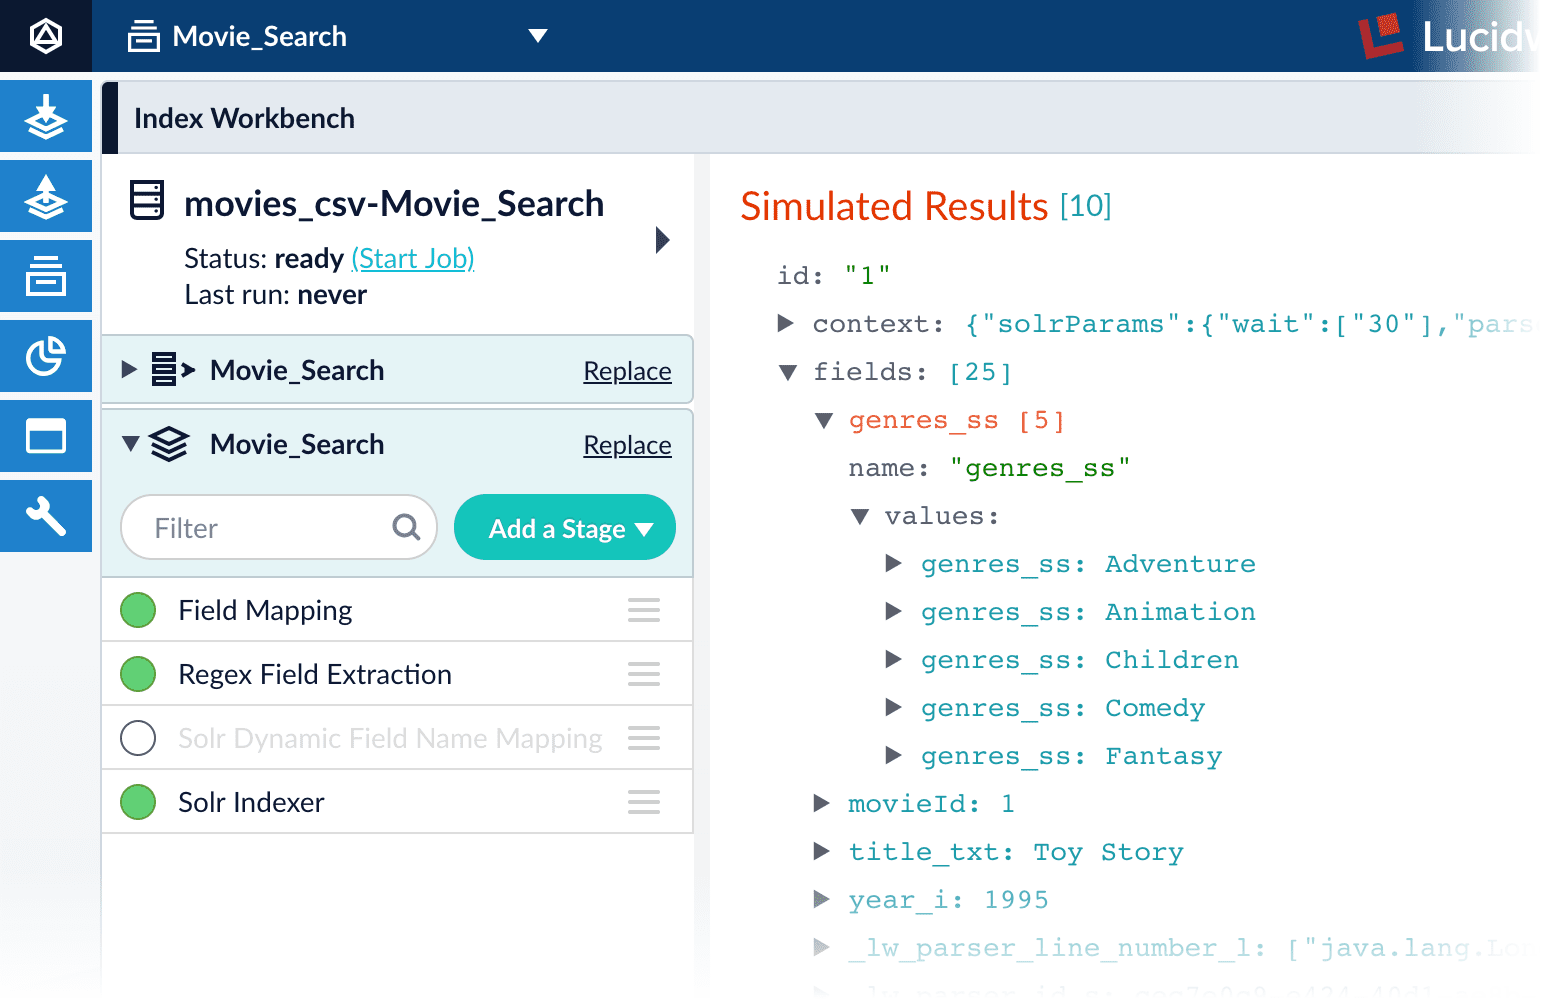
Analyze the default output
-
Notice that Fusion made some assumptions about your original fields:
genresbecamegenres_t(thetext_generalfield type) andgenres_s(thestringfield type). String fields are useful for faceting and sorting, while text fields are for full-text search. At this point, Fusion does not know whether you intend to use this field for faceting and sorting, for full-text search, or for both.titlebecametitle_tandtitle_sfor the same reason.movieIdbecamemovieId_tandmovieId_sfor the same reason. This might seem odd, because the original field contains numbers. But, at this stage, Fusion createstext_generalandstringfields. To use the contents of this field as an integer, you would map the field to an integer field.
_lw. These fields contain data that Fusion creates for its own housekeeping. You can ignore them. These fields are created by the Solr Dynamic Field Name Mapping stage in the default index pipeline. This stage attempts to automatically detect field types, and renames fields accordingly. For this tutorial, you will manually configure the fields instead. -
Turn off the Solr Dynamic Field Name Mapping stage by clicking the green circle next to it.
Your data’s original fields reappear:
genres,movieId, andtitle.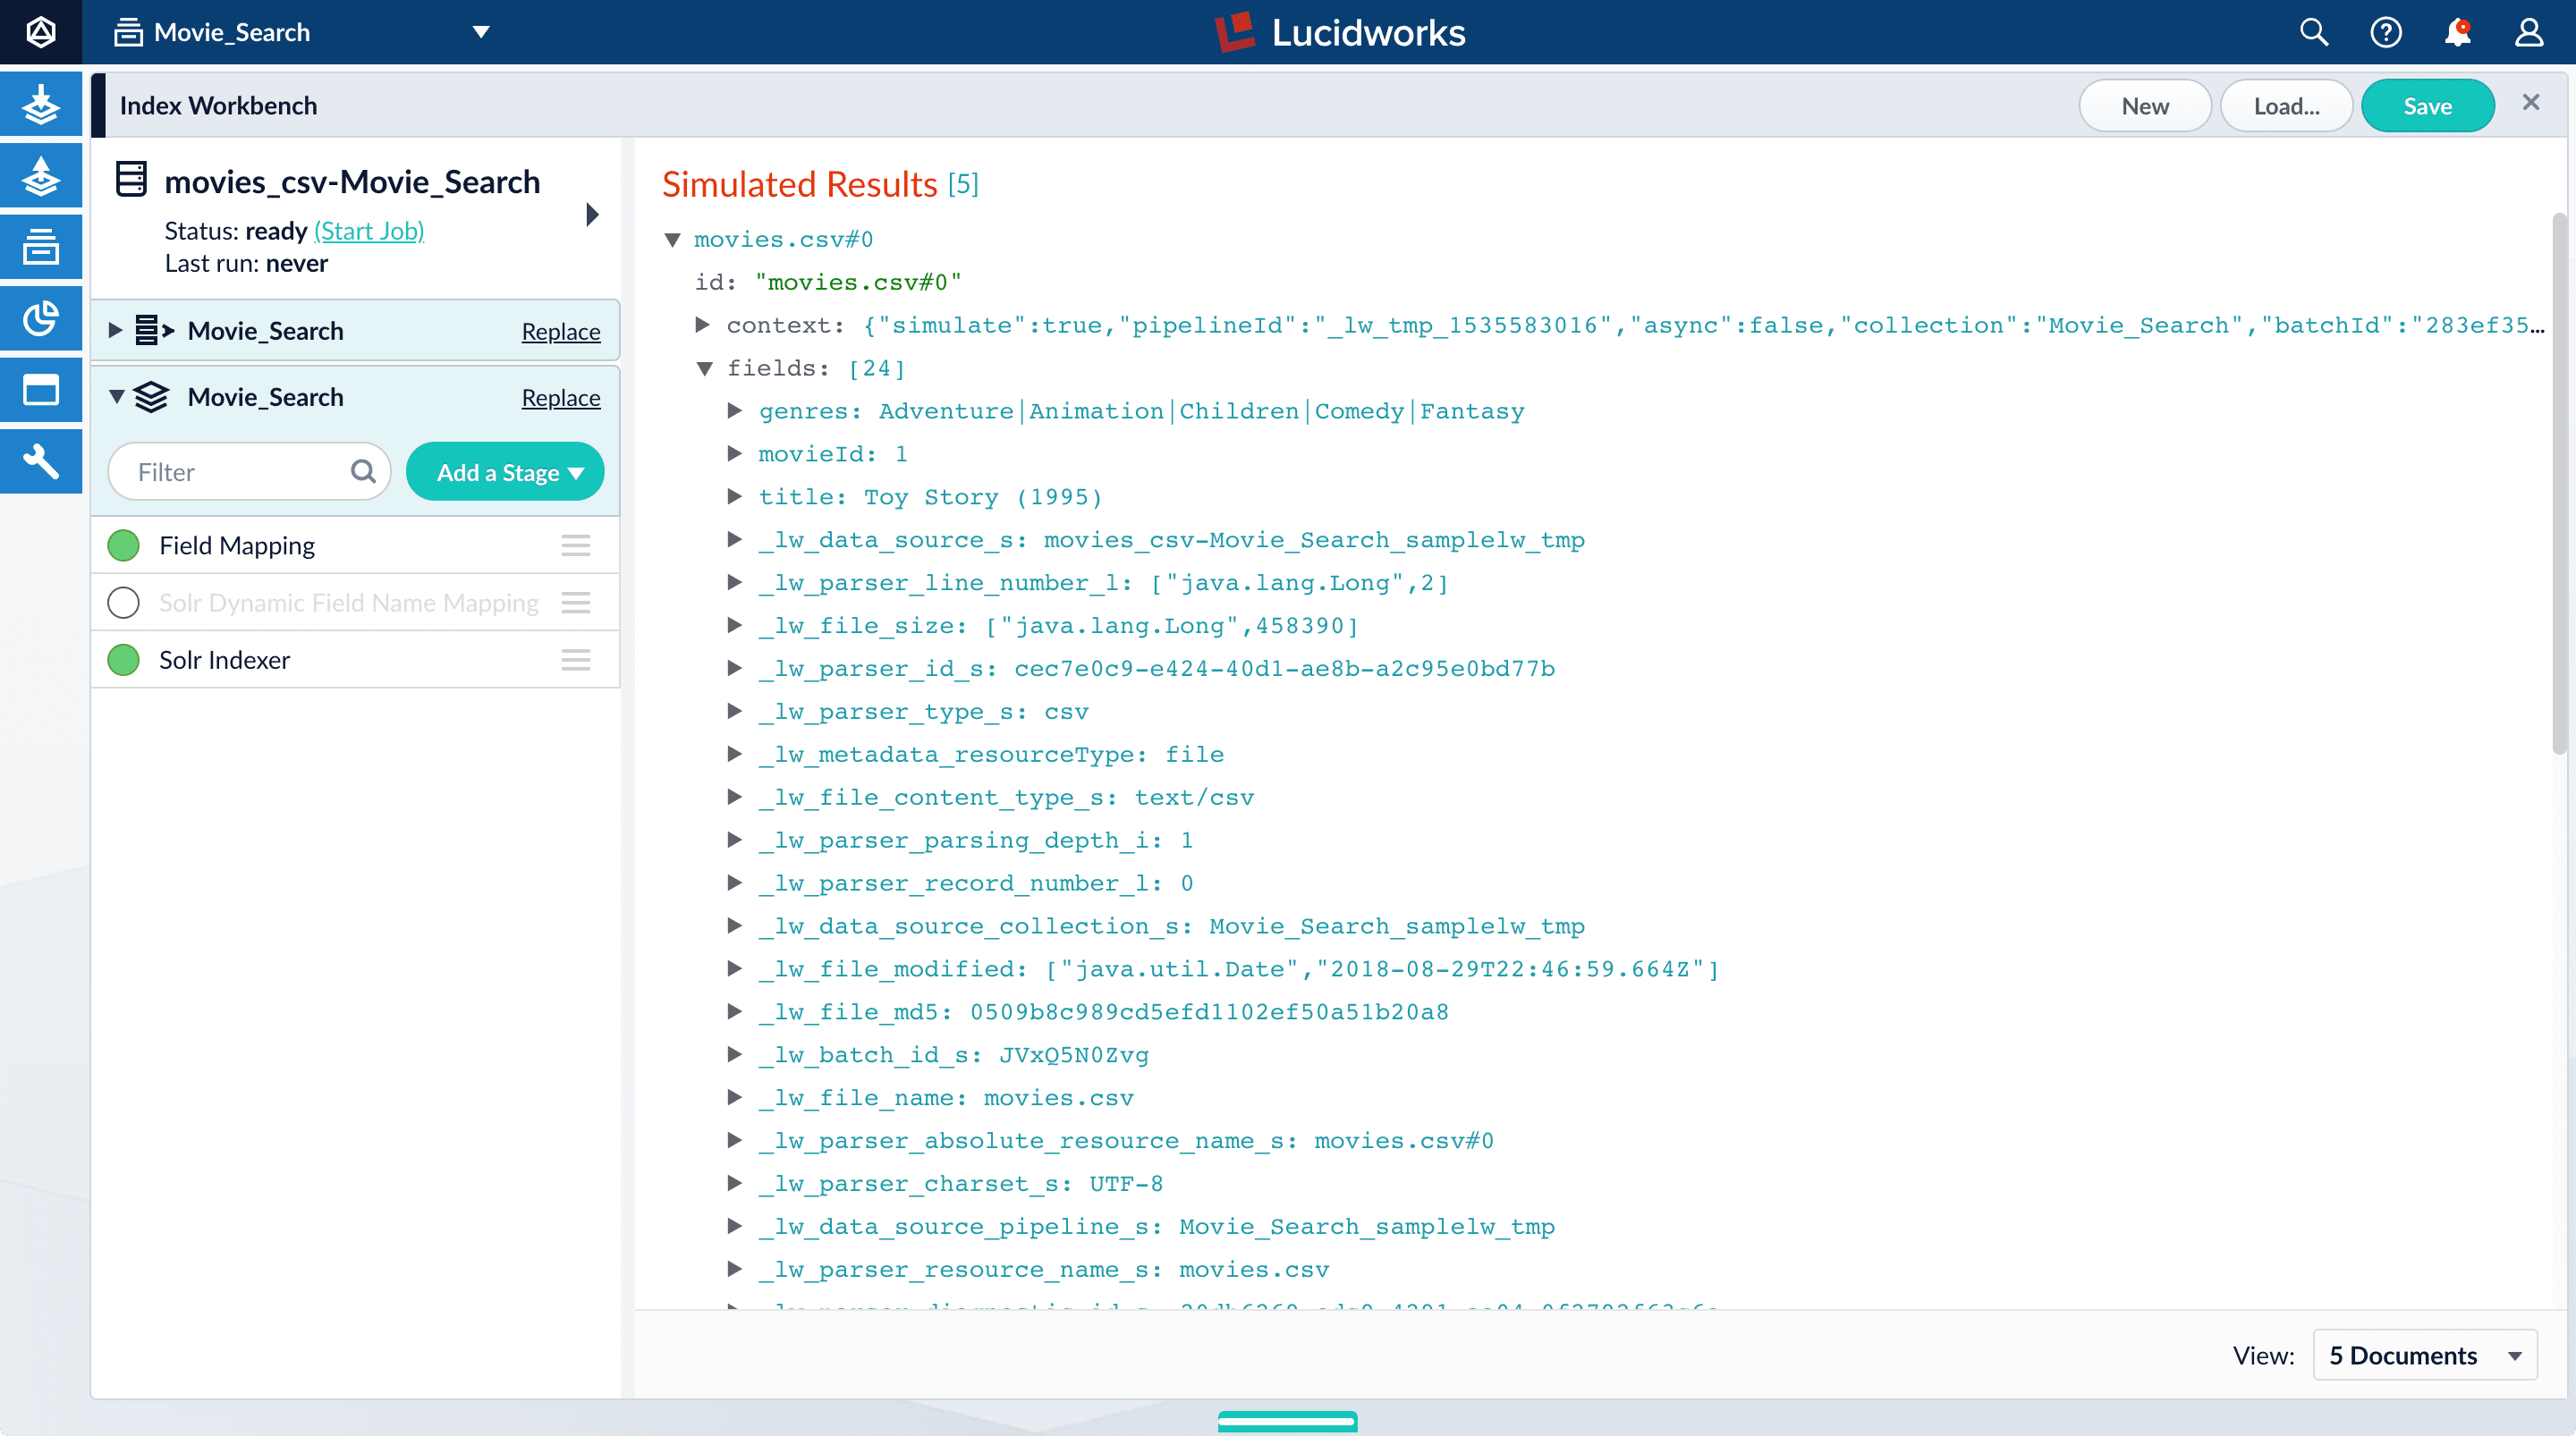
Configure the index pipeline
First you will configure the field mappings in the index pipeline so each field has the correct data type. Then you will split thegenres field into multiple values so each value can be used as a facet in Part 3 of this tutorial.Configure field mappings
Configure field mappings to control the field types of Fusion documents. Fusion uses field name suffixes to determine field types. When a field name has no suffix, Fusion stores it as a string field and treats it as an unanalyzed whole. For precise analysis and search, most fields need suffixes to indicate their specific types. You will see how this relates to the fields in the dataset.- In the list of index pipeline stages on the left, click Field Mapping to open the Field Mapping stage configuration panel.
- In Field Translations, click Add to create a new field mapping rule.
-
Under Source Field, enter
genres. -
Under Target Field, enter
genres_ss. The field suffix_ssmeans that this field is a multi-valued string field.Fusion currently interprets this field as having a single value. You can see that the field actually contains a pipe-delimited array of values. You will fix this after you finish configuring field mappings. -
Under Operation, select move.
The move operation means that the resulting document no longer has a
genresfield; it only hasgenres_ss.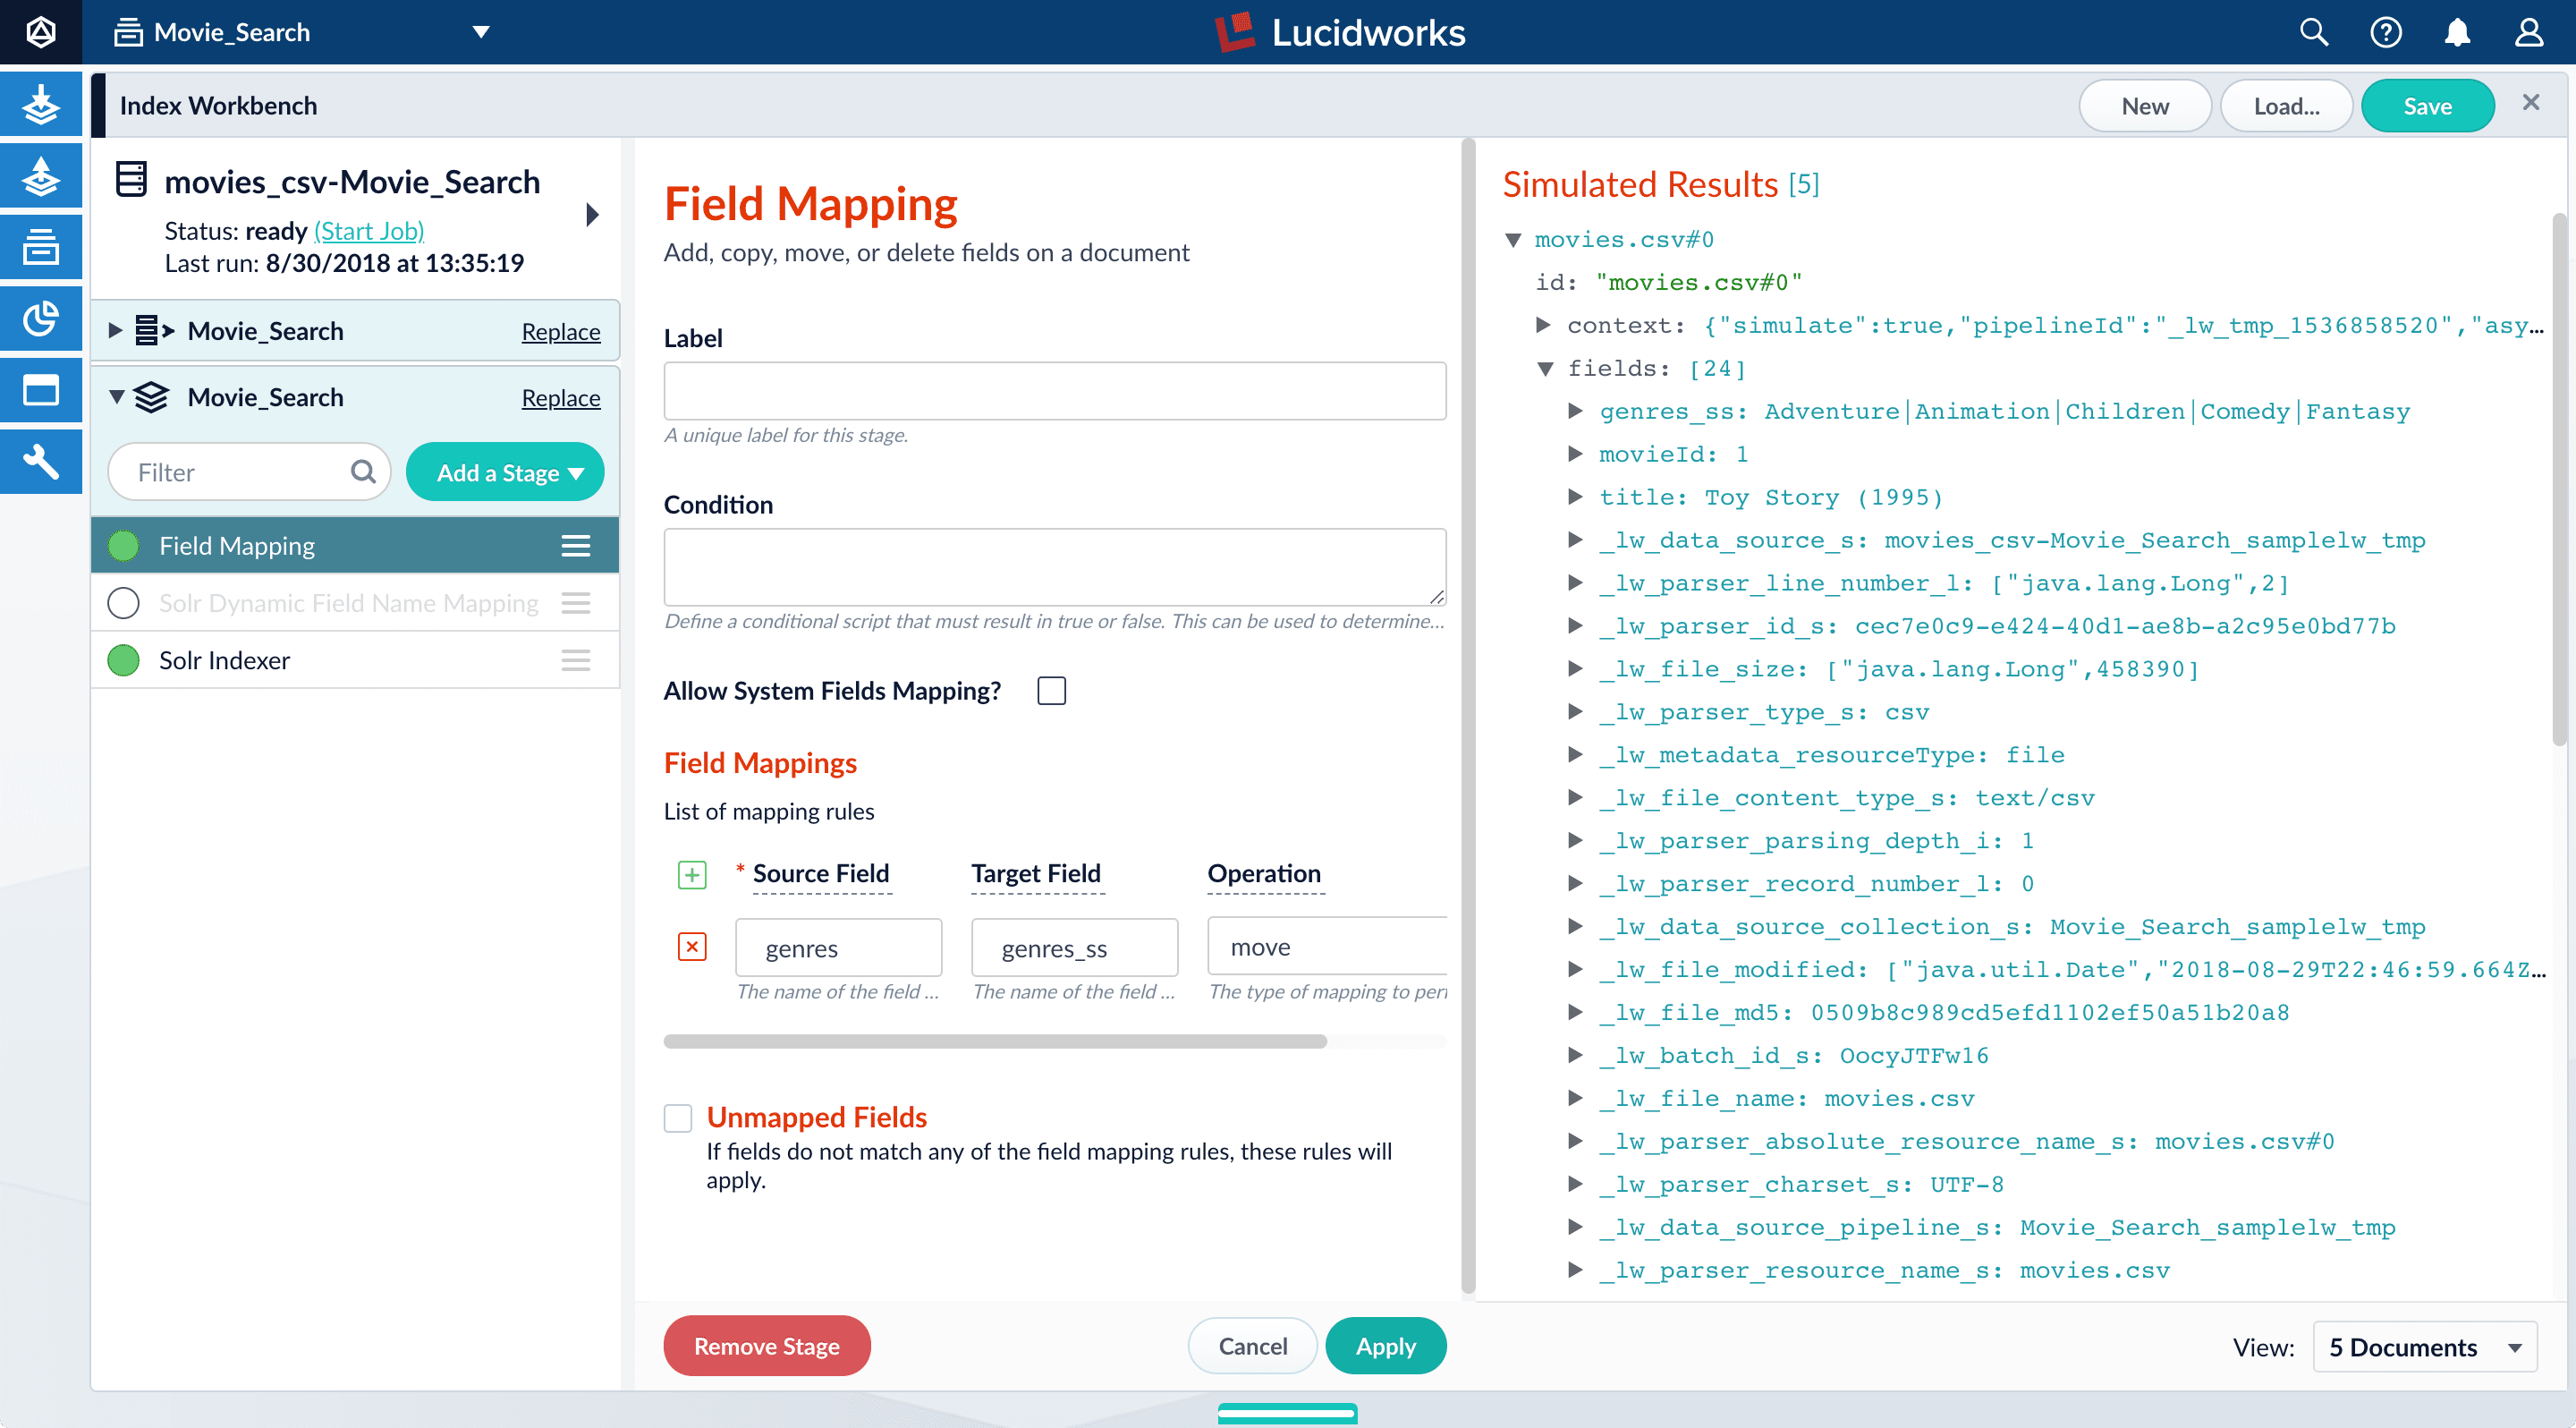
-
Click Apply.
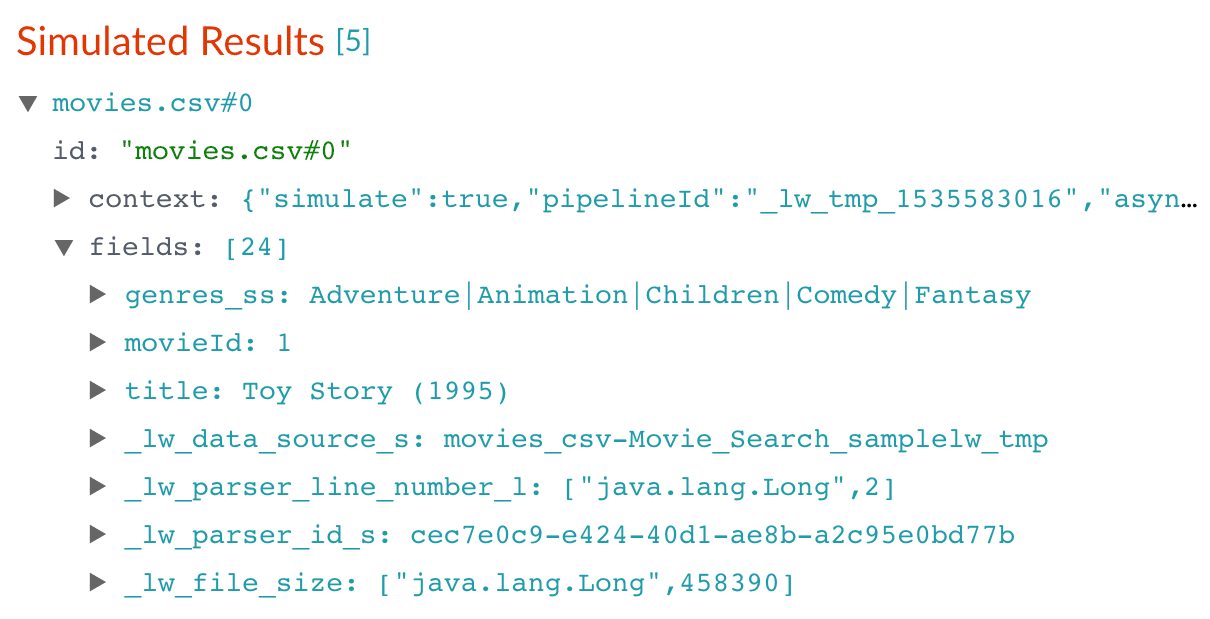
Applying the new configuration re-runs the simulation and updates the contents of the preview panel. Notice the change in the field name from
genrestogenres_ss:Before After 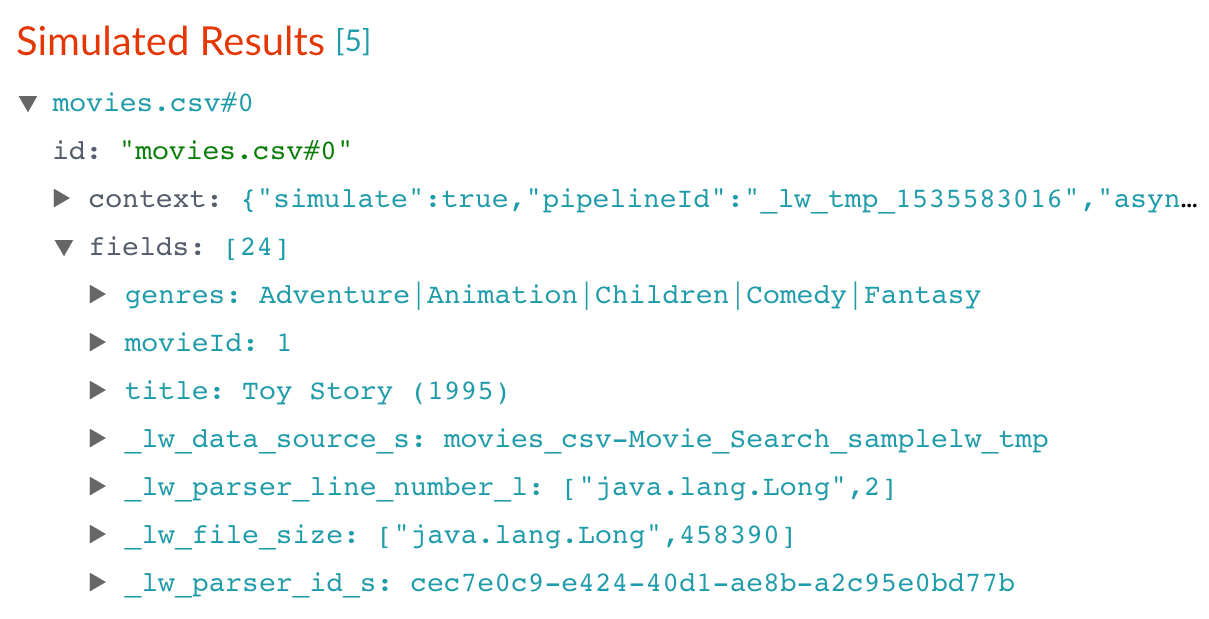
-
Click Add to add more field mapping rules as follows:
- The
movieIdfield is a unique document identifier. It should be copied into the document’sidfield. - The
titleshould be searchable as a text field, so you move it to the fieldtitle_txt.
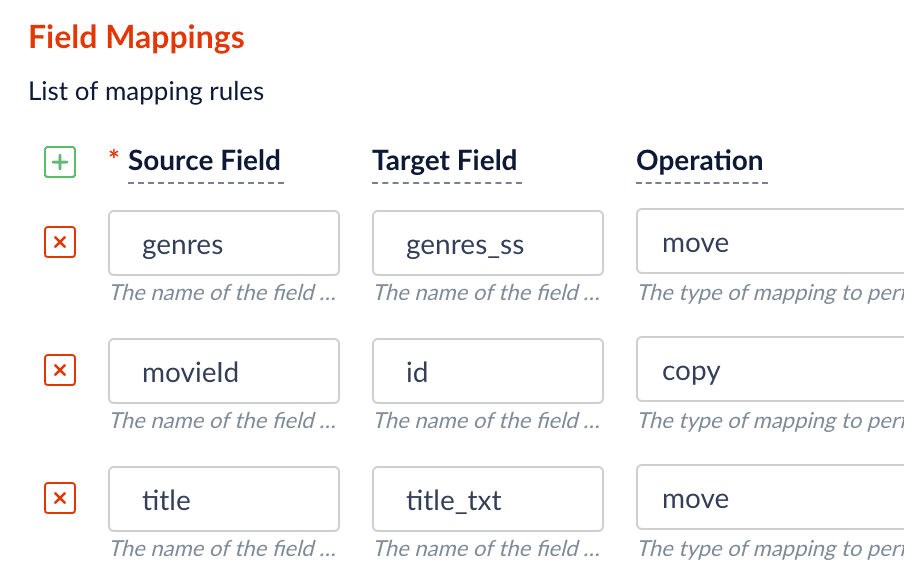
- The
-
Click Apply.
After you have specified these explicit field mapping rules, you can browse the resulting documents
in the preview panel to check your work.
Before After 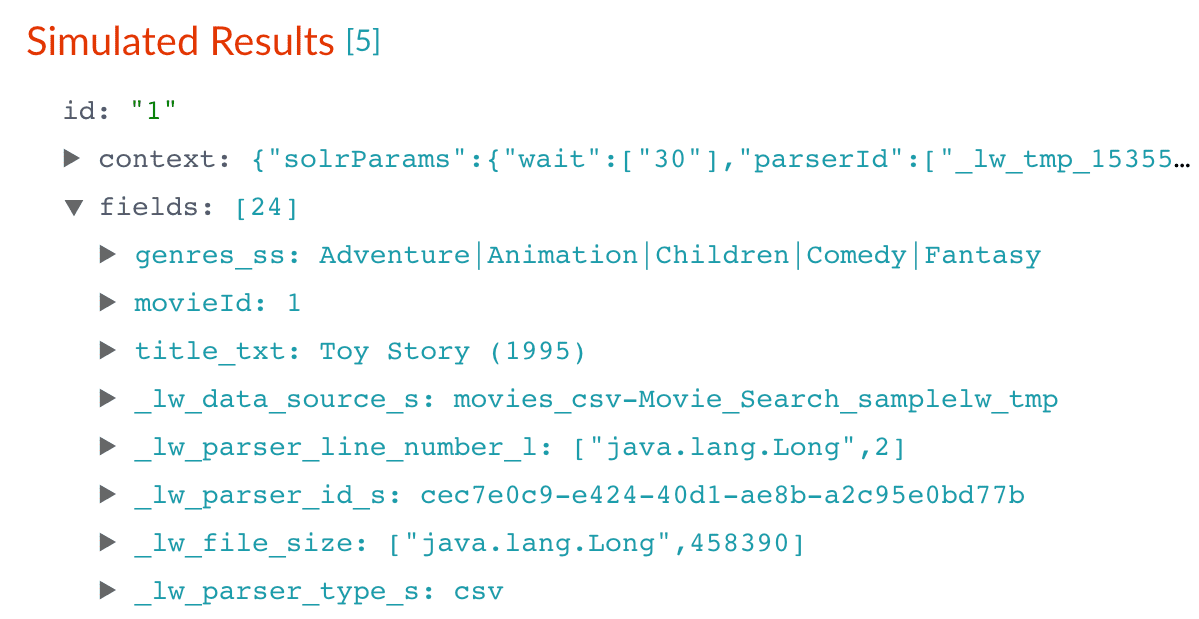
- In the upper right, click Save. This saves your modified index pipeline. Get in the habit of saving your work as you work.
Split a multi-value field
Thegenres_ss field has been parsed as a single-value field, but you can see that it is really a pipe-delimited array of values. To split this field into its constituent values, you will add a Regex Field Extraction stage to your index pipeline. This stage uses regular expressions to extract data from specific fields. It can append or overwrite existing fields with the extracted data, or use the data to populate new fields.- Click Add a stage.
-
Scroll down and select Regex Field Extraction (under Field Transformation).
The Regex Field Extraction stage configuration panel appears.
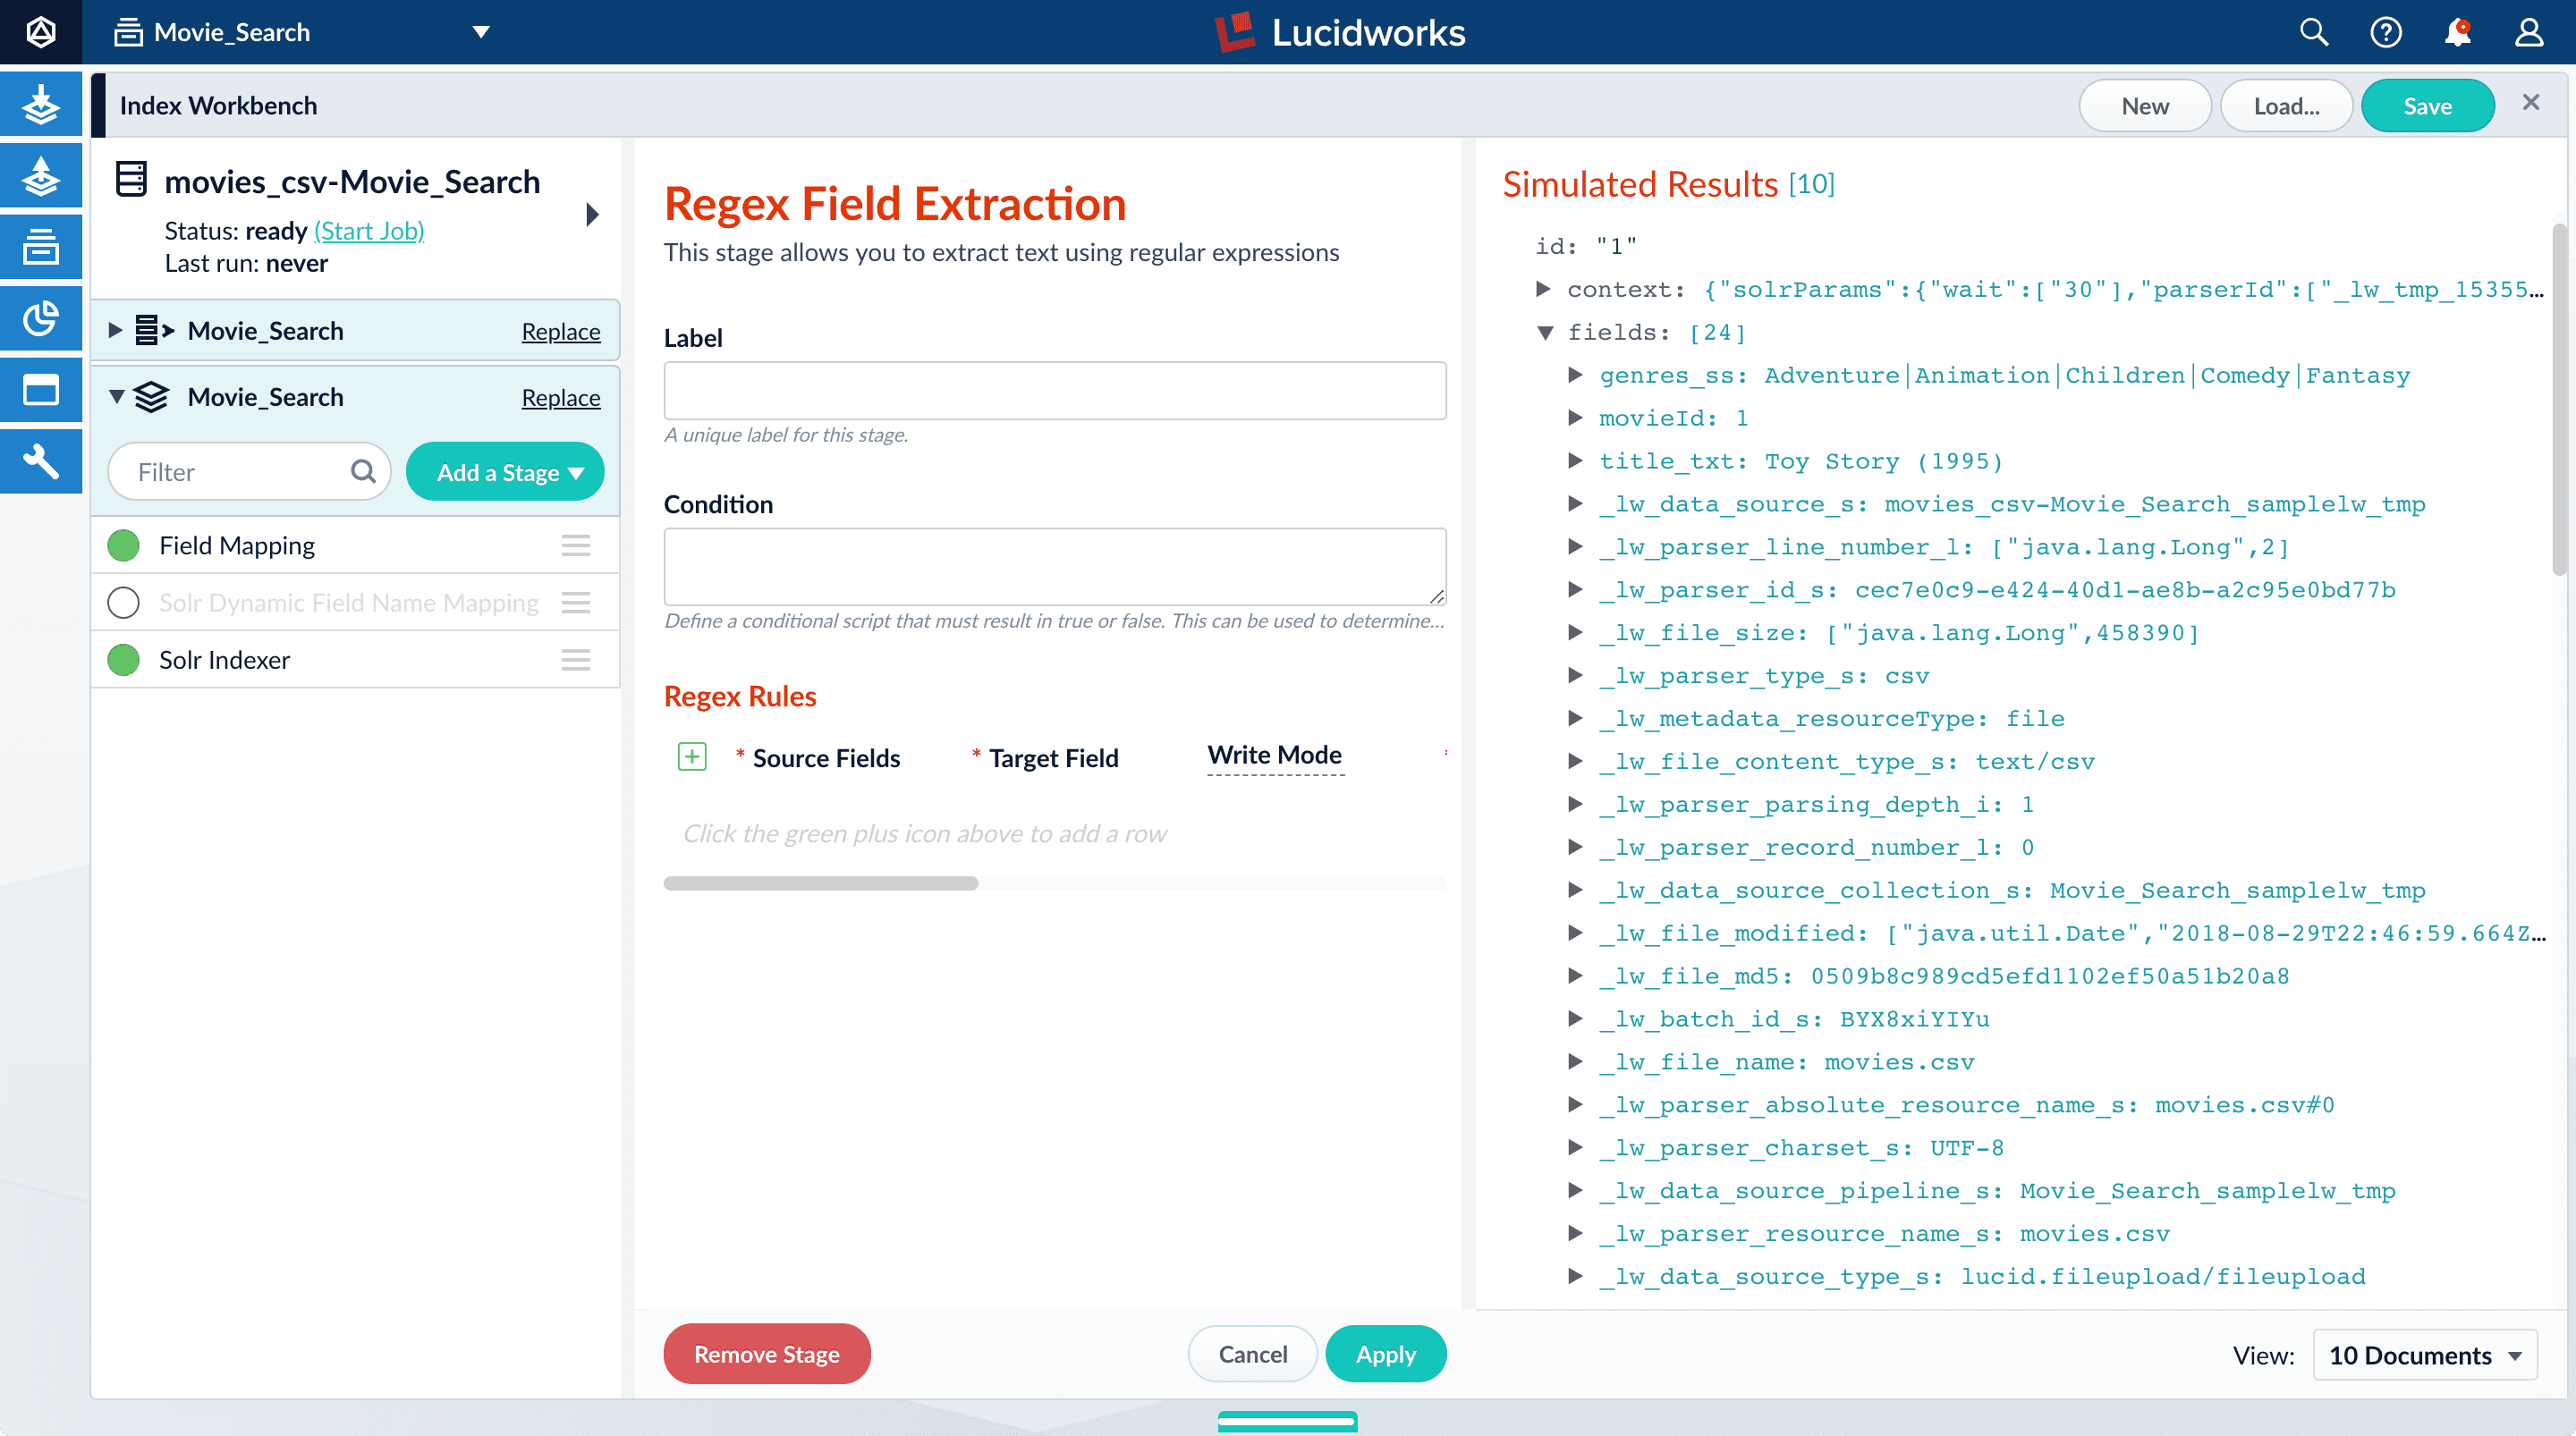
- Under Regex Rules, click Add .
-
On the new line, hover over the
[...]under Source Fields, and then click Edit . The Source Fields window opens. - Click Add .
-
Enter
genres_ss, and then click Apply. -
Under Target Field, enter
genres_ss. - In the Write Mode field, select overwrite.
-
In the Regex Pattern field, enter this expression:
The first bracketed term in the regex matches any character that is not a vertical bar or a space. The second term matches any character that is not a vertical bar, zero or more times. The last term matches any character that is not a vertical bar, zero or more times.
-
In the Return If No Match field, select
input_string. - Click Apply. Initially, your data does not change.
-
In the list of index pipeline stages, drag the Regex Field Extraction stage down so that it comes after the Field Mapping stage:
genres_ssfield:Before After 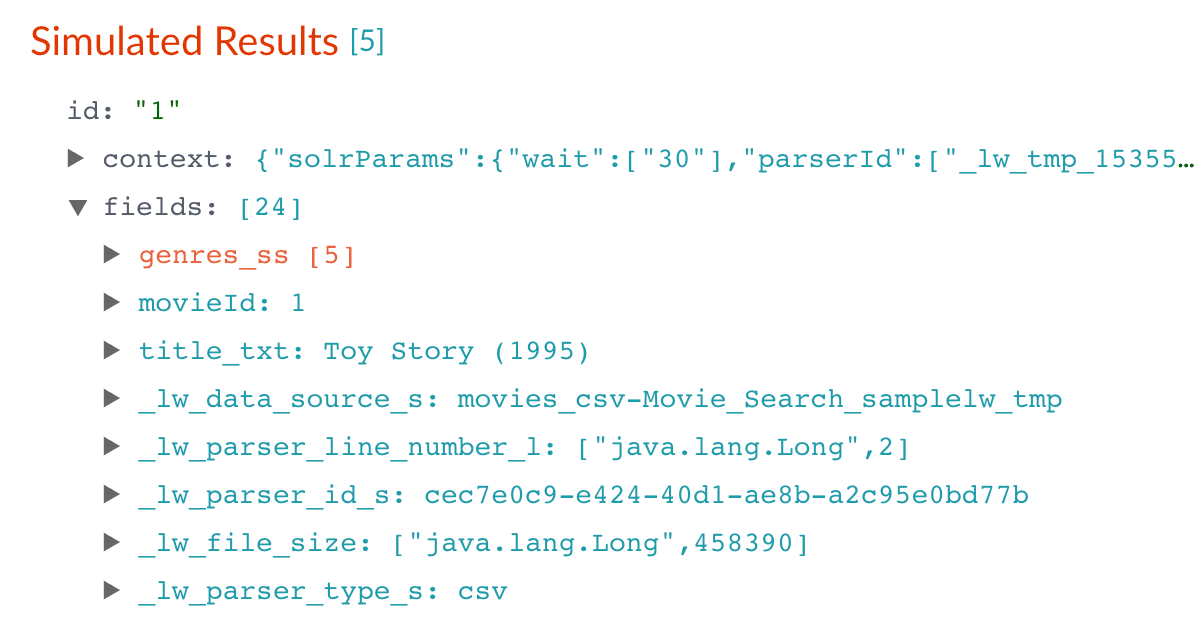
-
To view the values of the
genres_ssfield, expand it andvaluesunder it by clicking the right triangle :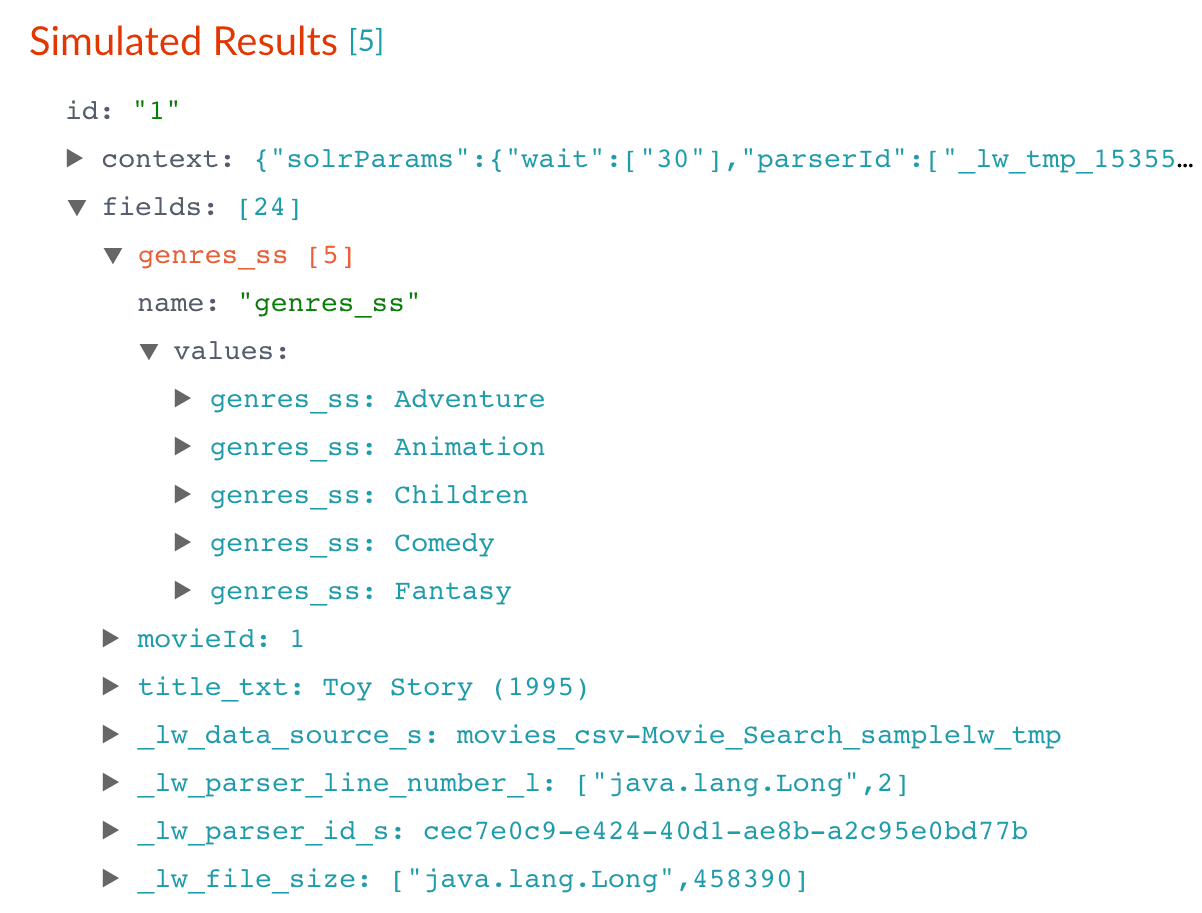
- In the upper right, click Save. This saves your modified index pipeline.
Create a new field from part of an existing one
Notice that thetitle_txt field also contains the year in which the movie was released. Instead of including the year in your full-text search field, it would be more useful as a separate field that you can use for faceting. This is another job for the Regex Field Extraction stage.- In the list of index pipeline stages, click Regex Field Extraction.
- In the Regex Field Extraction configuration panel, under Regex Rules, click Add .
-
On the new line, hover over the
[...]under Source Fields, and then click Edit . The Source Fields window appears. - Click Add .
-
Enter
title_txt, and then click Apply. -
Under Target Field, enter
year_i. The_isuffix indicates an integer point field (specifically, that the field is a dynamic field with apintfield type). Fusion will create this new field whenever the regular expression matches the contents of the source field. -
In the Regex Pattern field, enter this expression to match the digits inside the parentheses at the end of the
title_txtvalue: -
In the Regex Capture Group field, enter
1. This lets the index pipeline stage transfer the year into theyear_ifield. -
Click Apply.
Now the preview includes the new
year_ifield:Before After 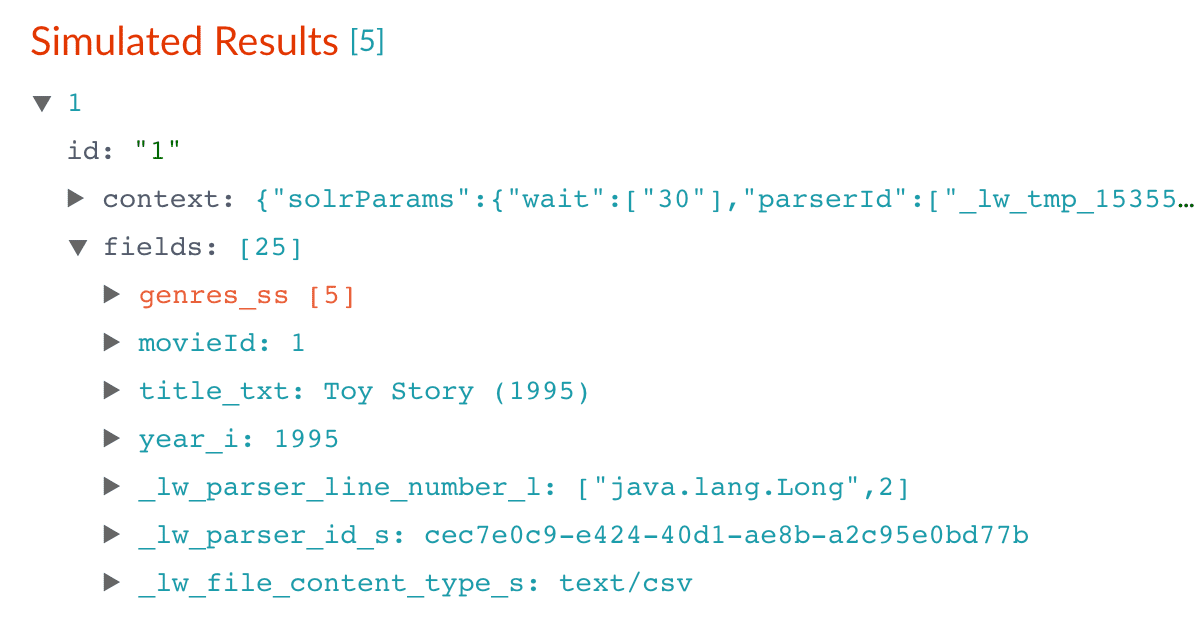
- In the upper right, click Save. This saves your modified index pipeline.
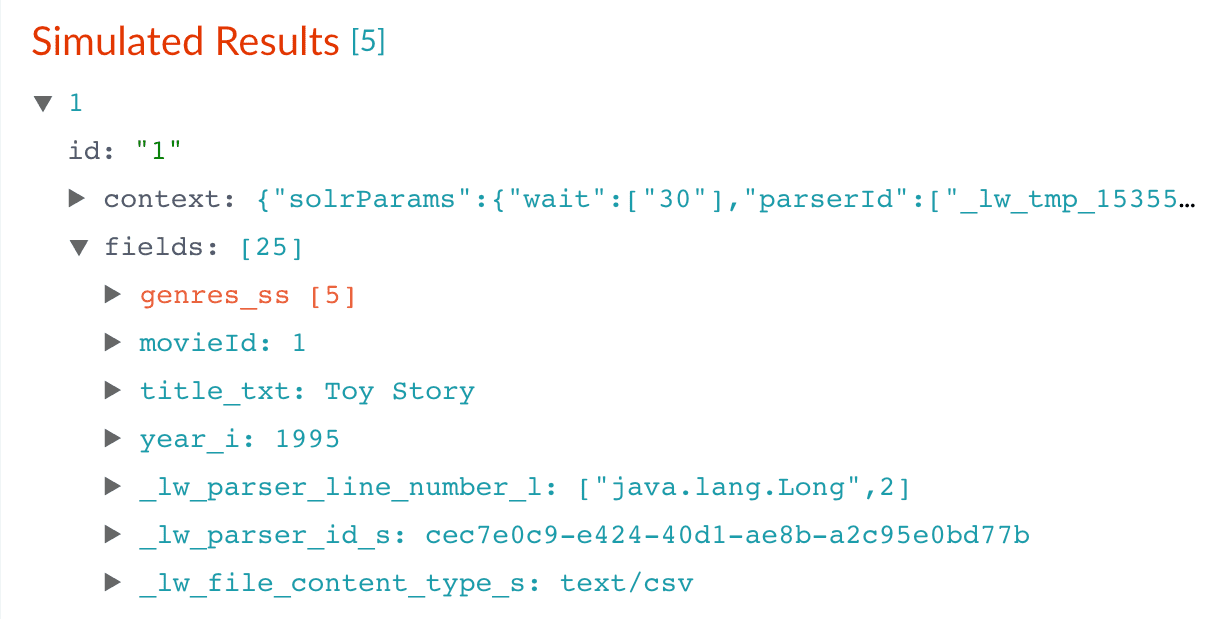
Trim a field’s value
Thetitle_txt field still includes the year of the film’s release, which you have extracted into its own field, year_i. Let us trim that information from the title_txt values so that only the title text remains.- In the list of index pipeline stages, click Regex Field Extraction.
- In the Regex Field Extraction configuration panel, under Regex Rules, click Add .
- On the new line, hover over Source Fields, and then click Edit . The Source Fields window appears.
- Click Add .
-
Enter
title_txt, and then click Apply. -
Under Target Field, enter
title_txt. -
In the Write Mode field, select
overwrite. -
In the Regex Pattern field, enter this expression to match the digits inside the parentheses at the end of the
title_txtvalue: -
In the Regex Capture Group field, enter
1. -
Click Apply.
Now the preview pane shows the
title_txtfield with only the title string:Before After 
- In the upper right, click Save. This saves your modified index pipeline.
Run the datasource job
Now you have a correctly-configured index pipeline appropriate to your data. You are ready to index the data.-
In the upper left, click Start job.
movies.csvfile, using the configuration you just saved. Your datasource job is finished when the Index Workbench displaysStatus: successin the upper left. If the status does not change, go back to the launcher and relaunch your app.
Close panels you no longer need open
Fusion opens panels beside already open panels. Close all of the panels that are open by clicking Close .Reindexing
Documents are associated with a collection through the name of the datasource. The datasource name is stored as a value in the_lw_data_source_s field. For various reasons, you may wish to remove all documents associated with a datasource from a collection before using CrawlDB to add relevant documents back to the collection. This process is known as reindexing.To accomplish this, navigate to Indexing > Datasources, select the datasource name, and then click Clear Datasource. This will remove all documents with the selected datasource name in the _lw_data_source_s field. After the documents are removed from the collection, you can repeat [the steps above”/> to reindex the data.What is next
Now you have 9,125 movie listings from the MovieLens database in Fusion’s index, customized to indicate the data type for each field. You also split a multi-valued field so that its values can be treated individually, created a new field to contain partial contents of a different field, and trimmed that content from the original field.Let us compare the initial indexing of your data with the indexing after field mappings and extractions:| Before | After |
|---|---|
|  |
genres_ss and year_i fields so that users can easily filter their search results.Part 3: Get Data Out
Part 3: Get Data Out
In Part 2, you used Index Workbench to get data into Fusion by previewing the dataset, configuring the index pipeline, and then indexing the data.In Part 3 (this part), you will explore Query Workbench and learn how to configure Fusion’s output (search results), including faceting. Facets are the ubiquitous, dynamic lists of categories or features offered as filters within a search results page.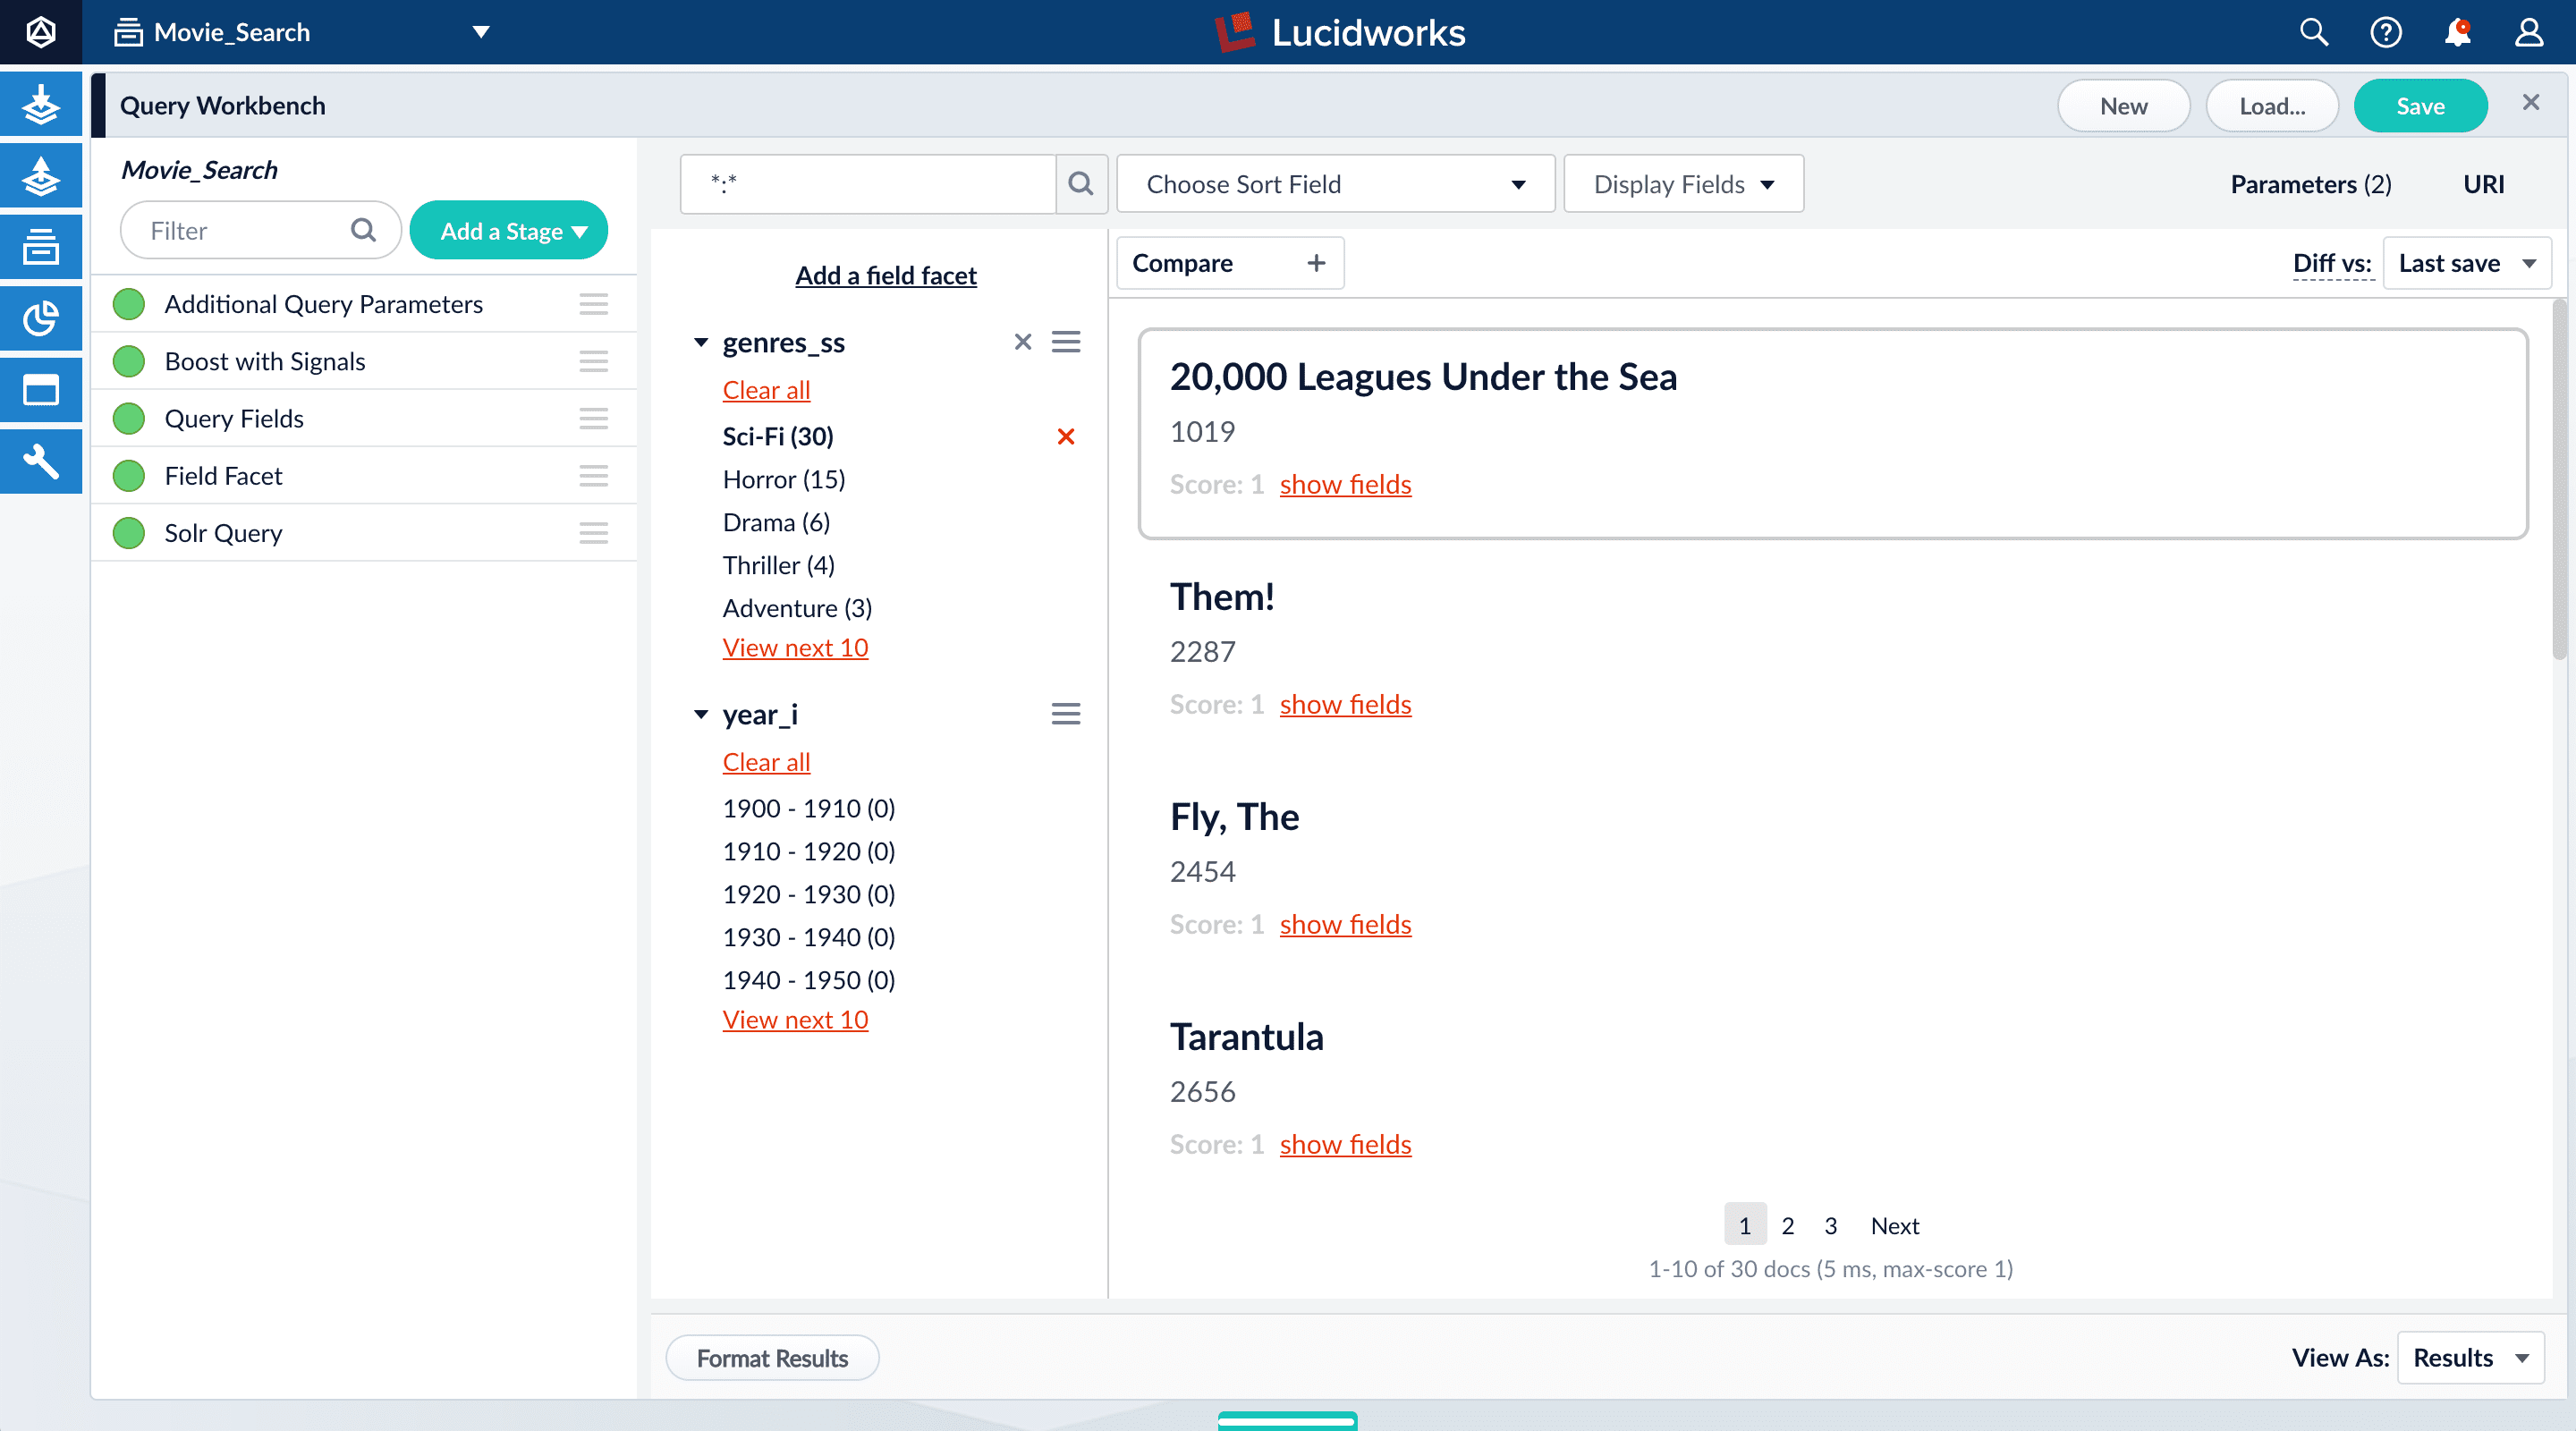
Before you begin
To proceed with this part of the tutorial, you must first complete Part 1 and Part 2, which give you an indexed dataset for Query Workbench to read.The dataset has three fields that users of your search application might find relevant:genres_ss. A list of one or more genre labelstitle_txt. The name of the movieyear_i. The movie’s year of release
-
Fields with the suffix
_ss(multi-valued string fields) contain one or more strings values. String fields require an exact match between the query string and the string value stored in that field. -
Fields with the suffix
_txt(text fields) contain text. Text fields allow for free text search over the field contents.
For example, because the movie titles are stored in a text field, a search on the word “Star” will match movies titled “Star”, “A Star is Born”, all movies in the Star Wars and Star Trek franchises, as well as “Dark Star”, “Lone Star”, and “Star Kid”. -
Fields with the suffix
_i(point integer fields) contain integer values. Numeric fields allow range matches as well as exact matches, and point integer fields allow efficient comparisons between the field’s values and the search criteria.
Explore search results
Query Workbench lets you interactively configure a query pipeline while previewing the search results it produces. A query pipeline converts a free text query submitted to your search application into a structured query for Solr.- Log in to Fusion.
- Click the Movie Search app. The Fusion workspace appears.
-
Open Query Workbench. Navigate to Querying > Query Workbench.
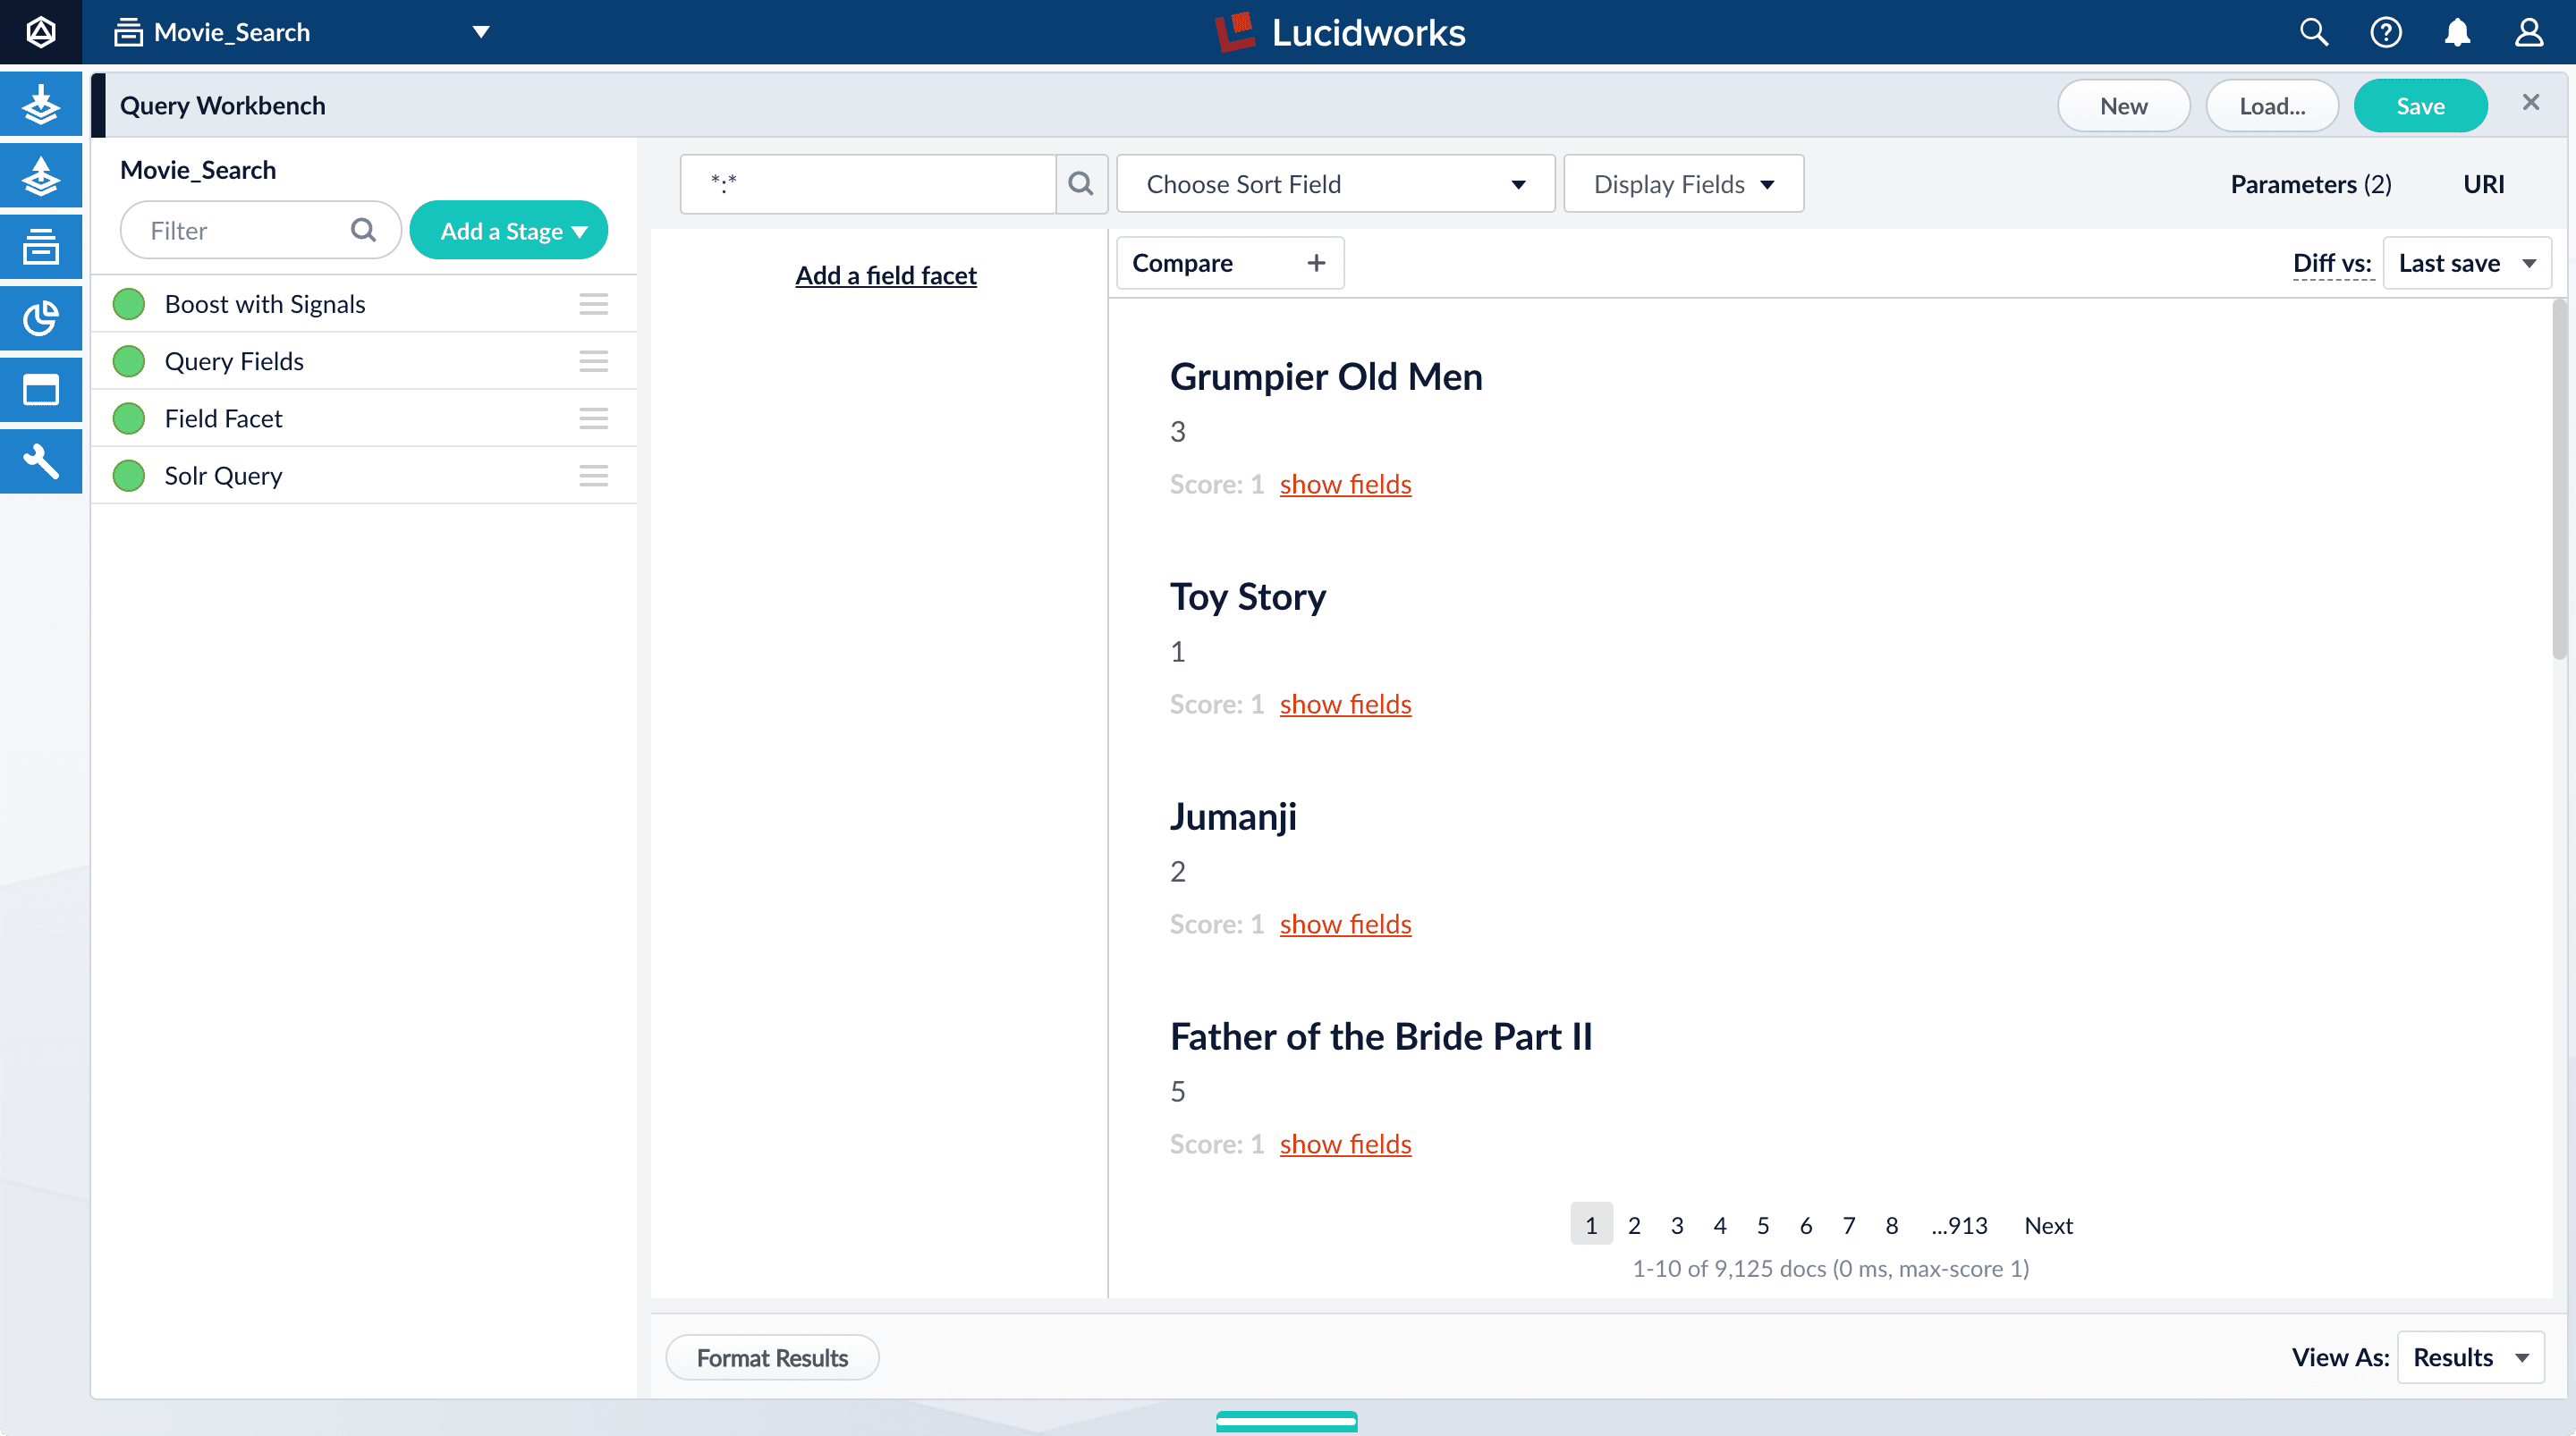
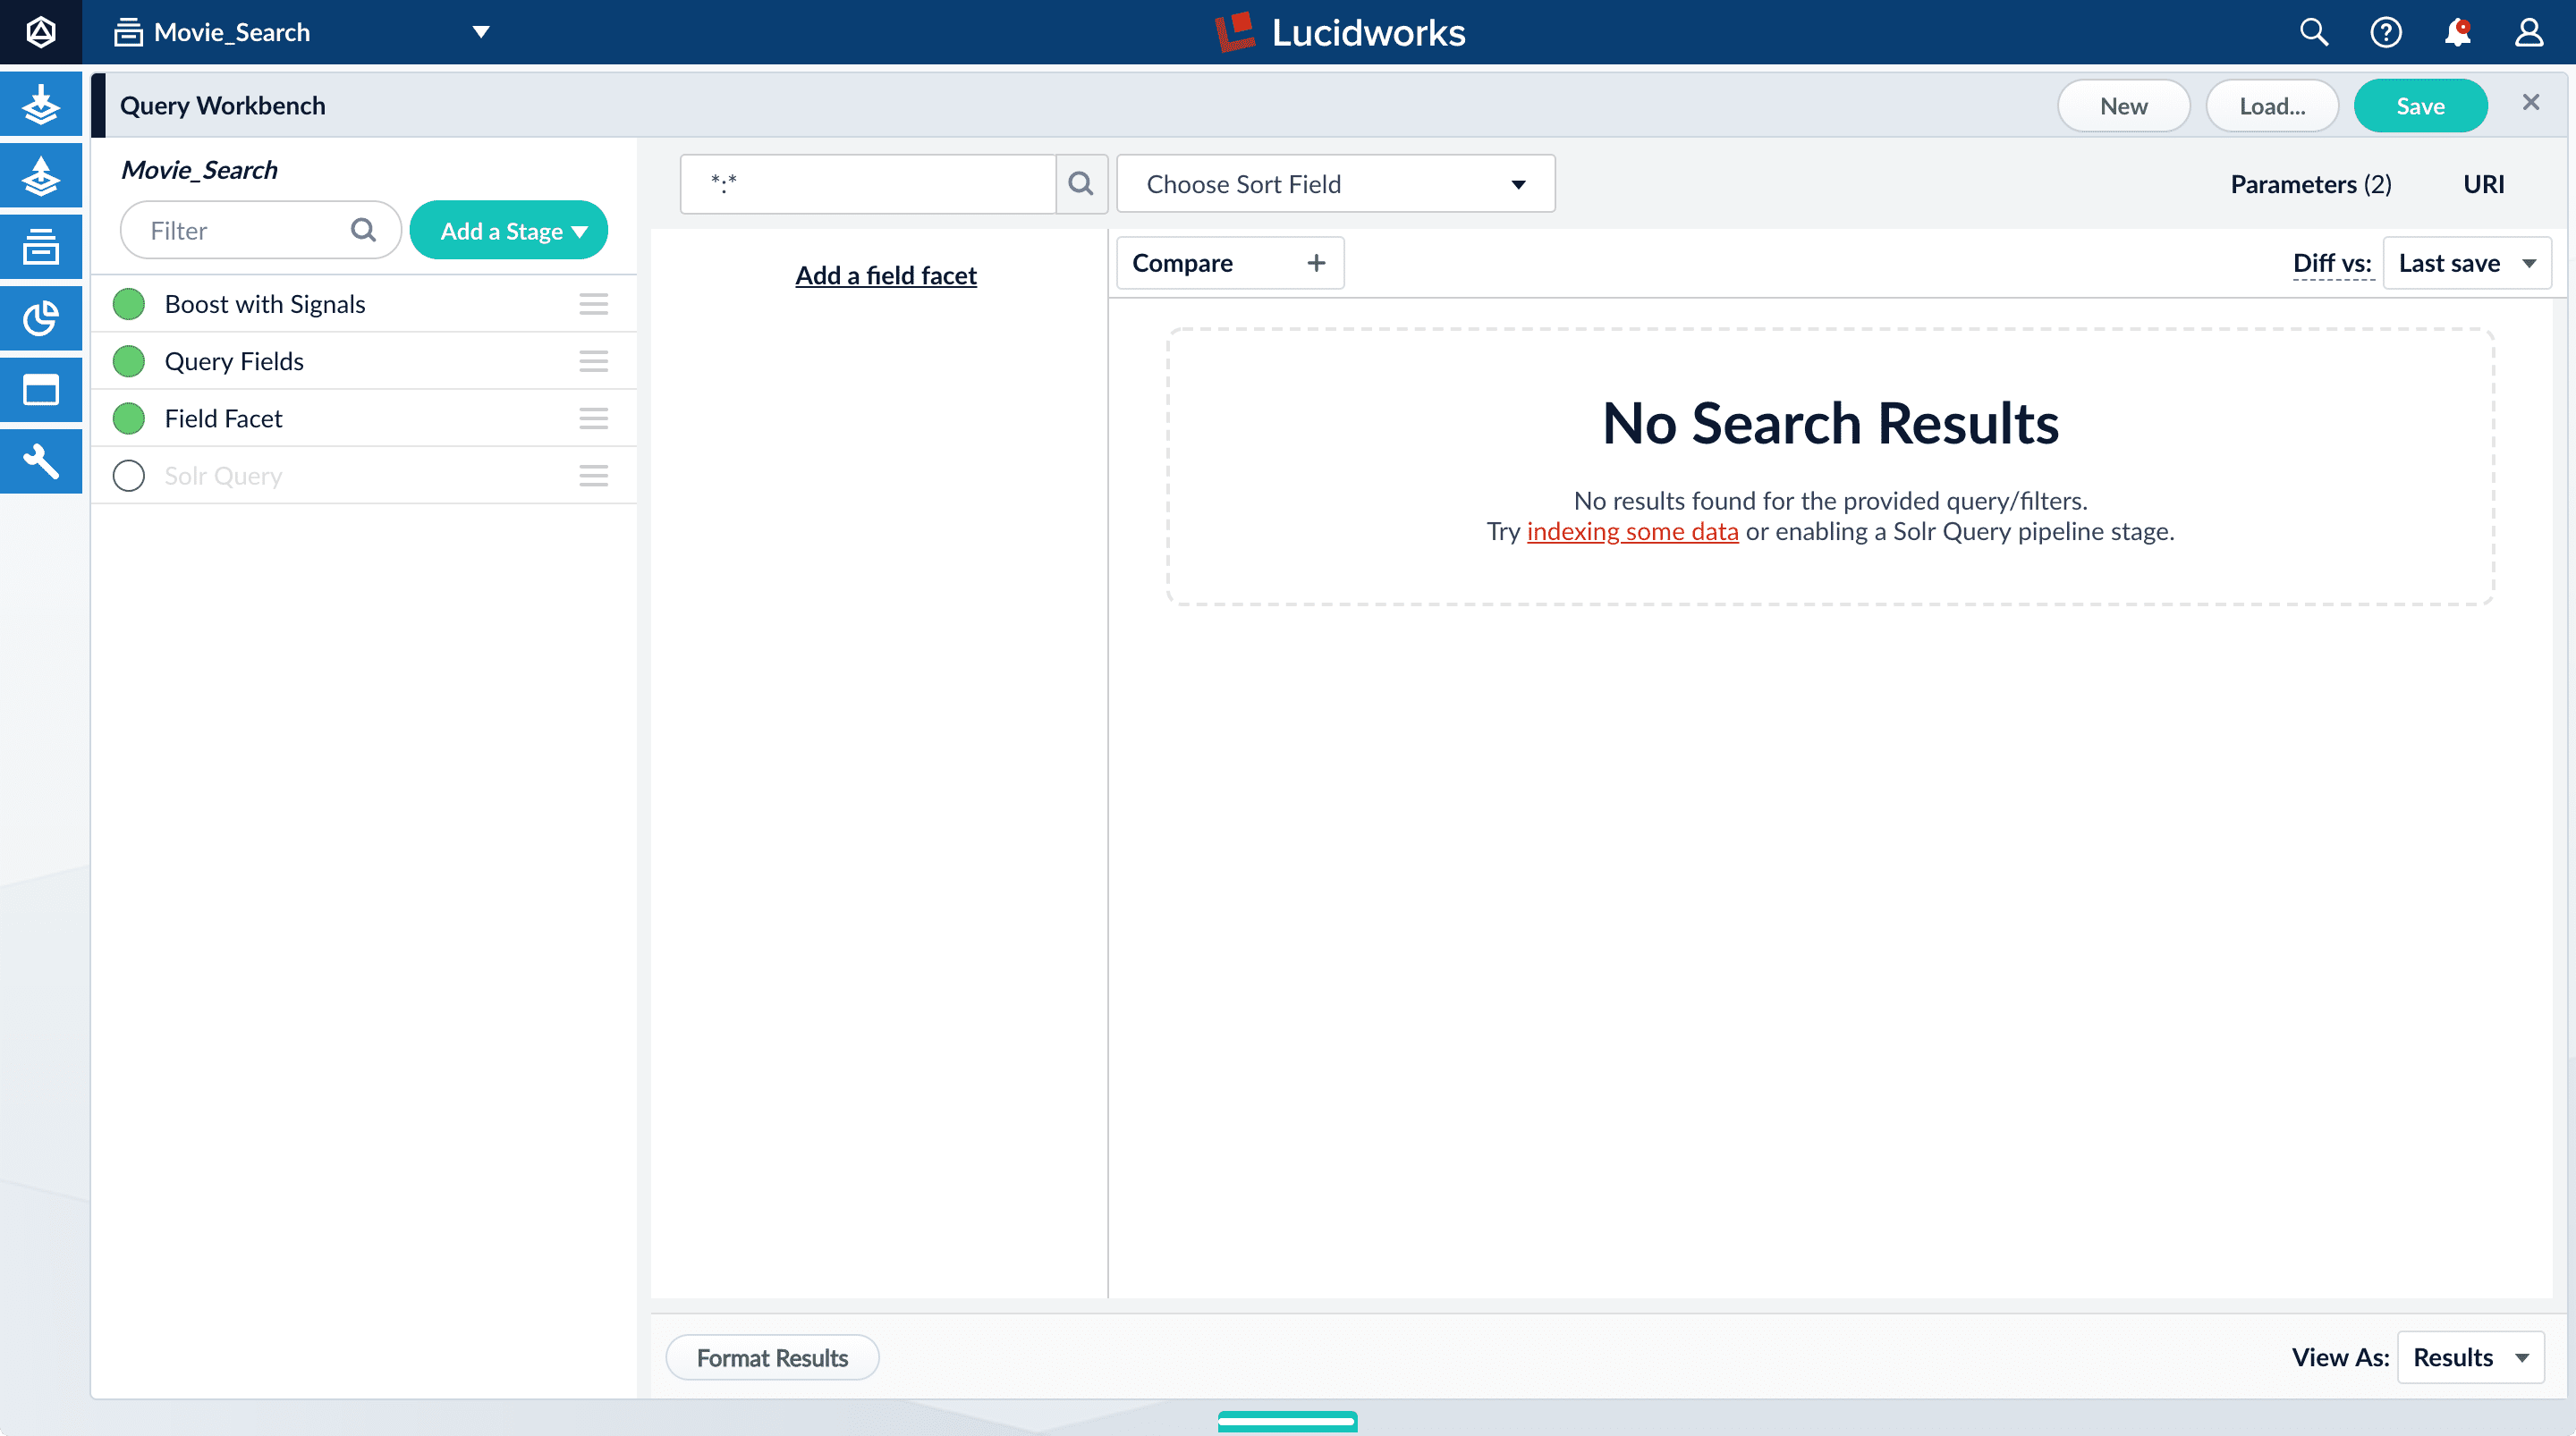
Perform a search
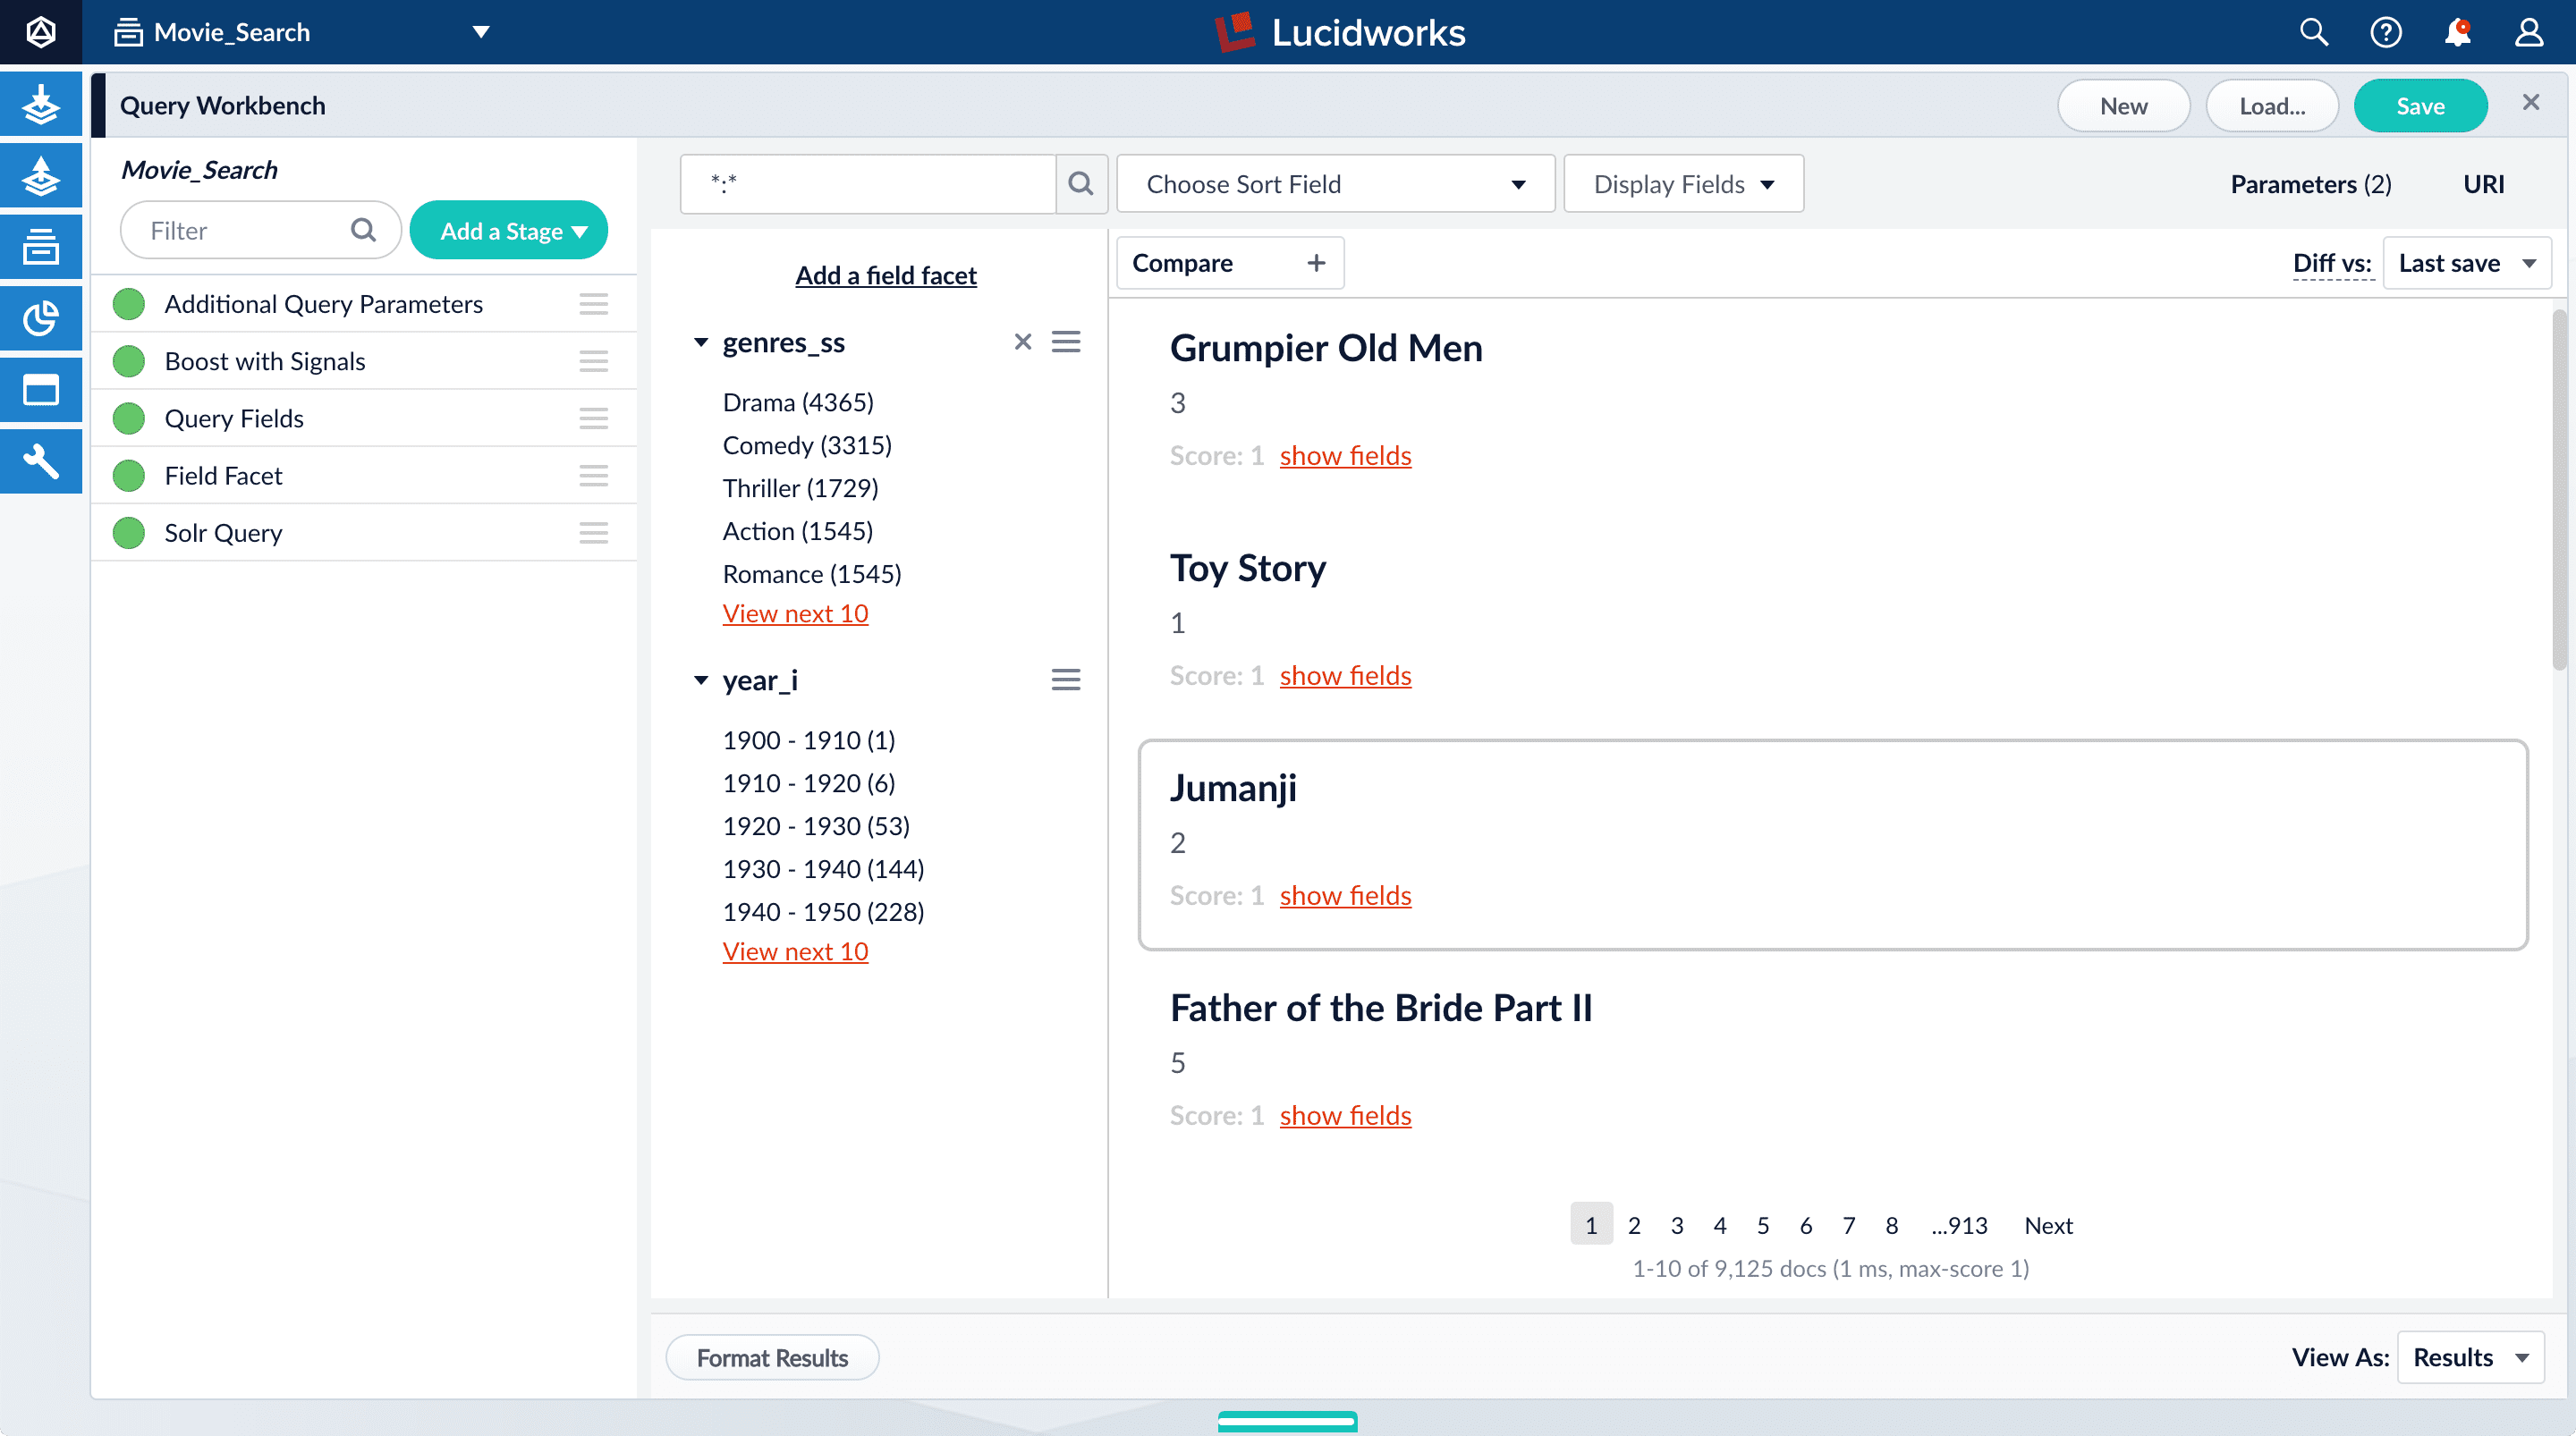
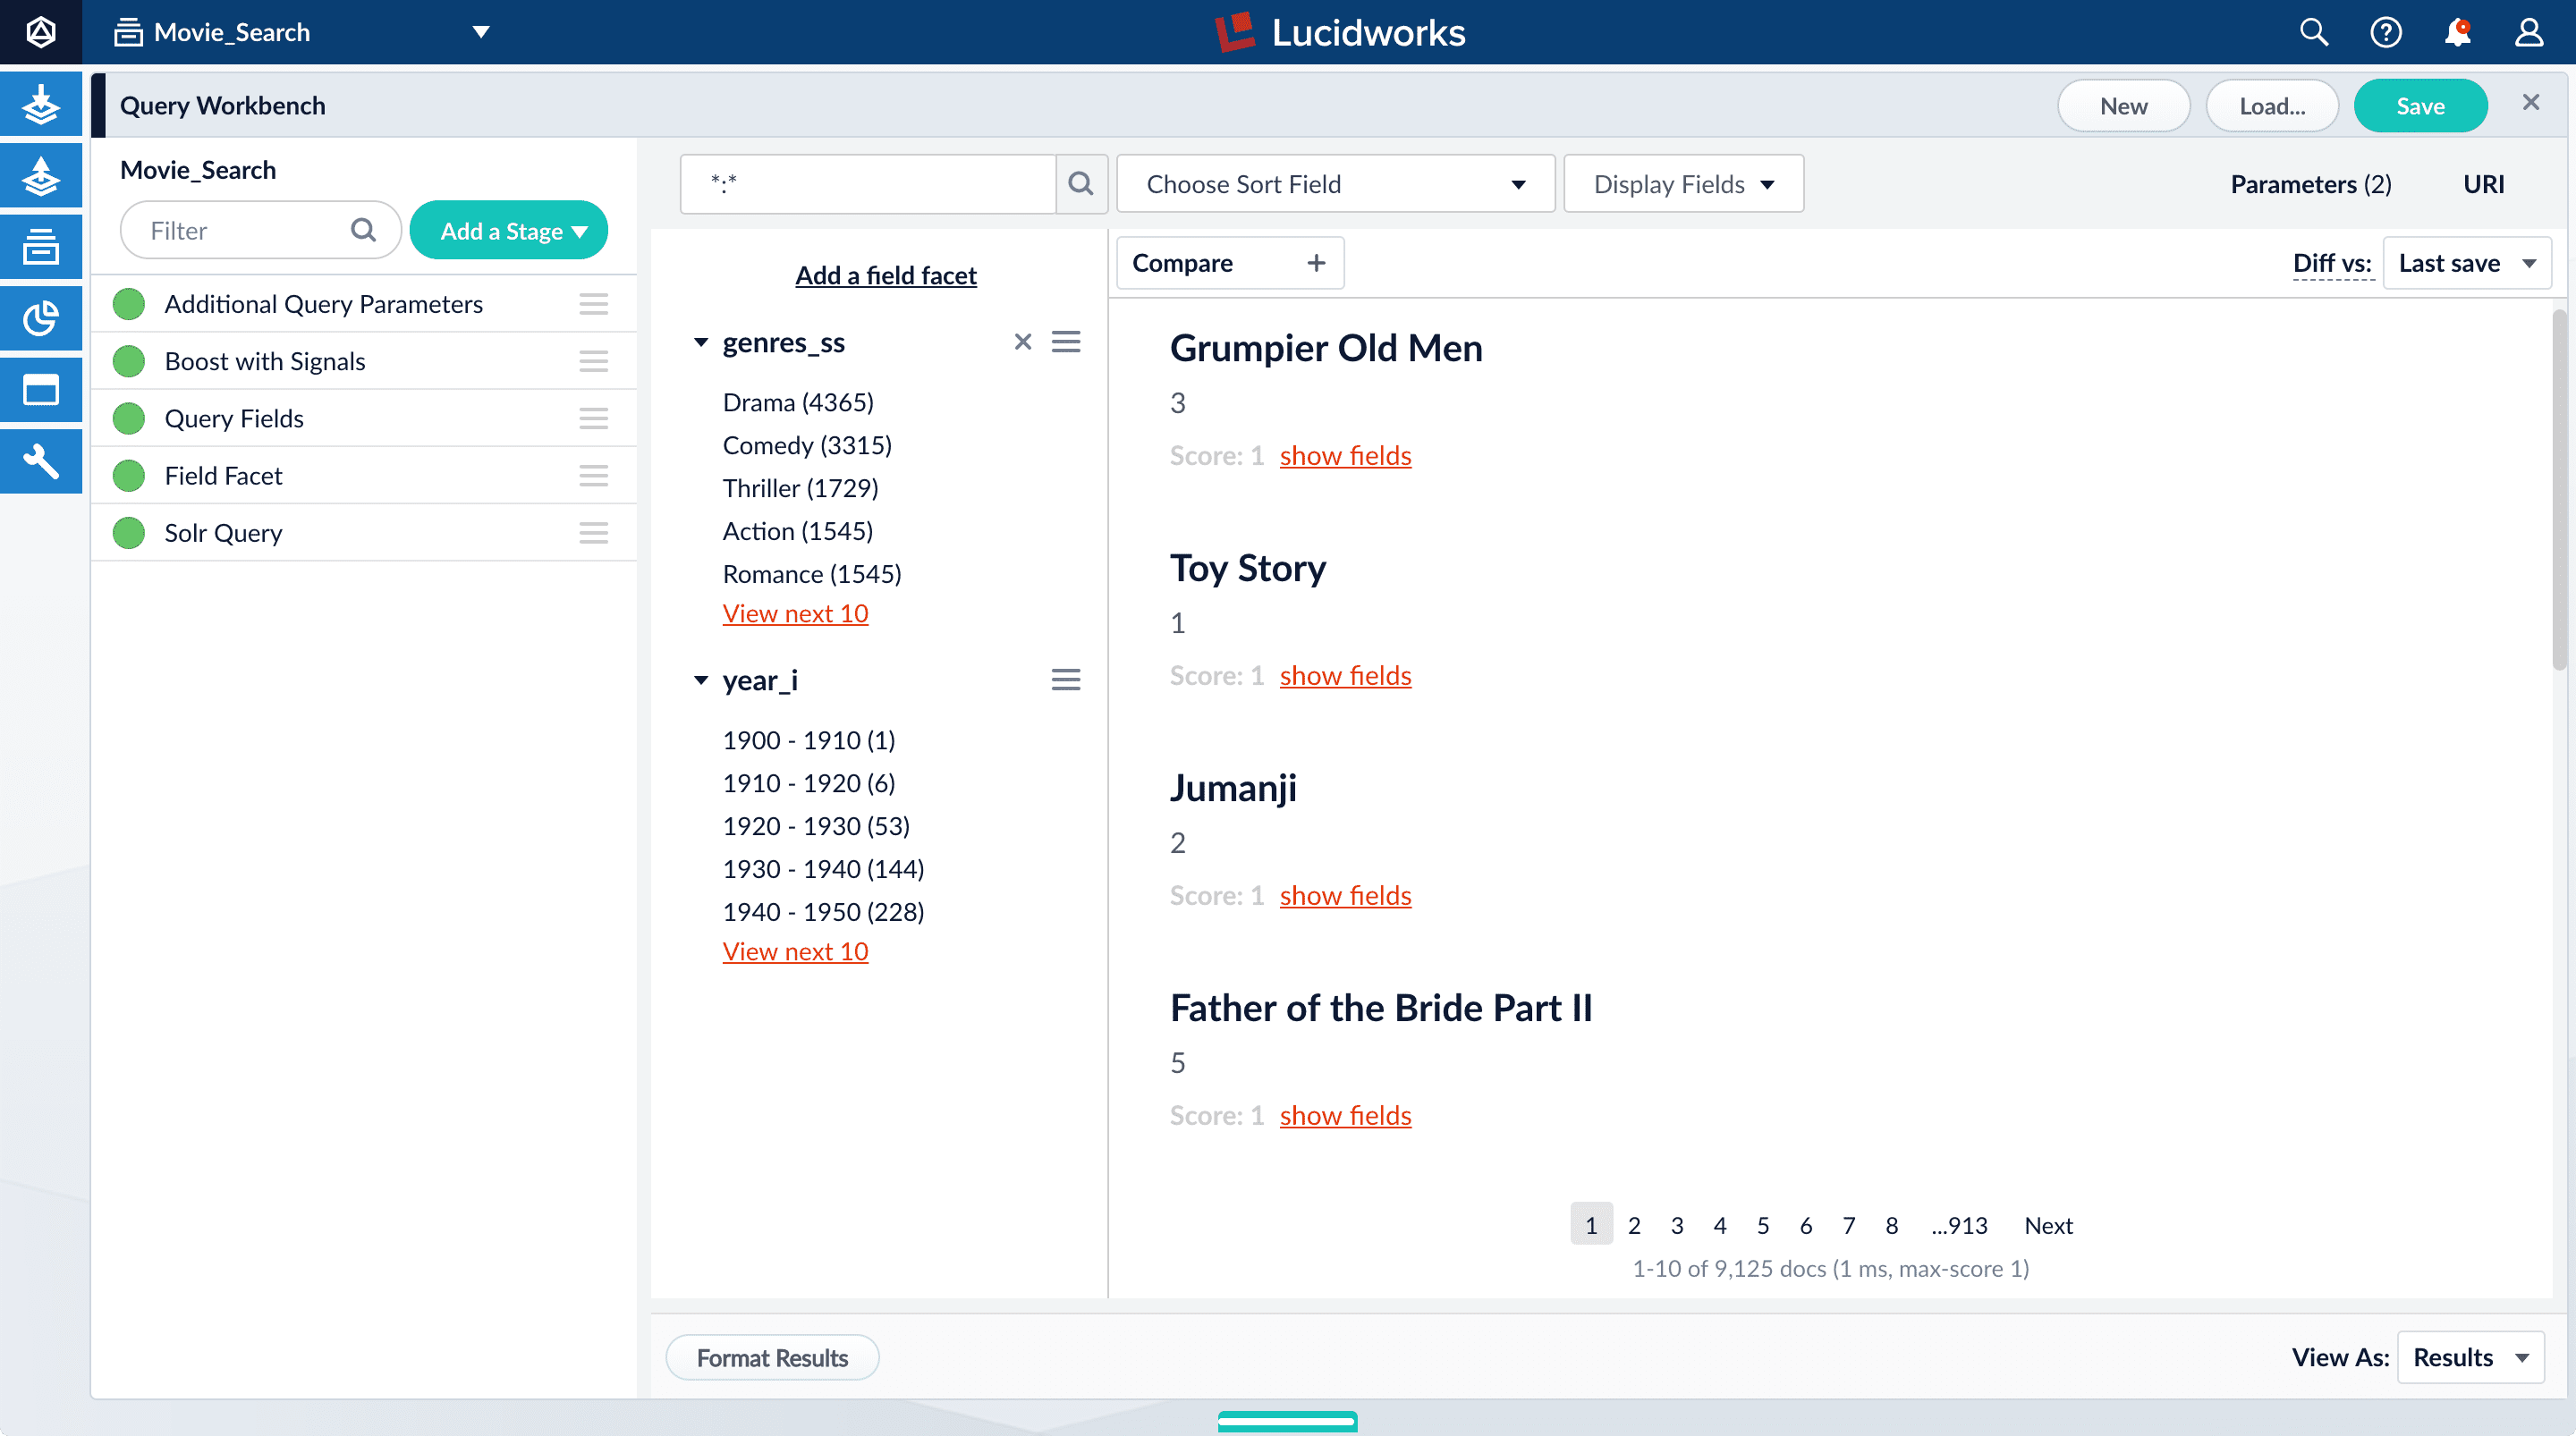
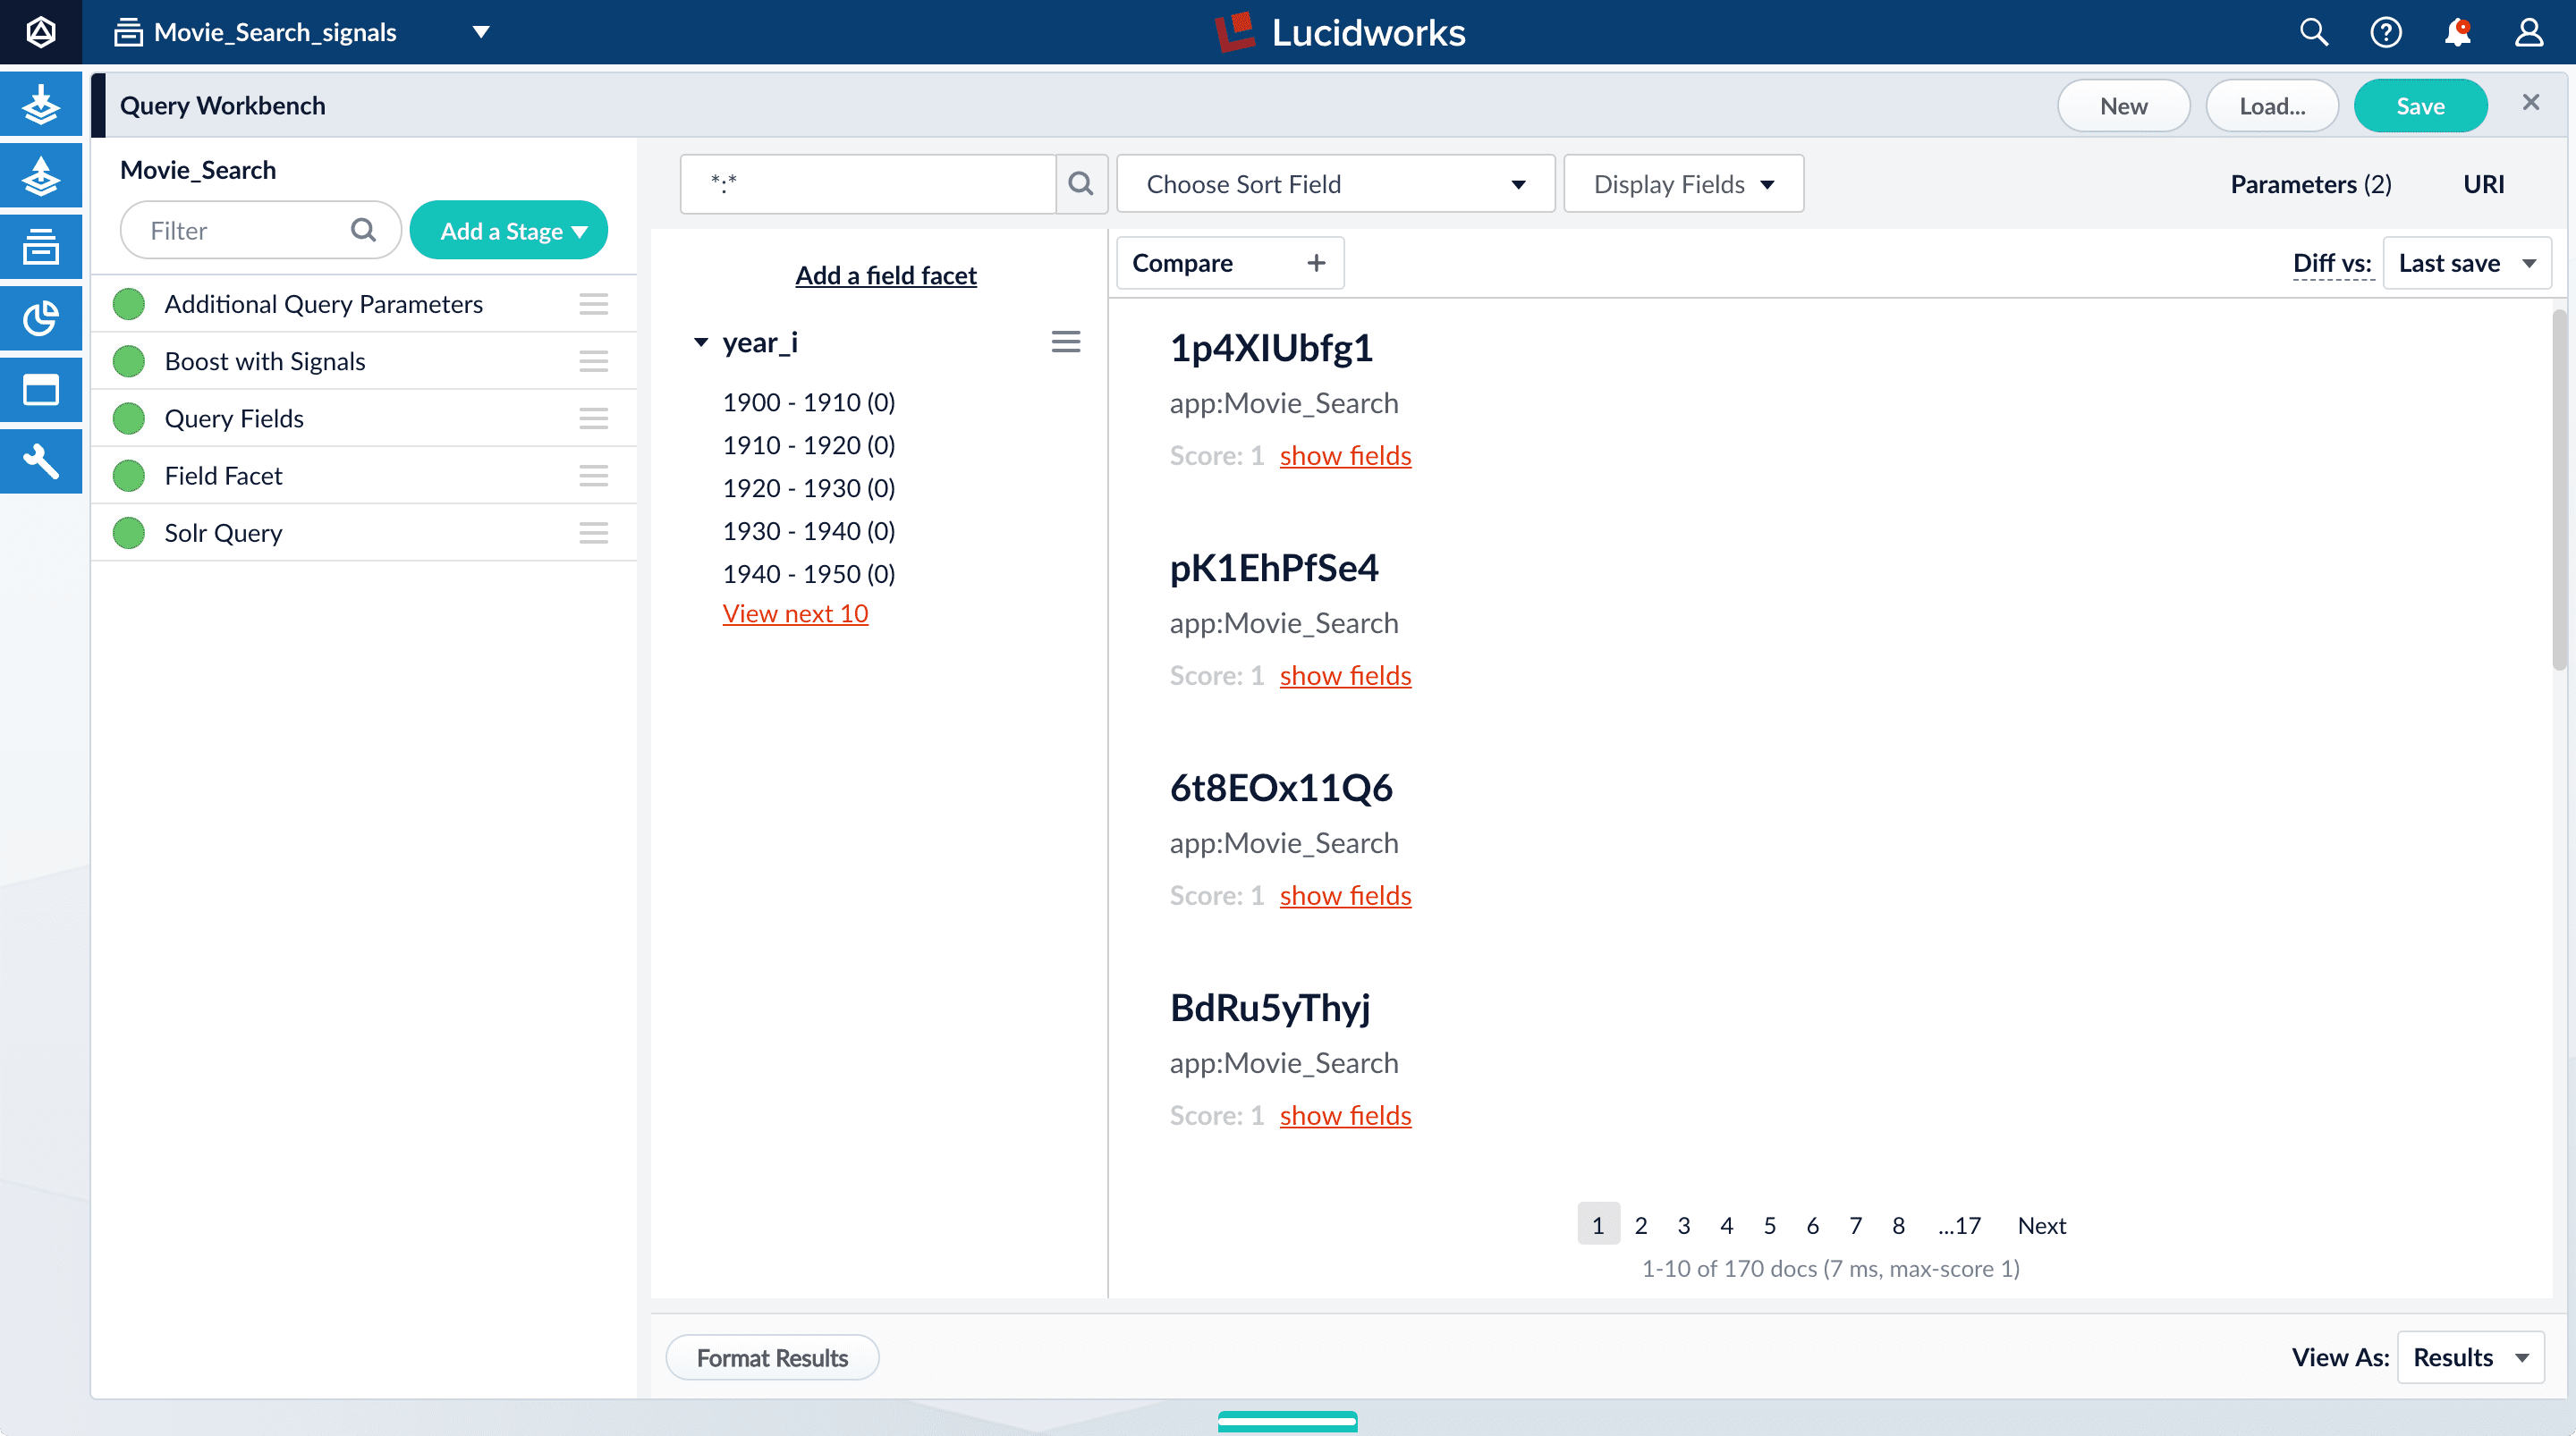
The default search is the wildcard search (\*:*), which returns all documents in the collection. You will enter a different search query to get started with facet configuration.-
In the search box, enter the query string
star, and then press Enter or click Search . This search returns all movies that have the word “star” in the title.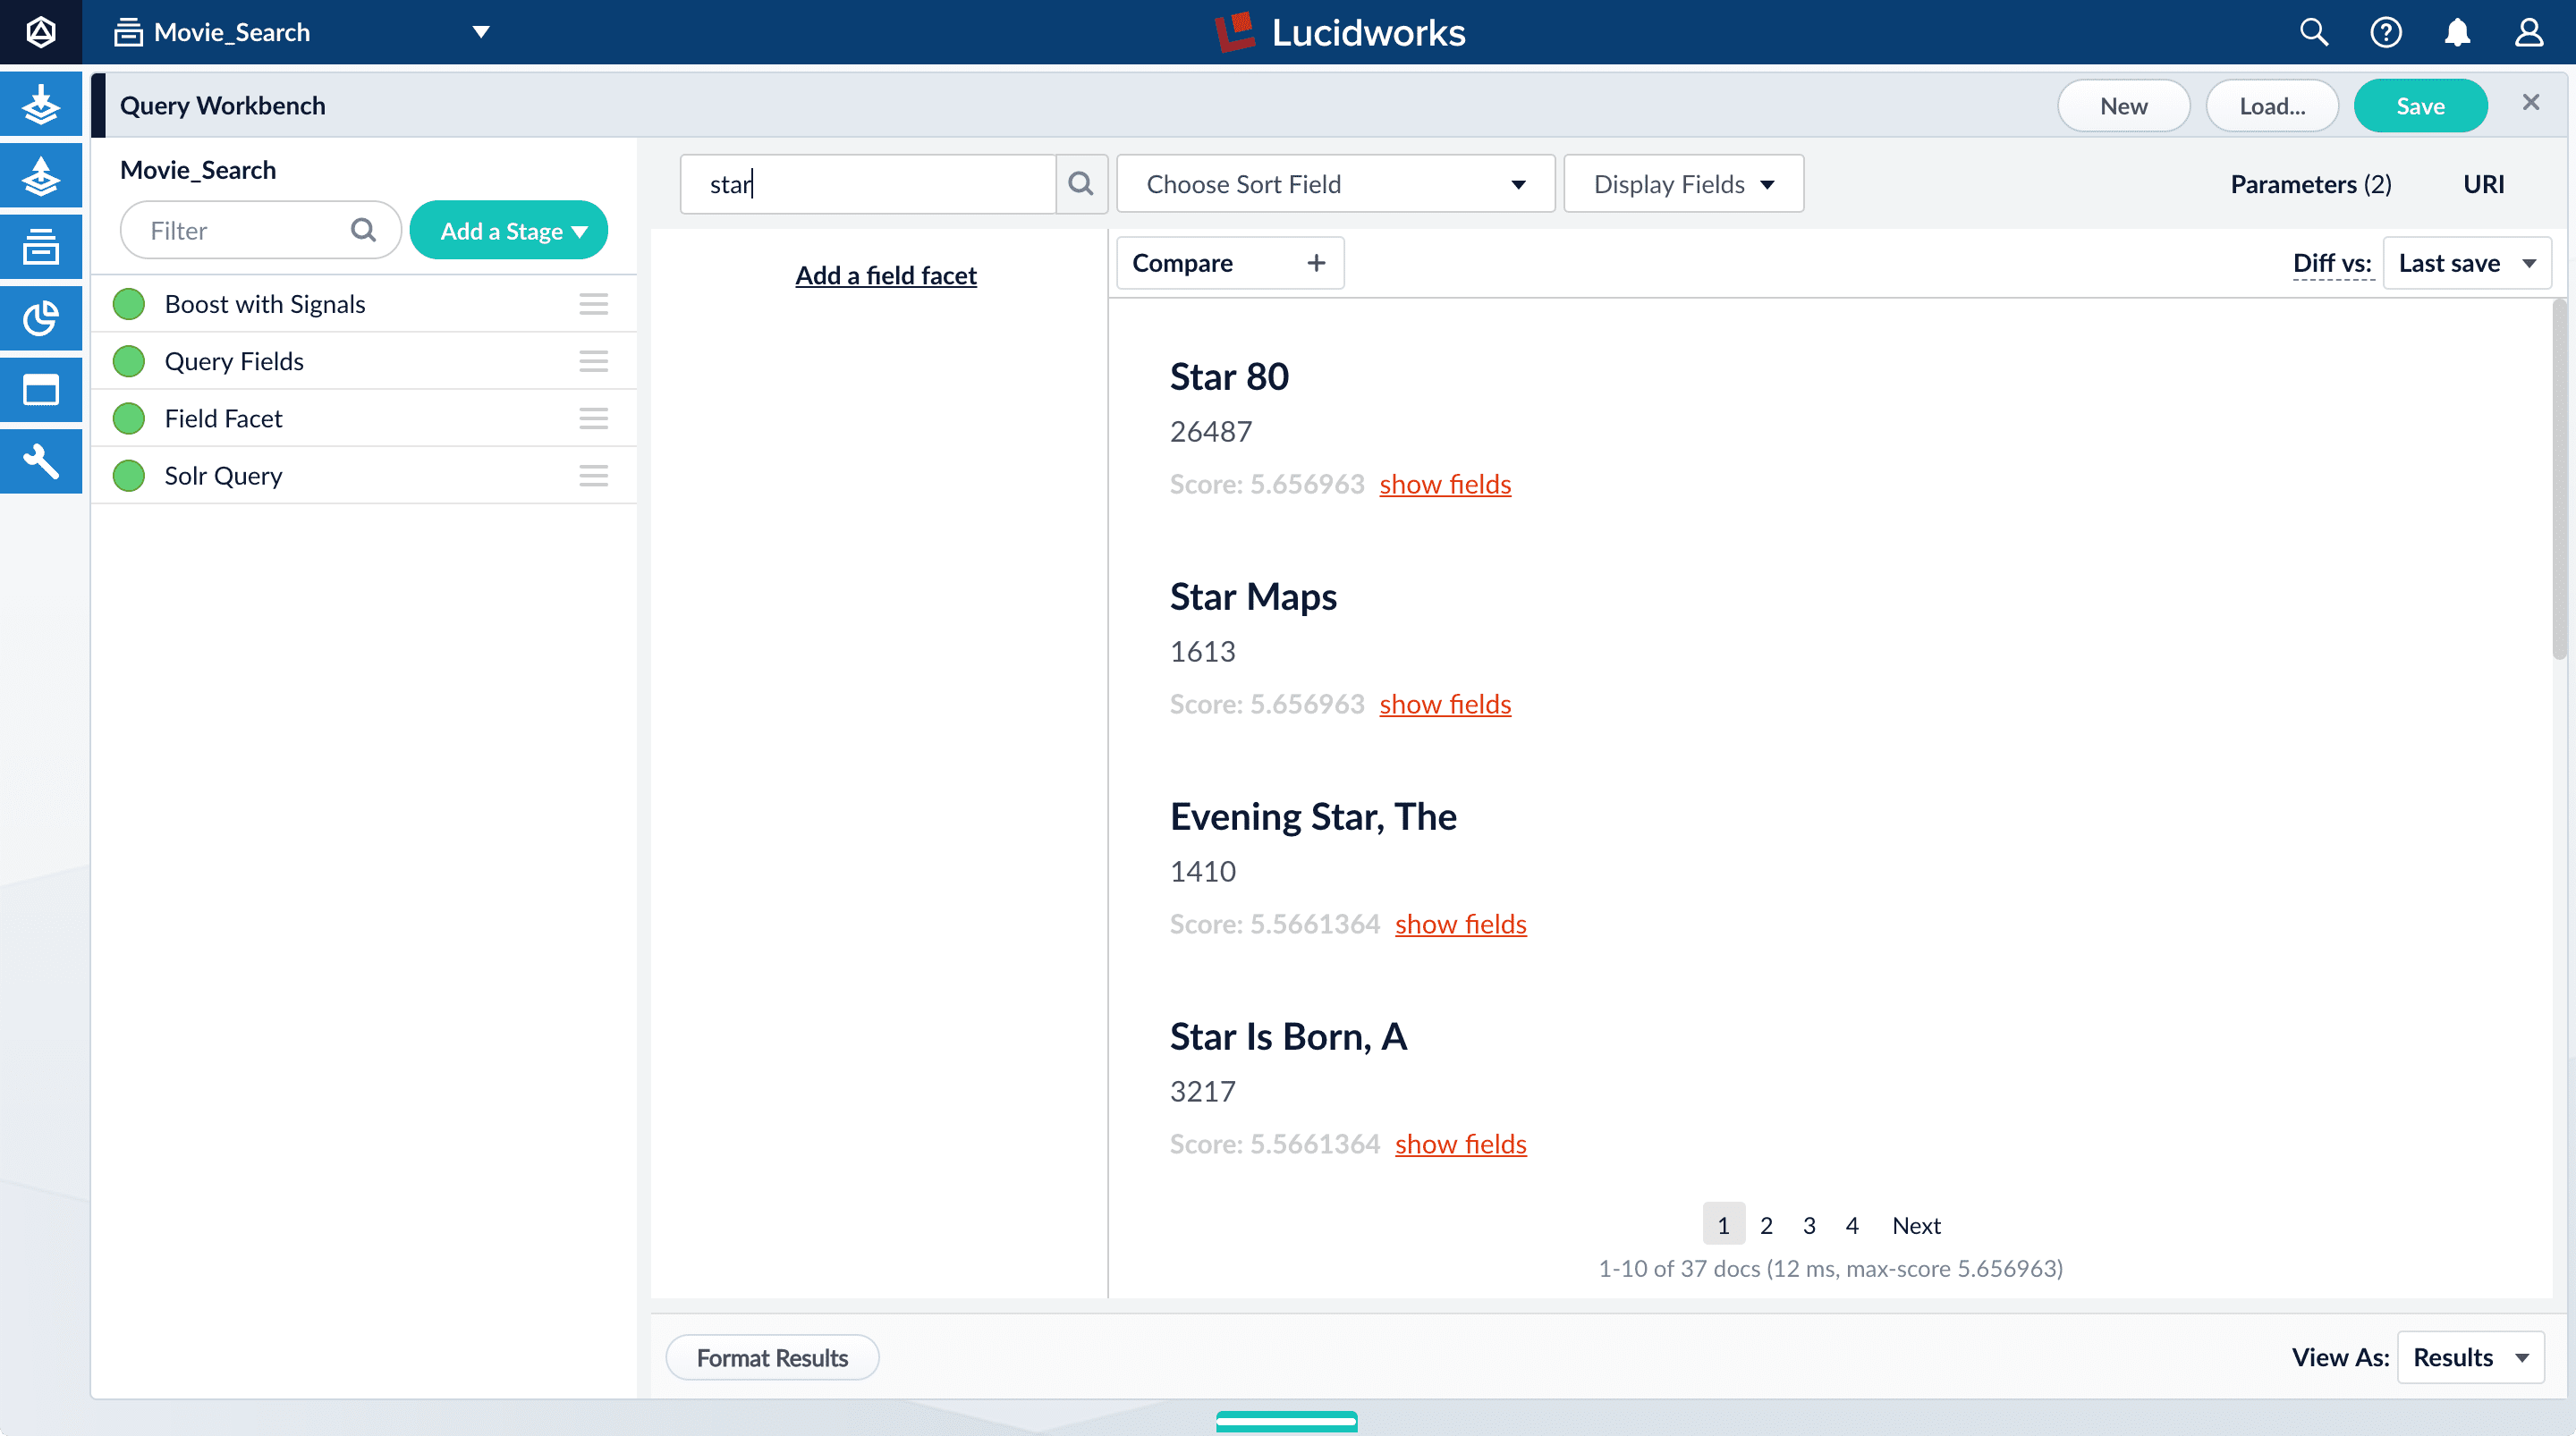
movie-search.
To see more of the default output, you can perform other searches if you like.- In the search box, enter the query string
\*:*to return all documents, and then press Enter or click Search .
Explore the role of query pipeline stages
A default query pipeline consists of the stages below.Some of these support Fusion AI features for advanced relevancy tuning, which you can read about separately.In this tutorial, we will configure a couple of the basic stages:- Boost with Signals. Use signals data to boost relevant documents.
- Query Fields. Specify the set of fields over which to search. We will configure this stage later in this tutorial.
- Field Facet. Specify the fields to use for faceting. We will configure this stage, too, for basic faceting and range faceting.
- Text Tagger. Look for known phrases, synonyms, misspellings, and so on, that can be used to improve the query with query rewriting.
- Apply Rules. Modify the query using business rules, if any are triggered.
- Solr Query. Perform the query and return the results. This is the only stage that is always required to perform a query and receive results.
- Modify Response with Rules. Modify Solr’s response using business rules, if any are triggered.
-
Turn off the Solr Query stage by clicking on the green circle on the left. The circle will change to white and Solr Query will dim to indicate the Solr Query stage is off.
-
Turn on the Solr Query stage and turn all other stages off.
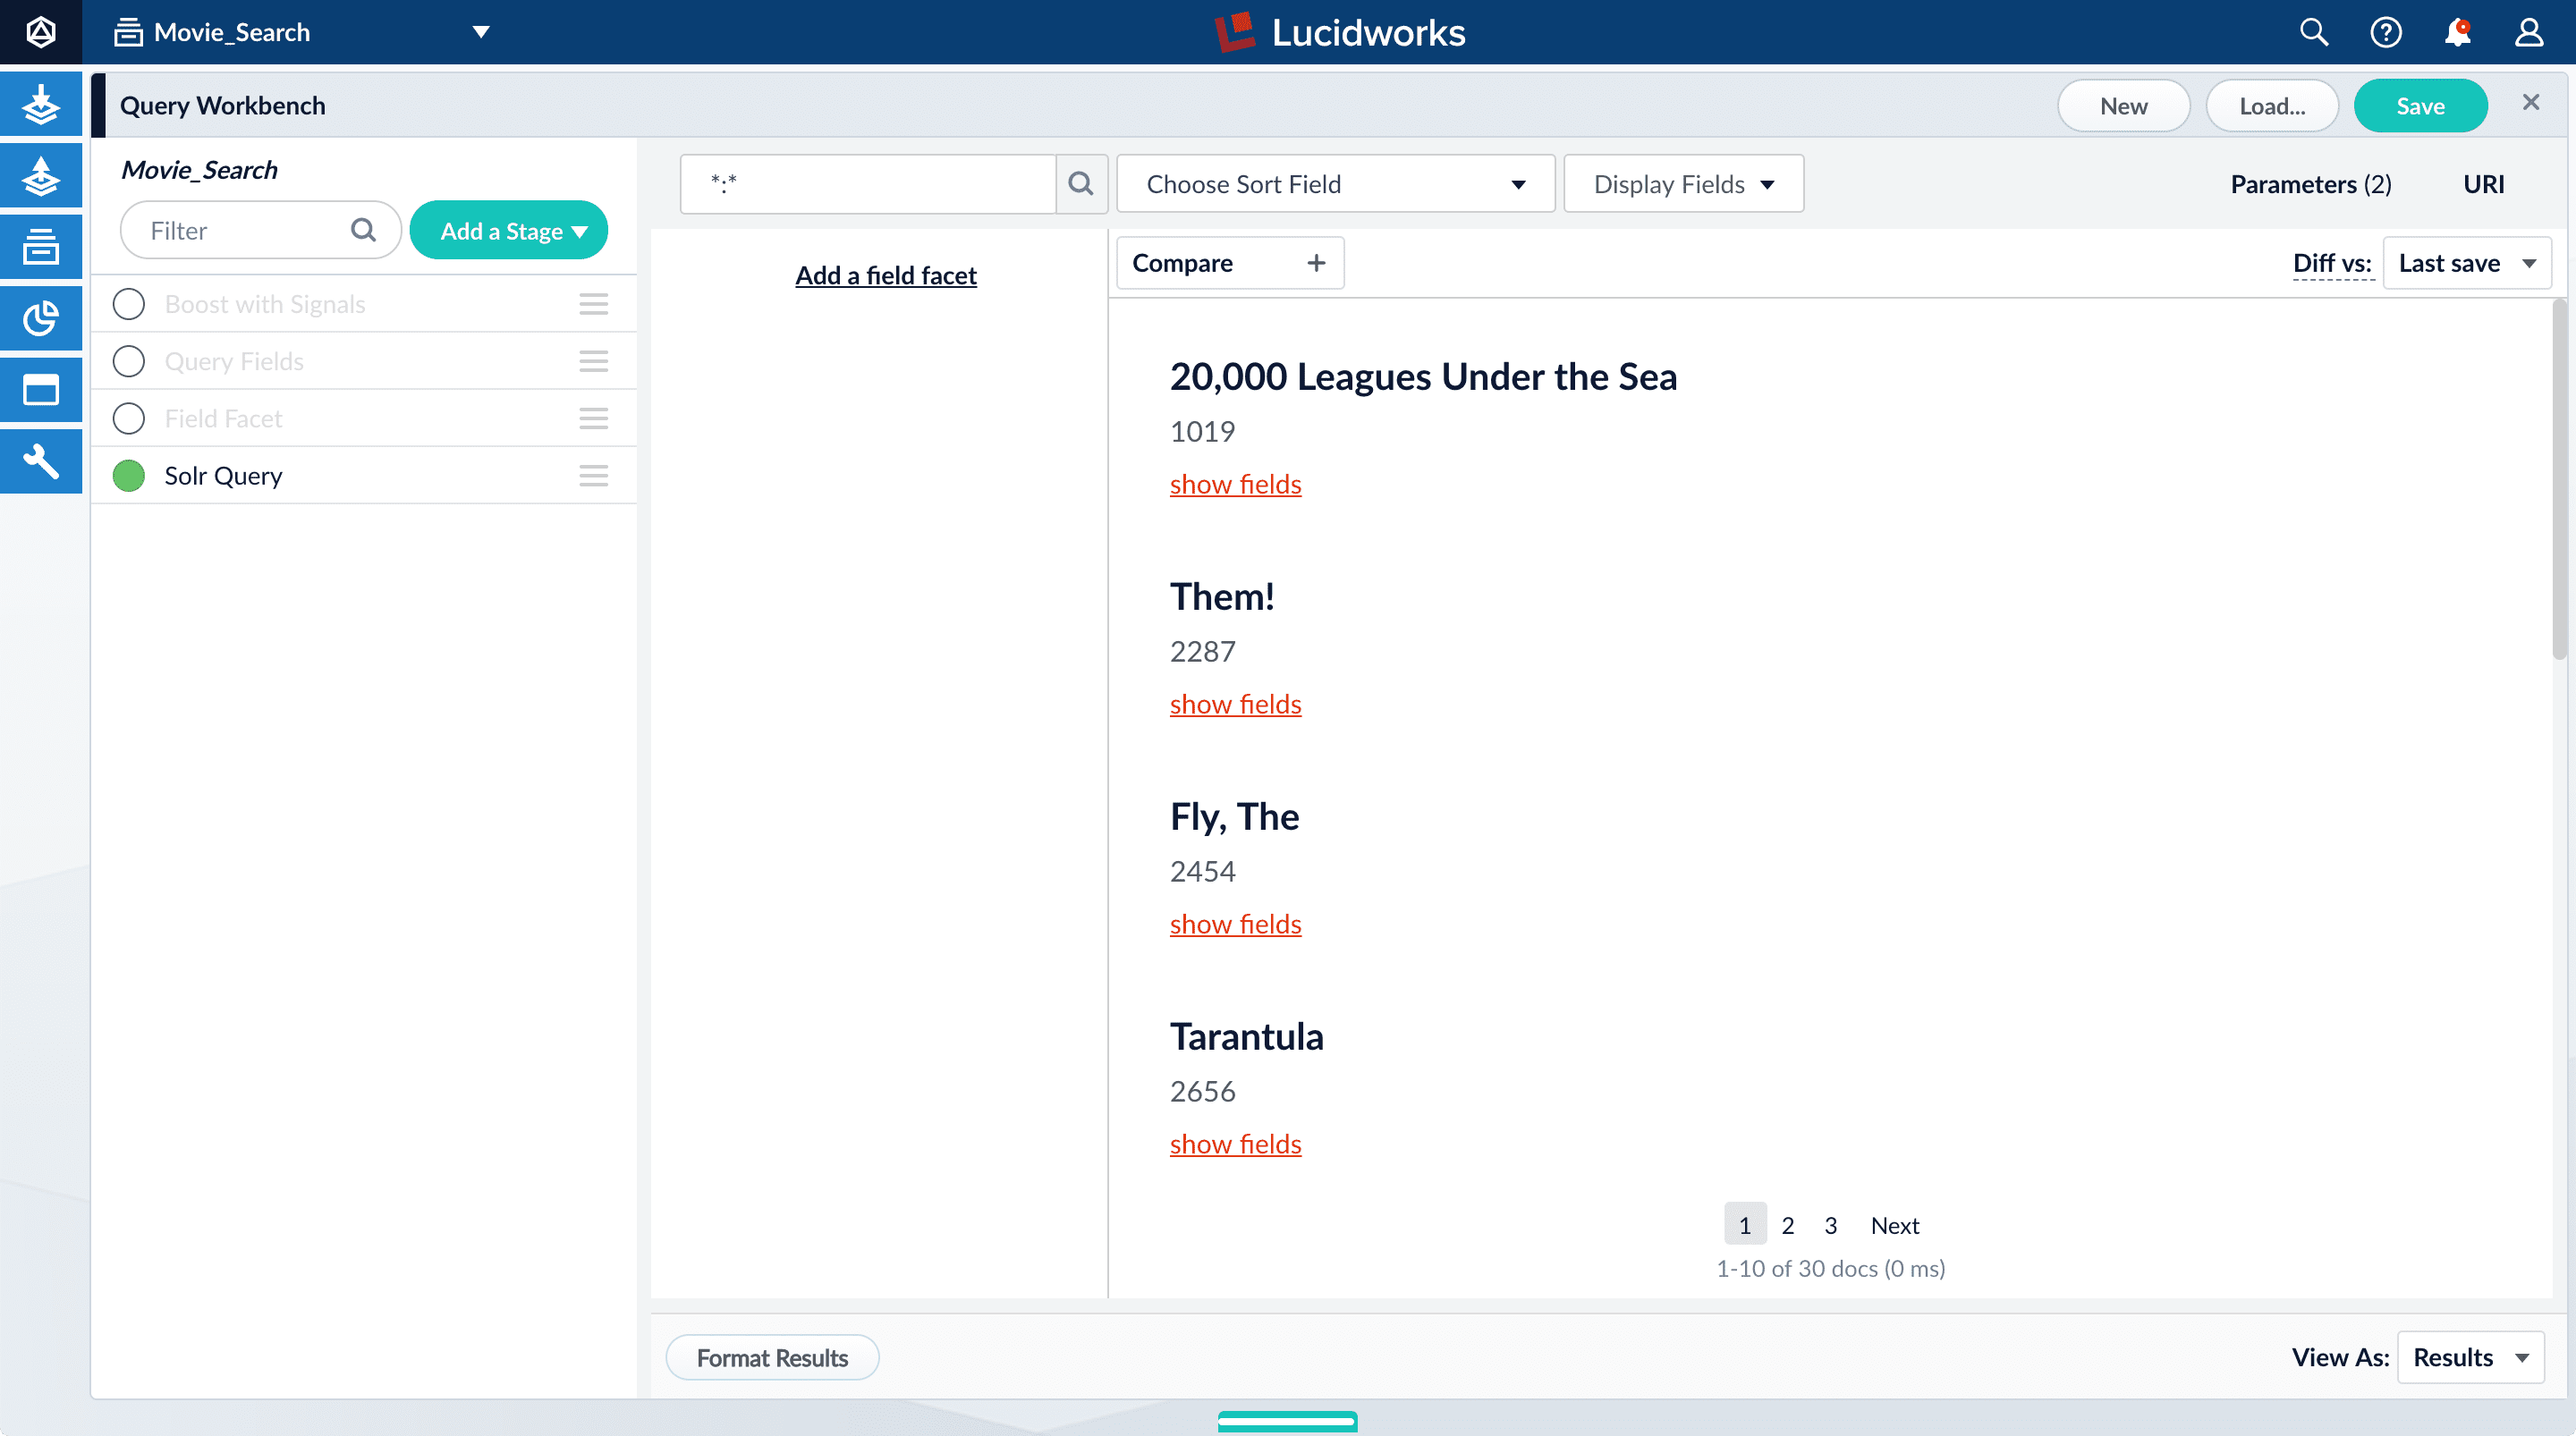
- Turn all stages on.
Configure faceting
Facets are the ubiquitous, dynamic lists of categories or features offered as filters within a search results page. Facets provide a simple way for users to explore and filter their search results without having to construct complicated queries. You configure facets as a part of configuring a query pipeline.The data you indexed in Part 1 has two fields that are natural choices for faceting:genres_ss and year_i. For example, a user could search for science fiction of the 1950s in just a few clicks.Configure basic faceting for genres
Thegenres_ss field is ready for faceting as-is.-
Click Add a field facet and select the
genres_ssfield.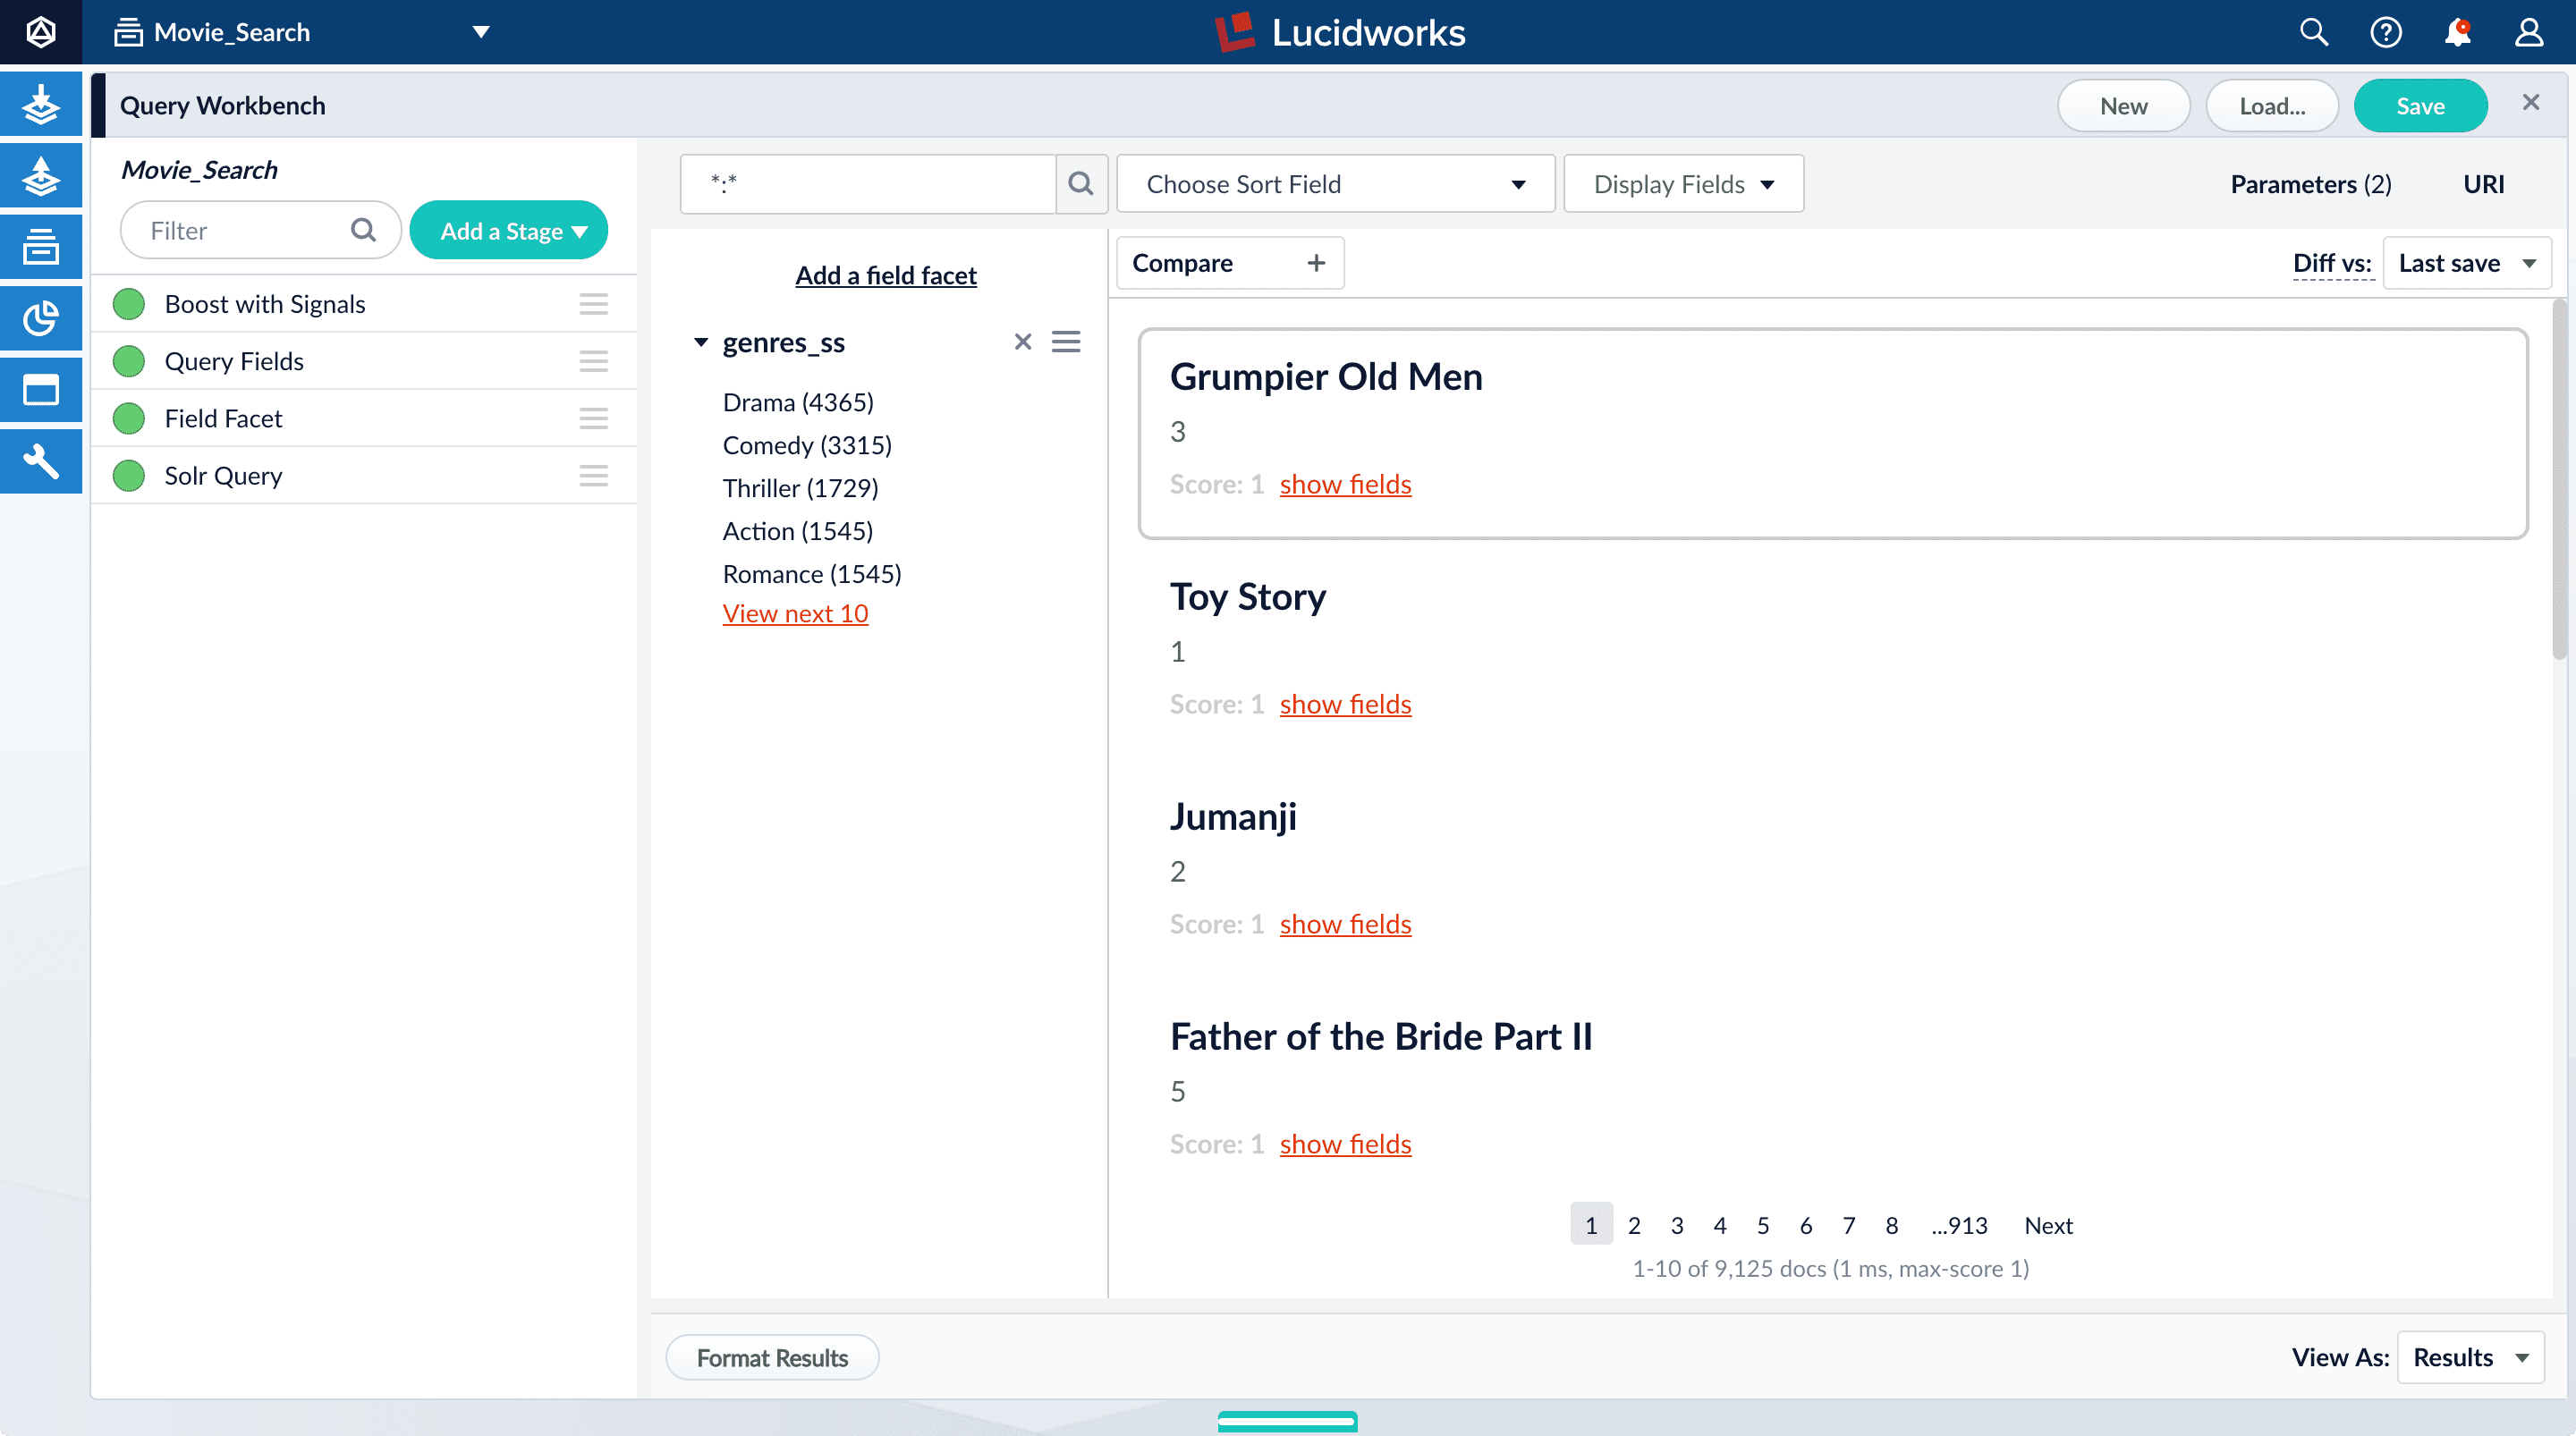
-
Click Sci-Fi to select movies that have the value
Sci-Fiforgenres_ss:
- Under the field facet genres_ss, click Clear all.
Configure range faceting for years
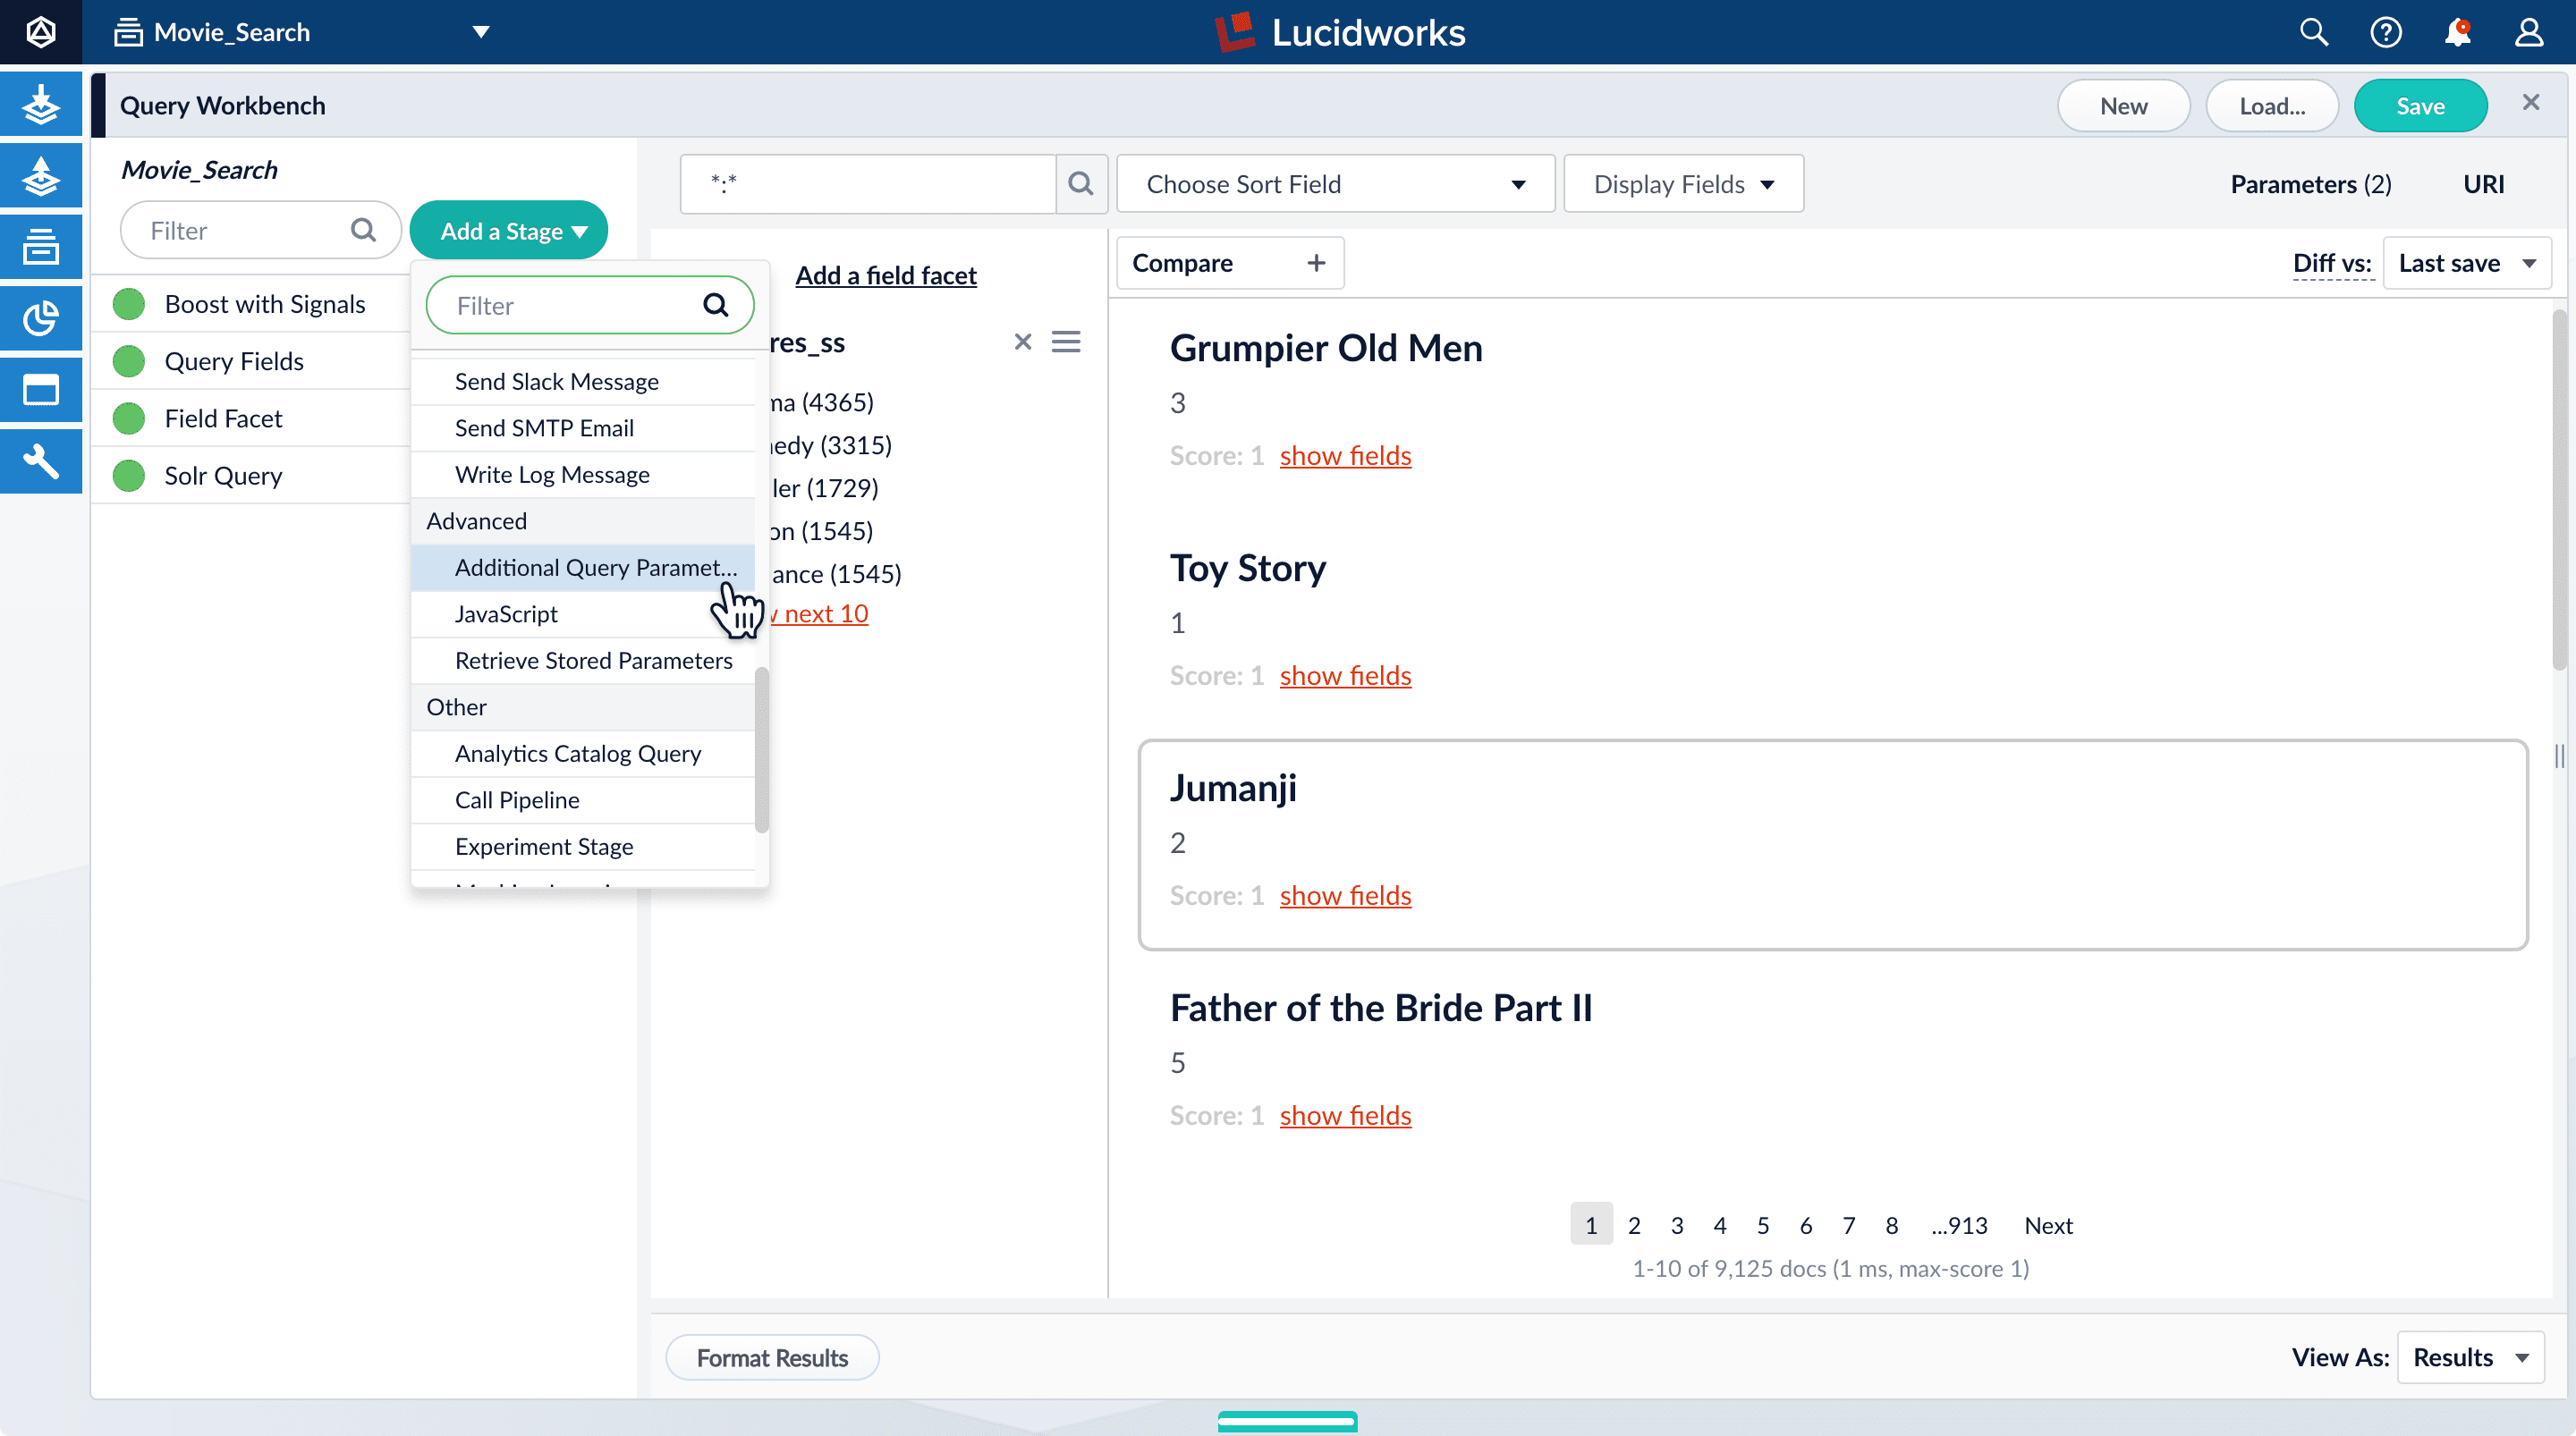
If you were to just configure faceting for theyear_i field as you did above for the genres_ss field, you would get one facet per year, which is not very useful.But the year_i field will be more usable if you configure range faceting. Range faceting is a way of grouping values together so that the user can select a value range instead of one specific value. For example, range facets are commonly used with pricing (100) or ratings (4 stars or higher). Here, we group years by decade.Range faceting requires sending an additional query parameter to Fusion’s Solr core. You can configure this with the Additional Query Parameters stage. In this case, you will use several of Solr’s range facet query parameters.Use the Additional Query Parameters stage to configure range faceting for the year_i field:- Click Add a stage.
-
Scroll down under Advanced and select Additional Query Parameters.
-
Under Parameters and Values, add the following parameter names and values:
In this case, you do not need to modify the Update Policy field; the default value of
Parameter Name Parameter Value facet.rangeyear_ifacet.range.start1900facet.range.end2020facet.range.gap10facet.range.includeouterappendis fine. -
Click Apply, and then Cancel (which just closes the configuration panel for the Additional Query Parameters stage).
The year facets are now grouped by decade:
Configure query fields
In this section, you will see why it is useful to specify which fields Fusion should use to match a query.-
Search for “2001”.
The results are not what an end user might expect:
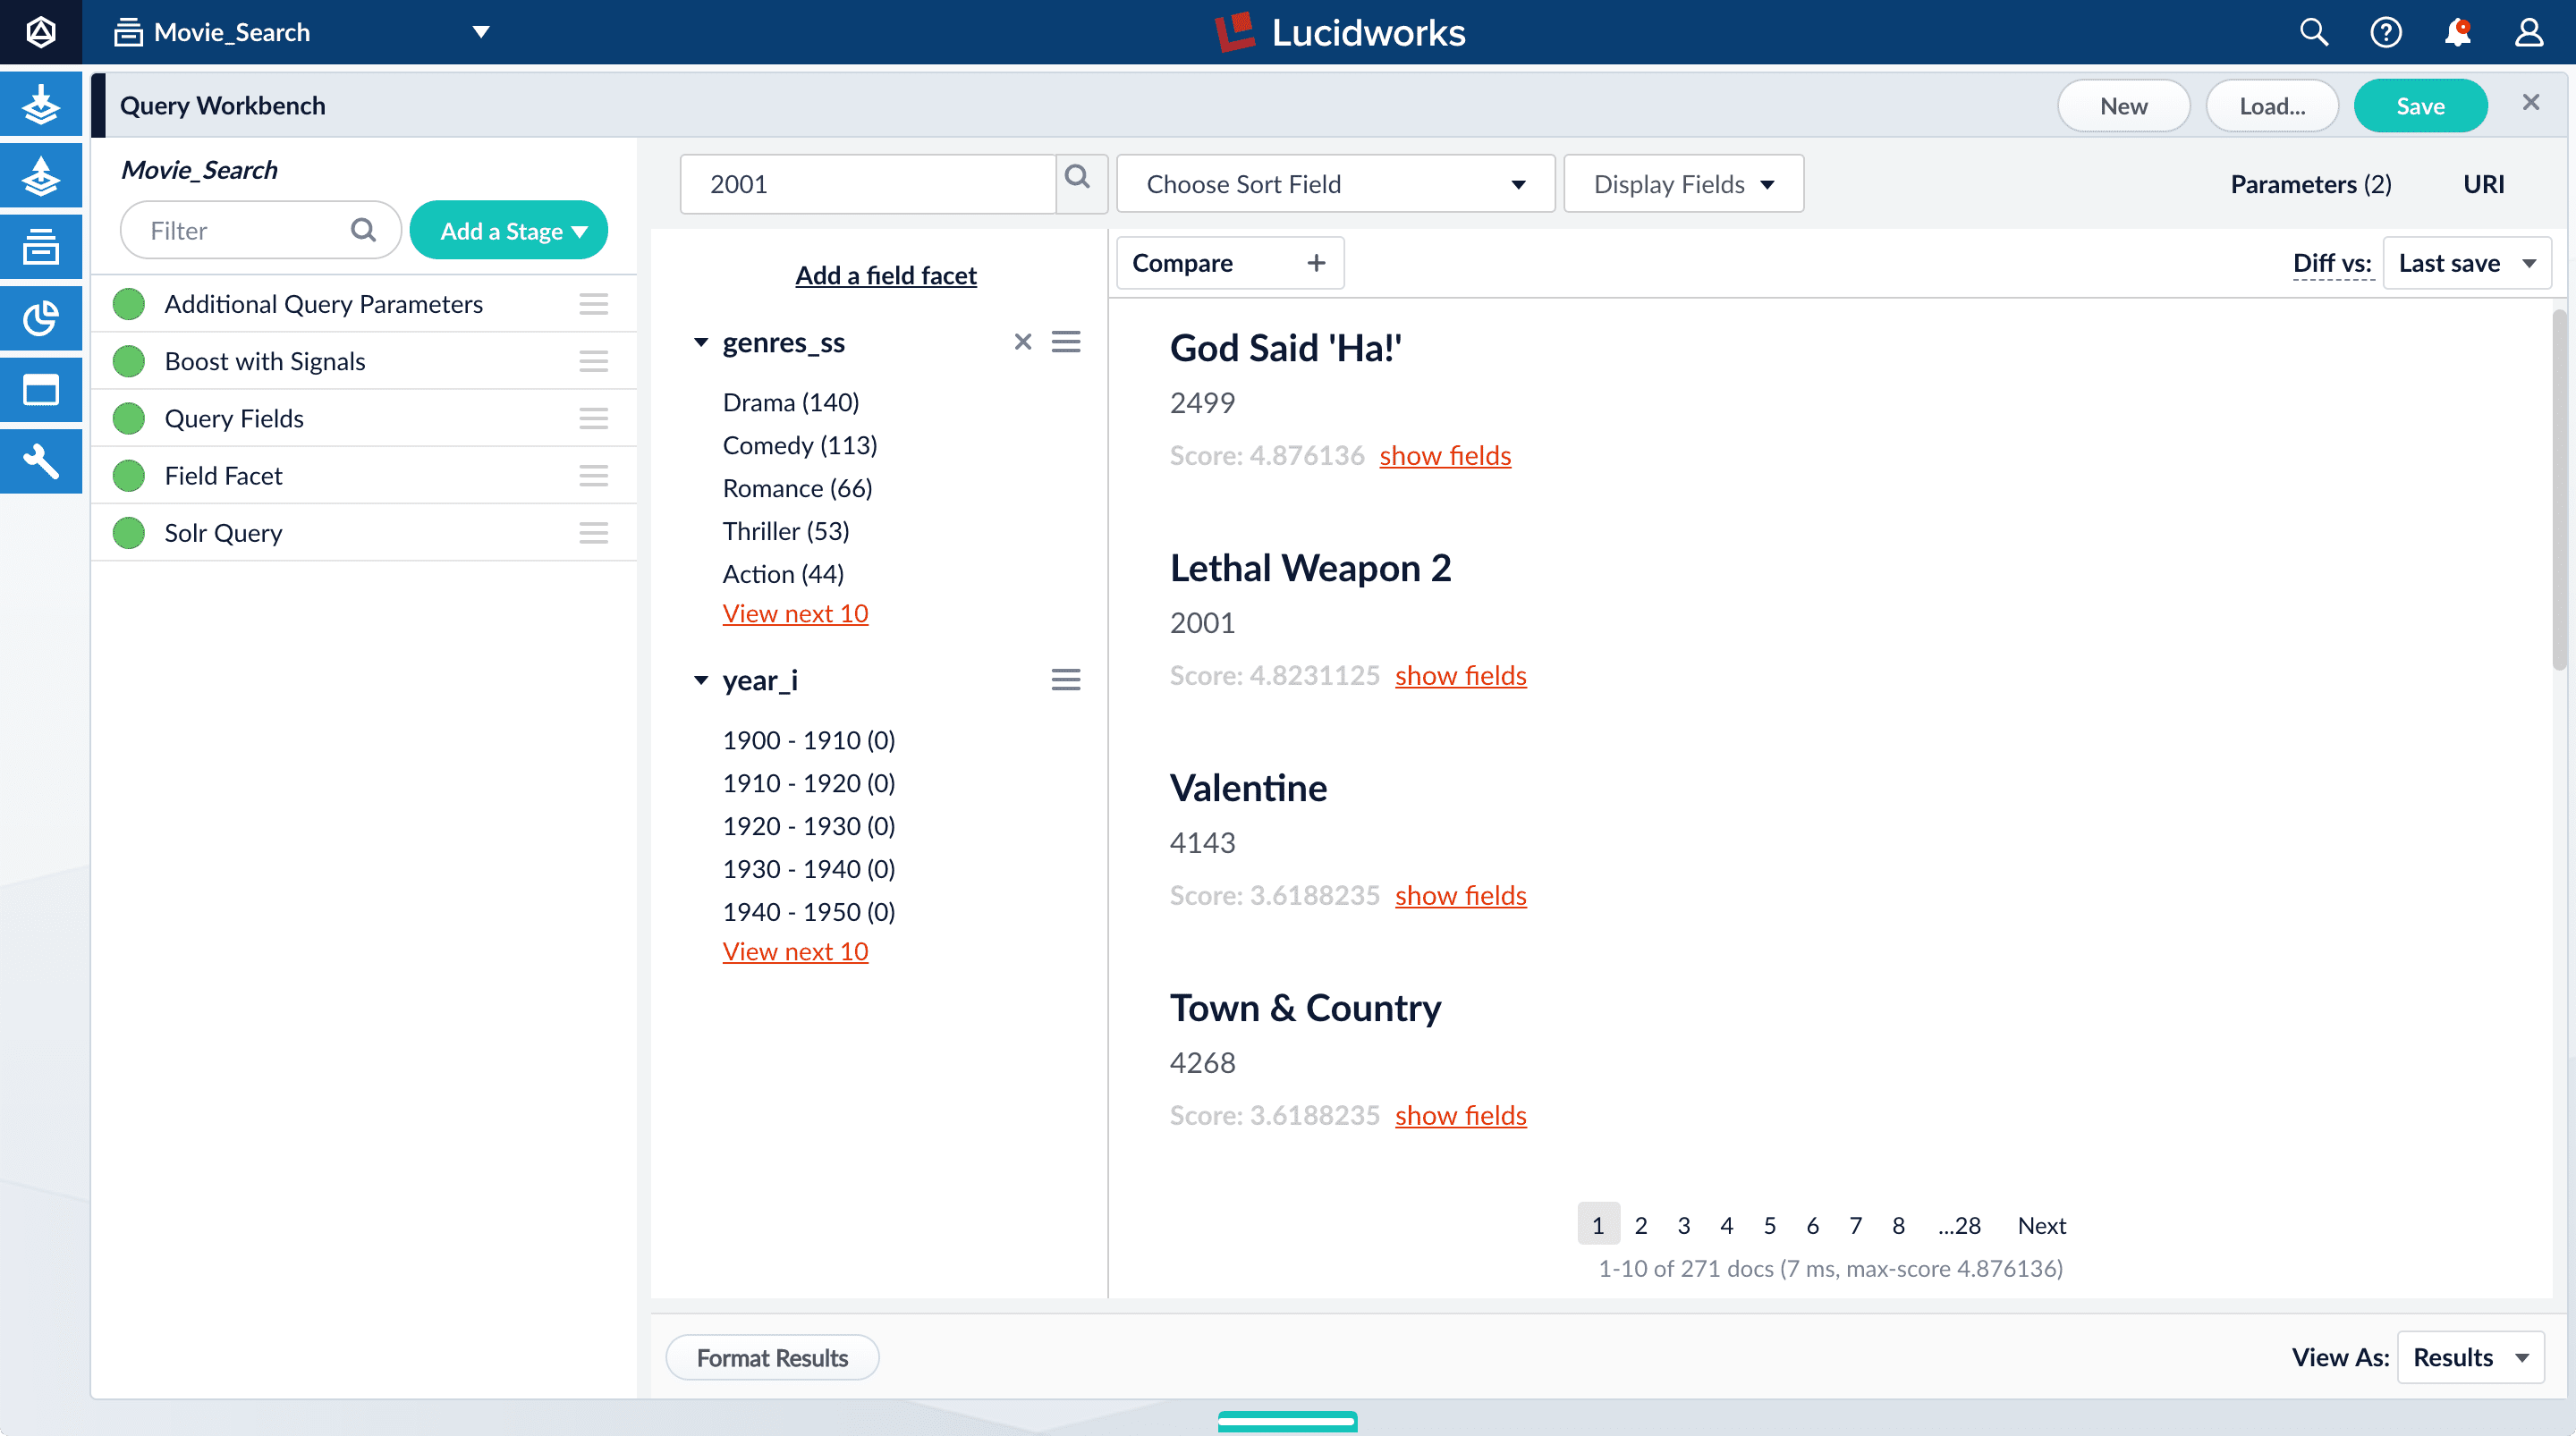
-
Under one of the movies listed, click show fields.
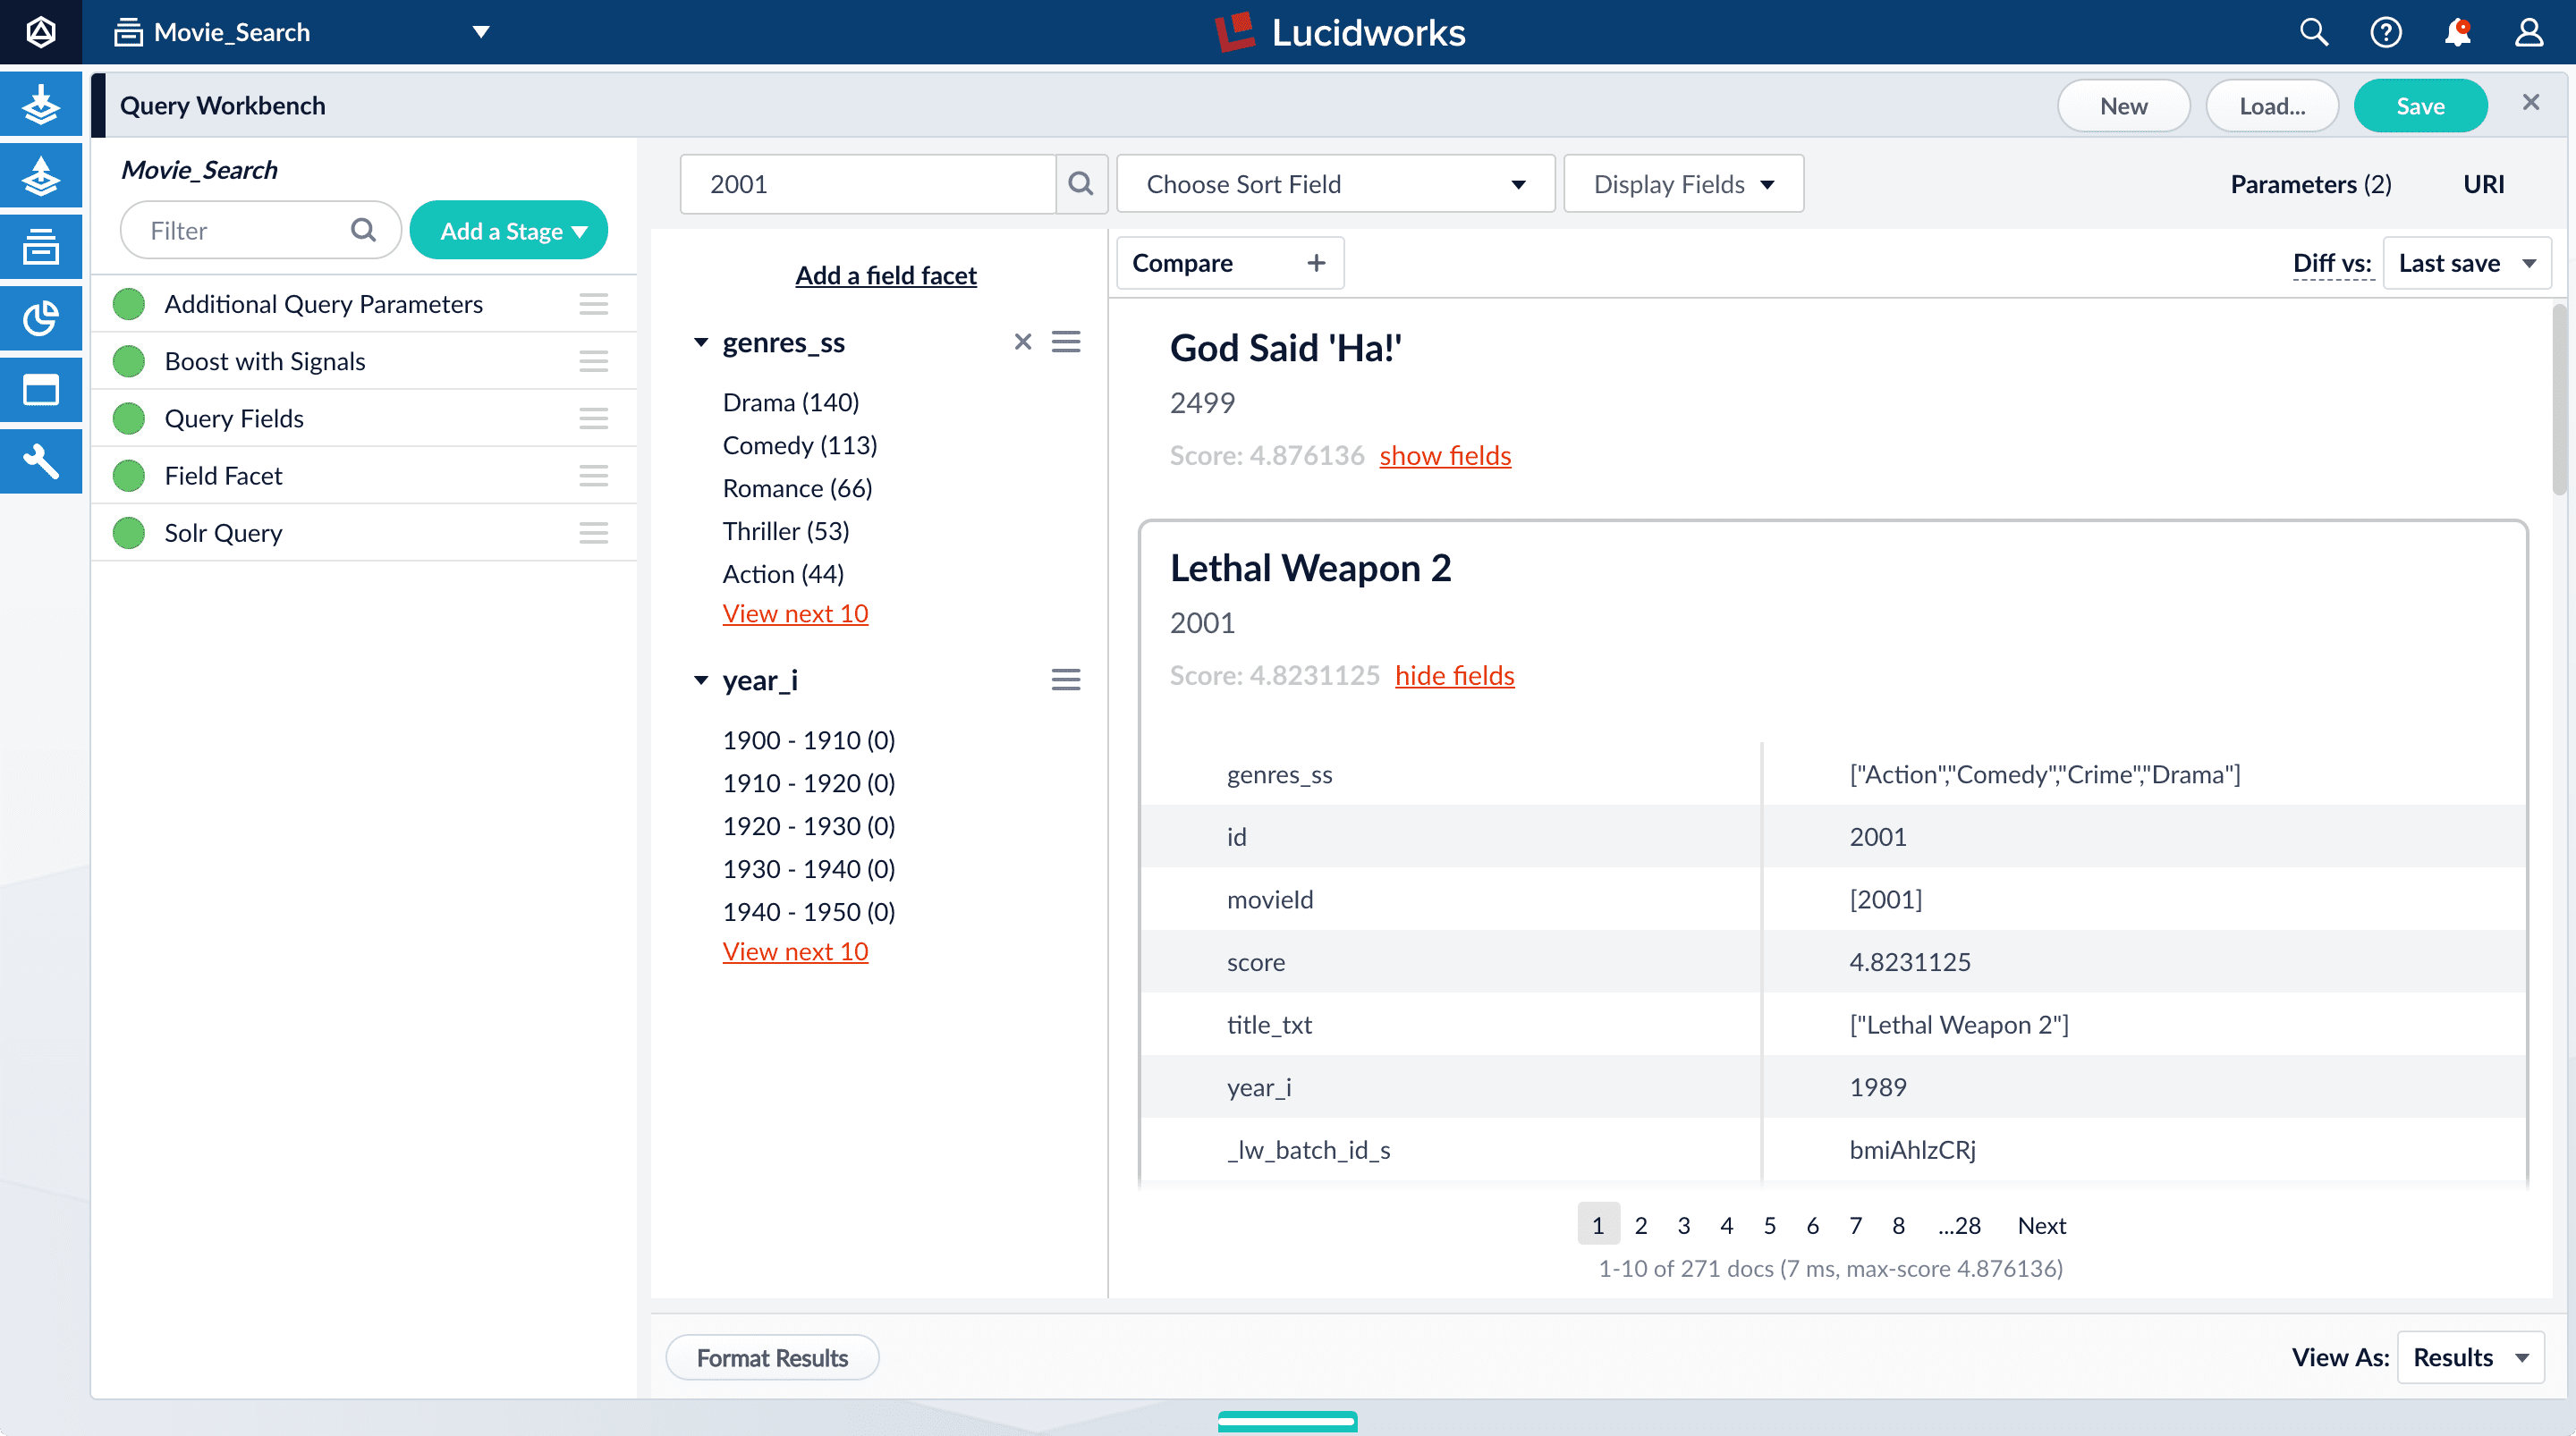
idfield, but users do not care about this field. You will use the Query Fields stage to specify the fields that users really care about. - Below the name for the movie you selected, click hide fields.
- Click the Query Fields stage of the query pipeline. The Query Fields configuration panel appears.
- Under Search Fields, click Add .
-
Enter
title_txt. - Click Add again.
-
Enter
year_i. -
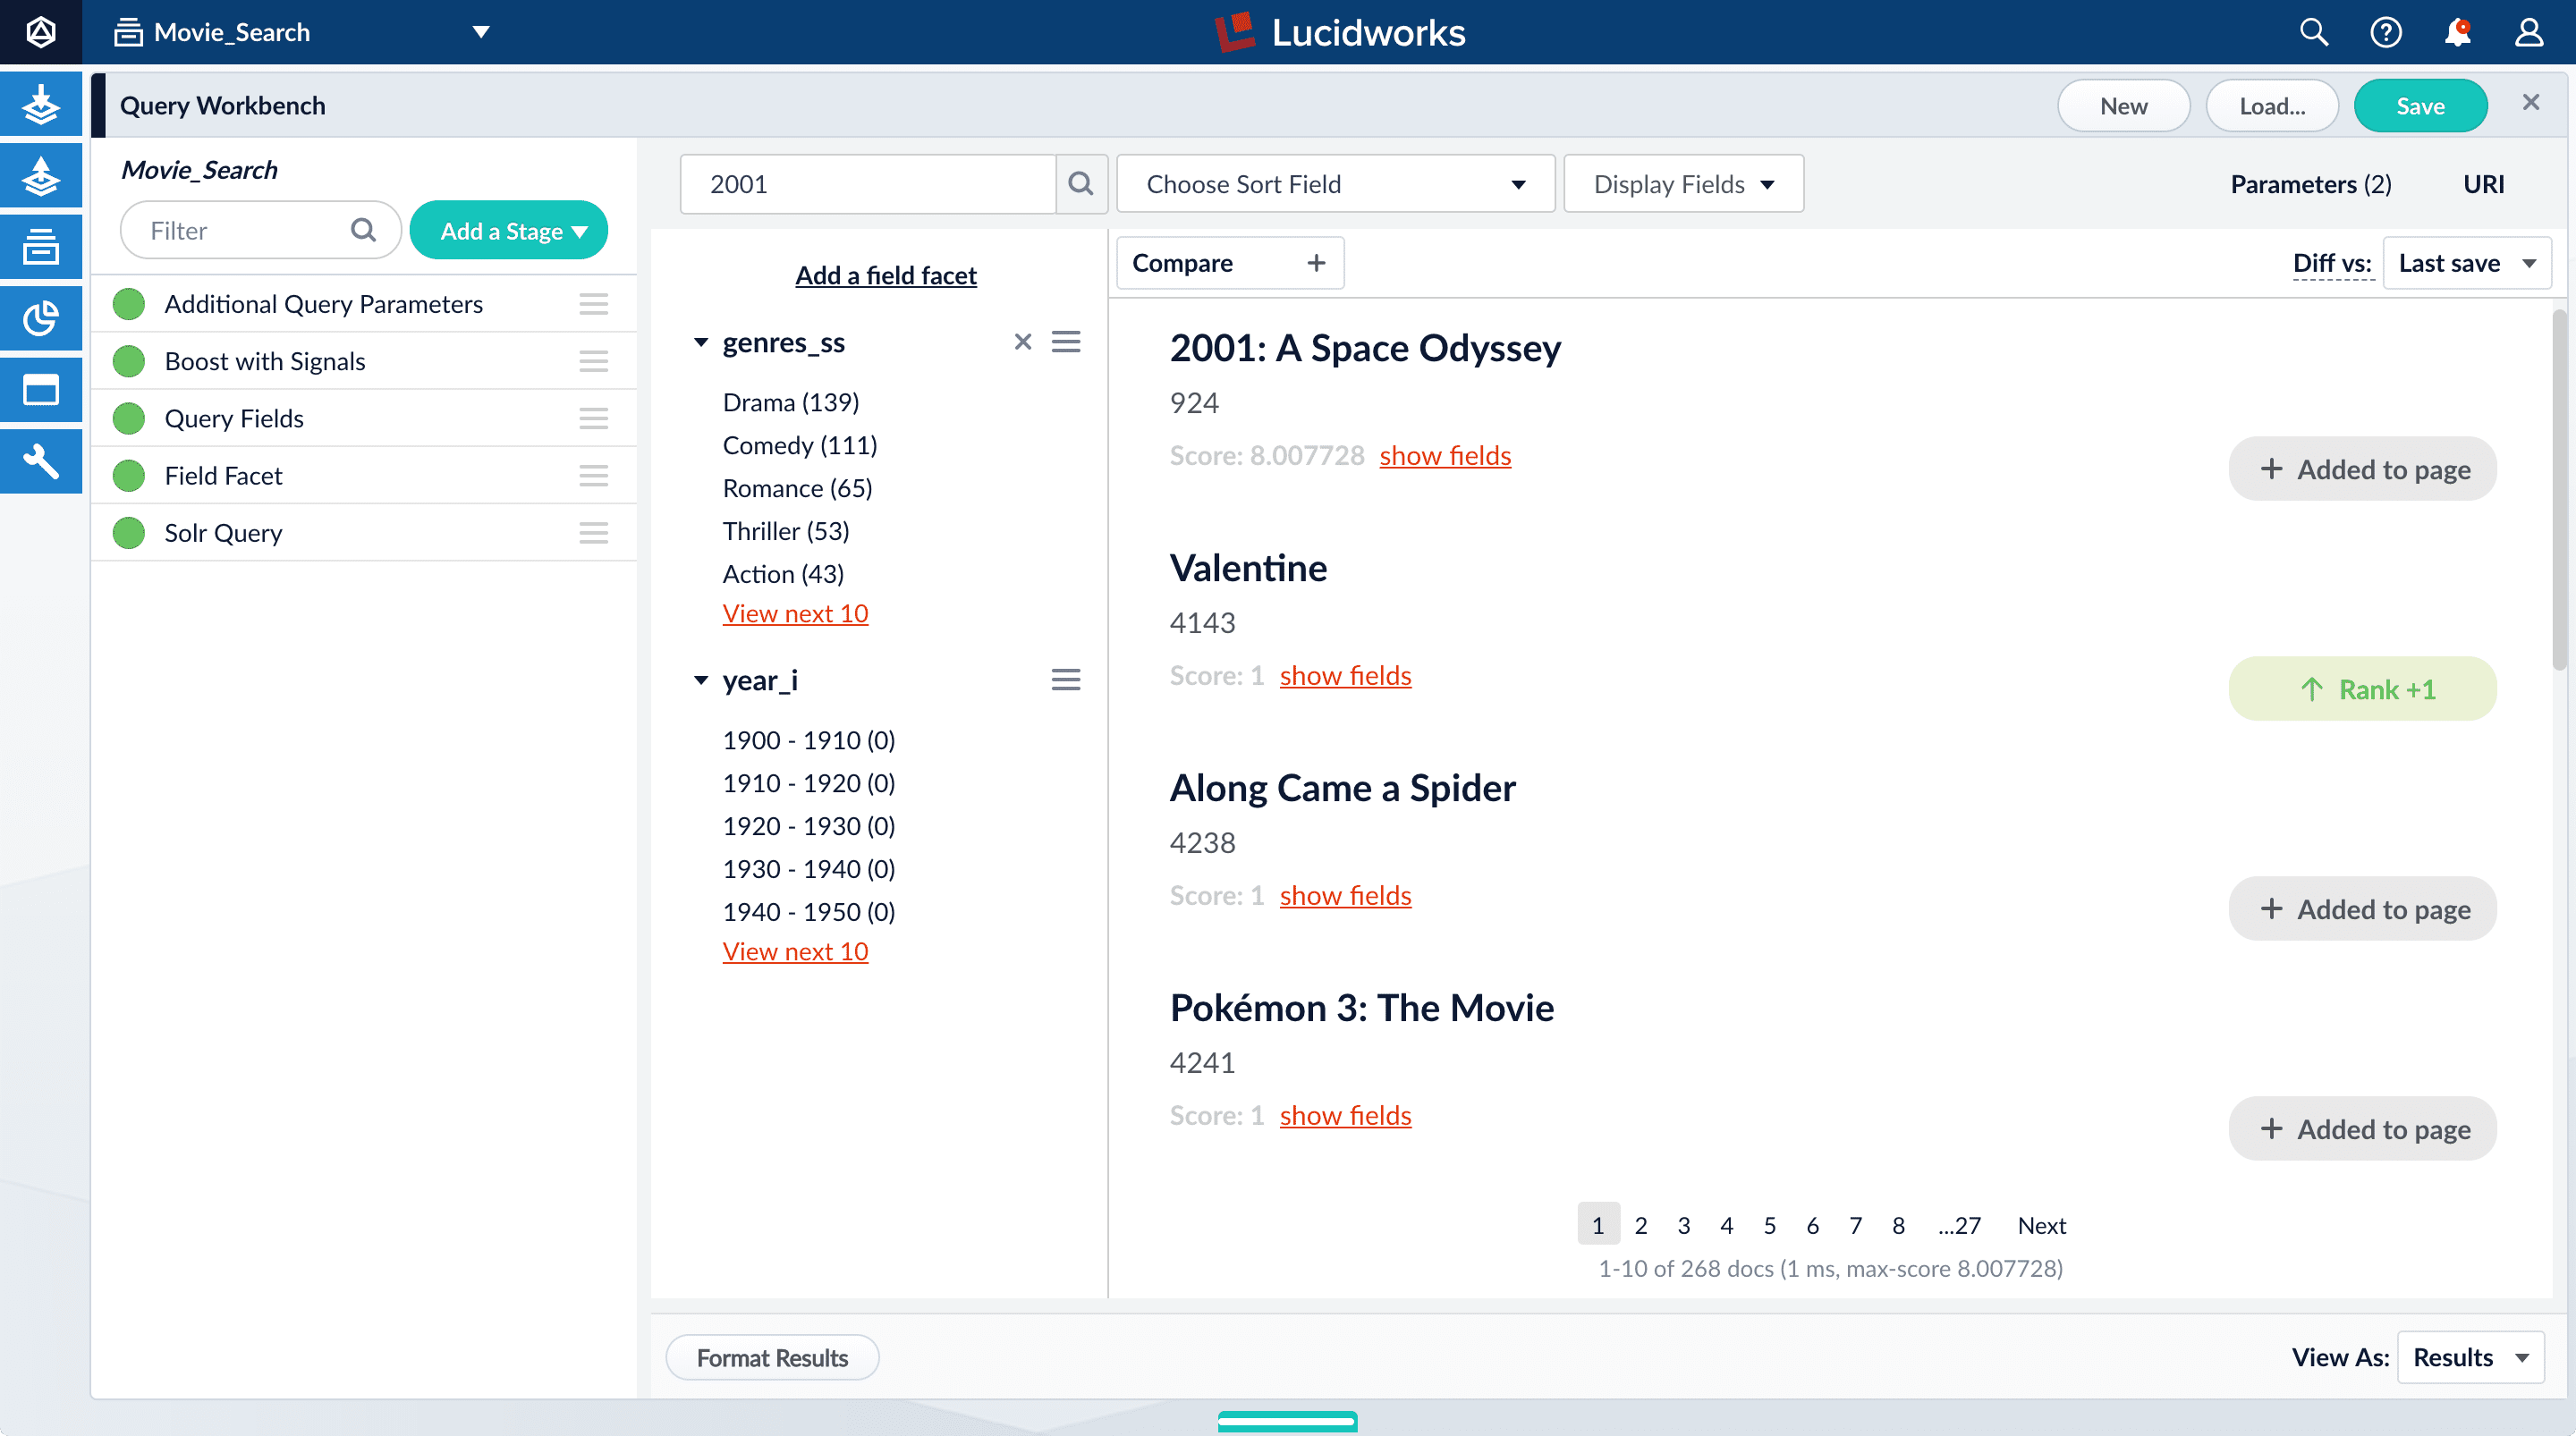
Click Apply, and then Cancel (which just closes the configuration panel for the Query Fields stage).
Now movies with ‘2001’ in their title rise to the top of your search results, followed by films made in the year 2001:
Save the query pipeline configuration
- In the upper right, click Save. The Save Pipeline window appears. By default, you will overwrite the default query pipeline for this datasource.
- Click Save pipeline.
What is next
With just two facet fields combined with keyword search, this prototype is already beginning to feel like a real search application.In Part 4, you will enable signals, generate some signal data, aggregate it, and search it to see what it looks like. Signals can be used for recommendations or boosting.Part 4: Improve Relevancy
Part 4: Improve Relevancy
Signals are events that can be aggregated and used for automatic boosting or recommendations, which are ways of making search results more relevant.As an example of boosting, the most popular search results for certain queries can be boosted so that they appear first (or at least nearer the top) when other users make similar queries.Similarly for recommendations, click events or purchase events can be collected as signals and used to display “Customers who viewed this also viewed” or “Best-selling holiday items”.In a production environment, users’ actions generate signals. For the purposes of this tutorial, you will use Query Workbench to generate click signals.
Refining Search Results
The learning path for Refining Search Results focuses on the Fusion features that help you maximize the relevancy of your search results.
Before you begin
To proceed with this part of the tutorial, you must first complete Part 1, Part 2, and Part 3, which give you an indexed dataset that is configured for faceted search.If the Fusion UI is not already open, then open it.-
In a browser window, open
localhost:8764. -
Enter the password for the user
admin, and then click Login. The Fusion launcher appears. - Click the Movie Search app. The Fusion workspace appears.
Format display fields
To help you understand the continuity in the next steps, first make sure that some relevant fields are displayed.- Open Query Workbench. Navigate to Querying > Query Workbench.
- At the top right of the page, select Display Fields.
- In the Name field, click the row to reveal a dropdown of possible values.
-
Select
title_txt. You can filter the list of possible values to help you. -
In the Description field, select
id. -
Close the Display Fields window.
- Click Display Fields to close the Display Fields window.
Enable synthetic signals
You need some signal data beyond the few signals you generated while completing Part 3. Because this is a prototype app, users are not generating signals. Instead, you will enable synthetic signals in Query Workbench.- At the bottom of the Query Workbench page, click Format Results.
-
Select Show signal generators and Send click signals.
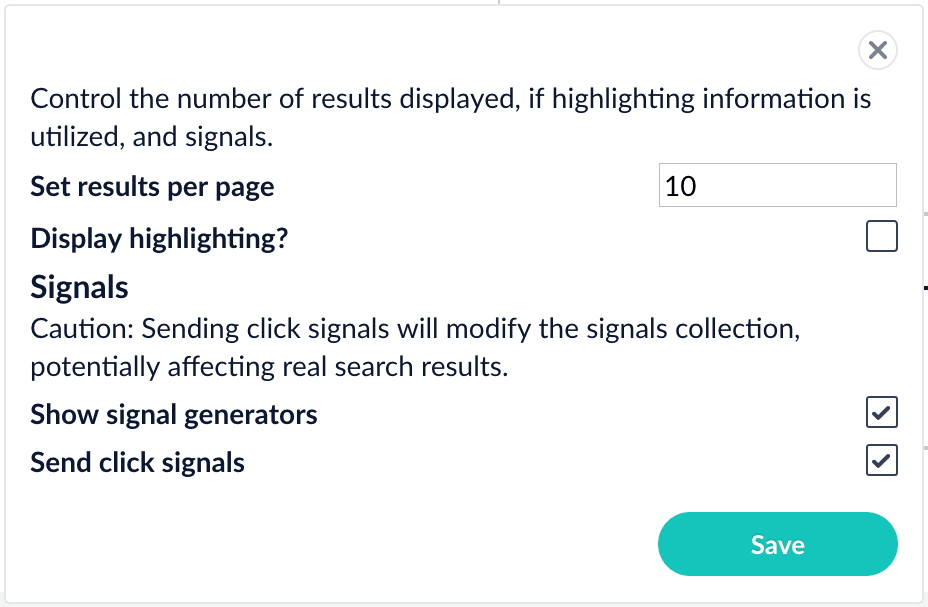
- Click Save.
-
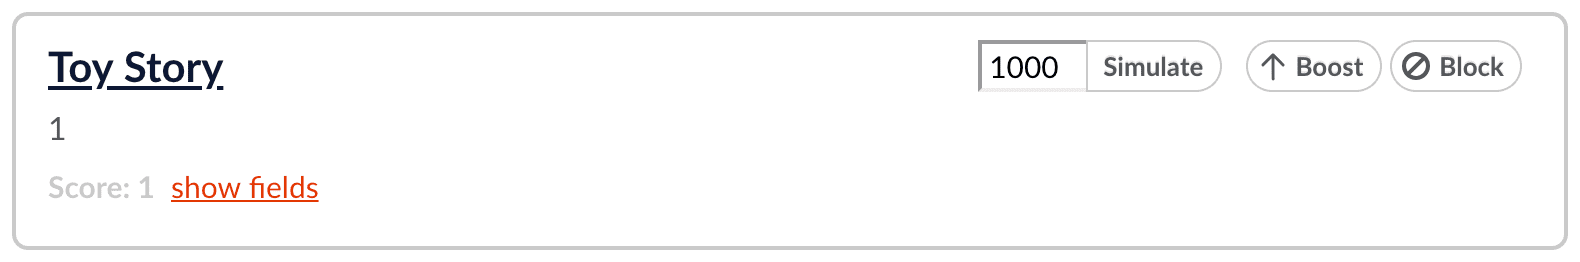
Hover over one of the search results.
Now when you hover over a search result, Query Workbench displays controls that include a Simulate button next to a field that lets you specify the number of signals to simulate:
Generate signals
With synthetic signals enabled, you will generate a simple set of signal data that you can use to generate meaningful recommendations.For this tutorial, you will generate signals that you can use to boost your favorite sci-fi titles so that they appear first.-
Search for
star wars. The top results are not your favorite titles: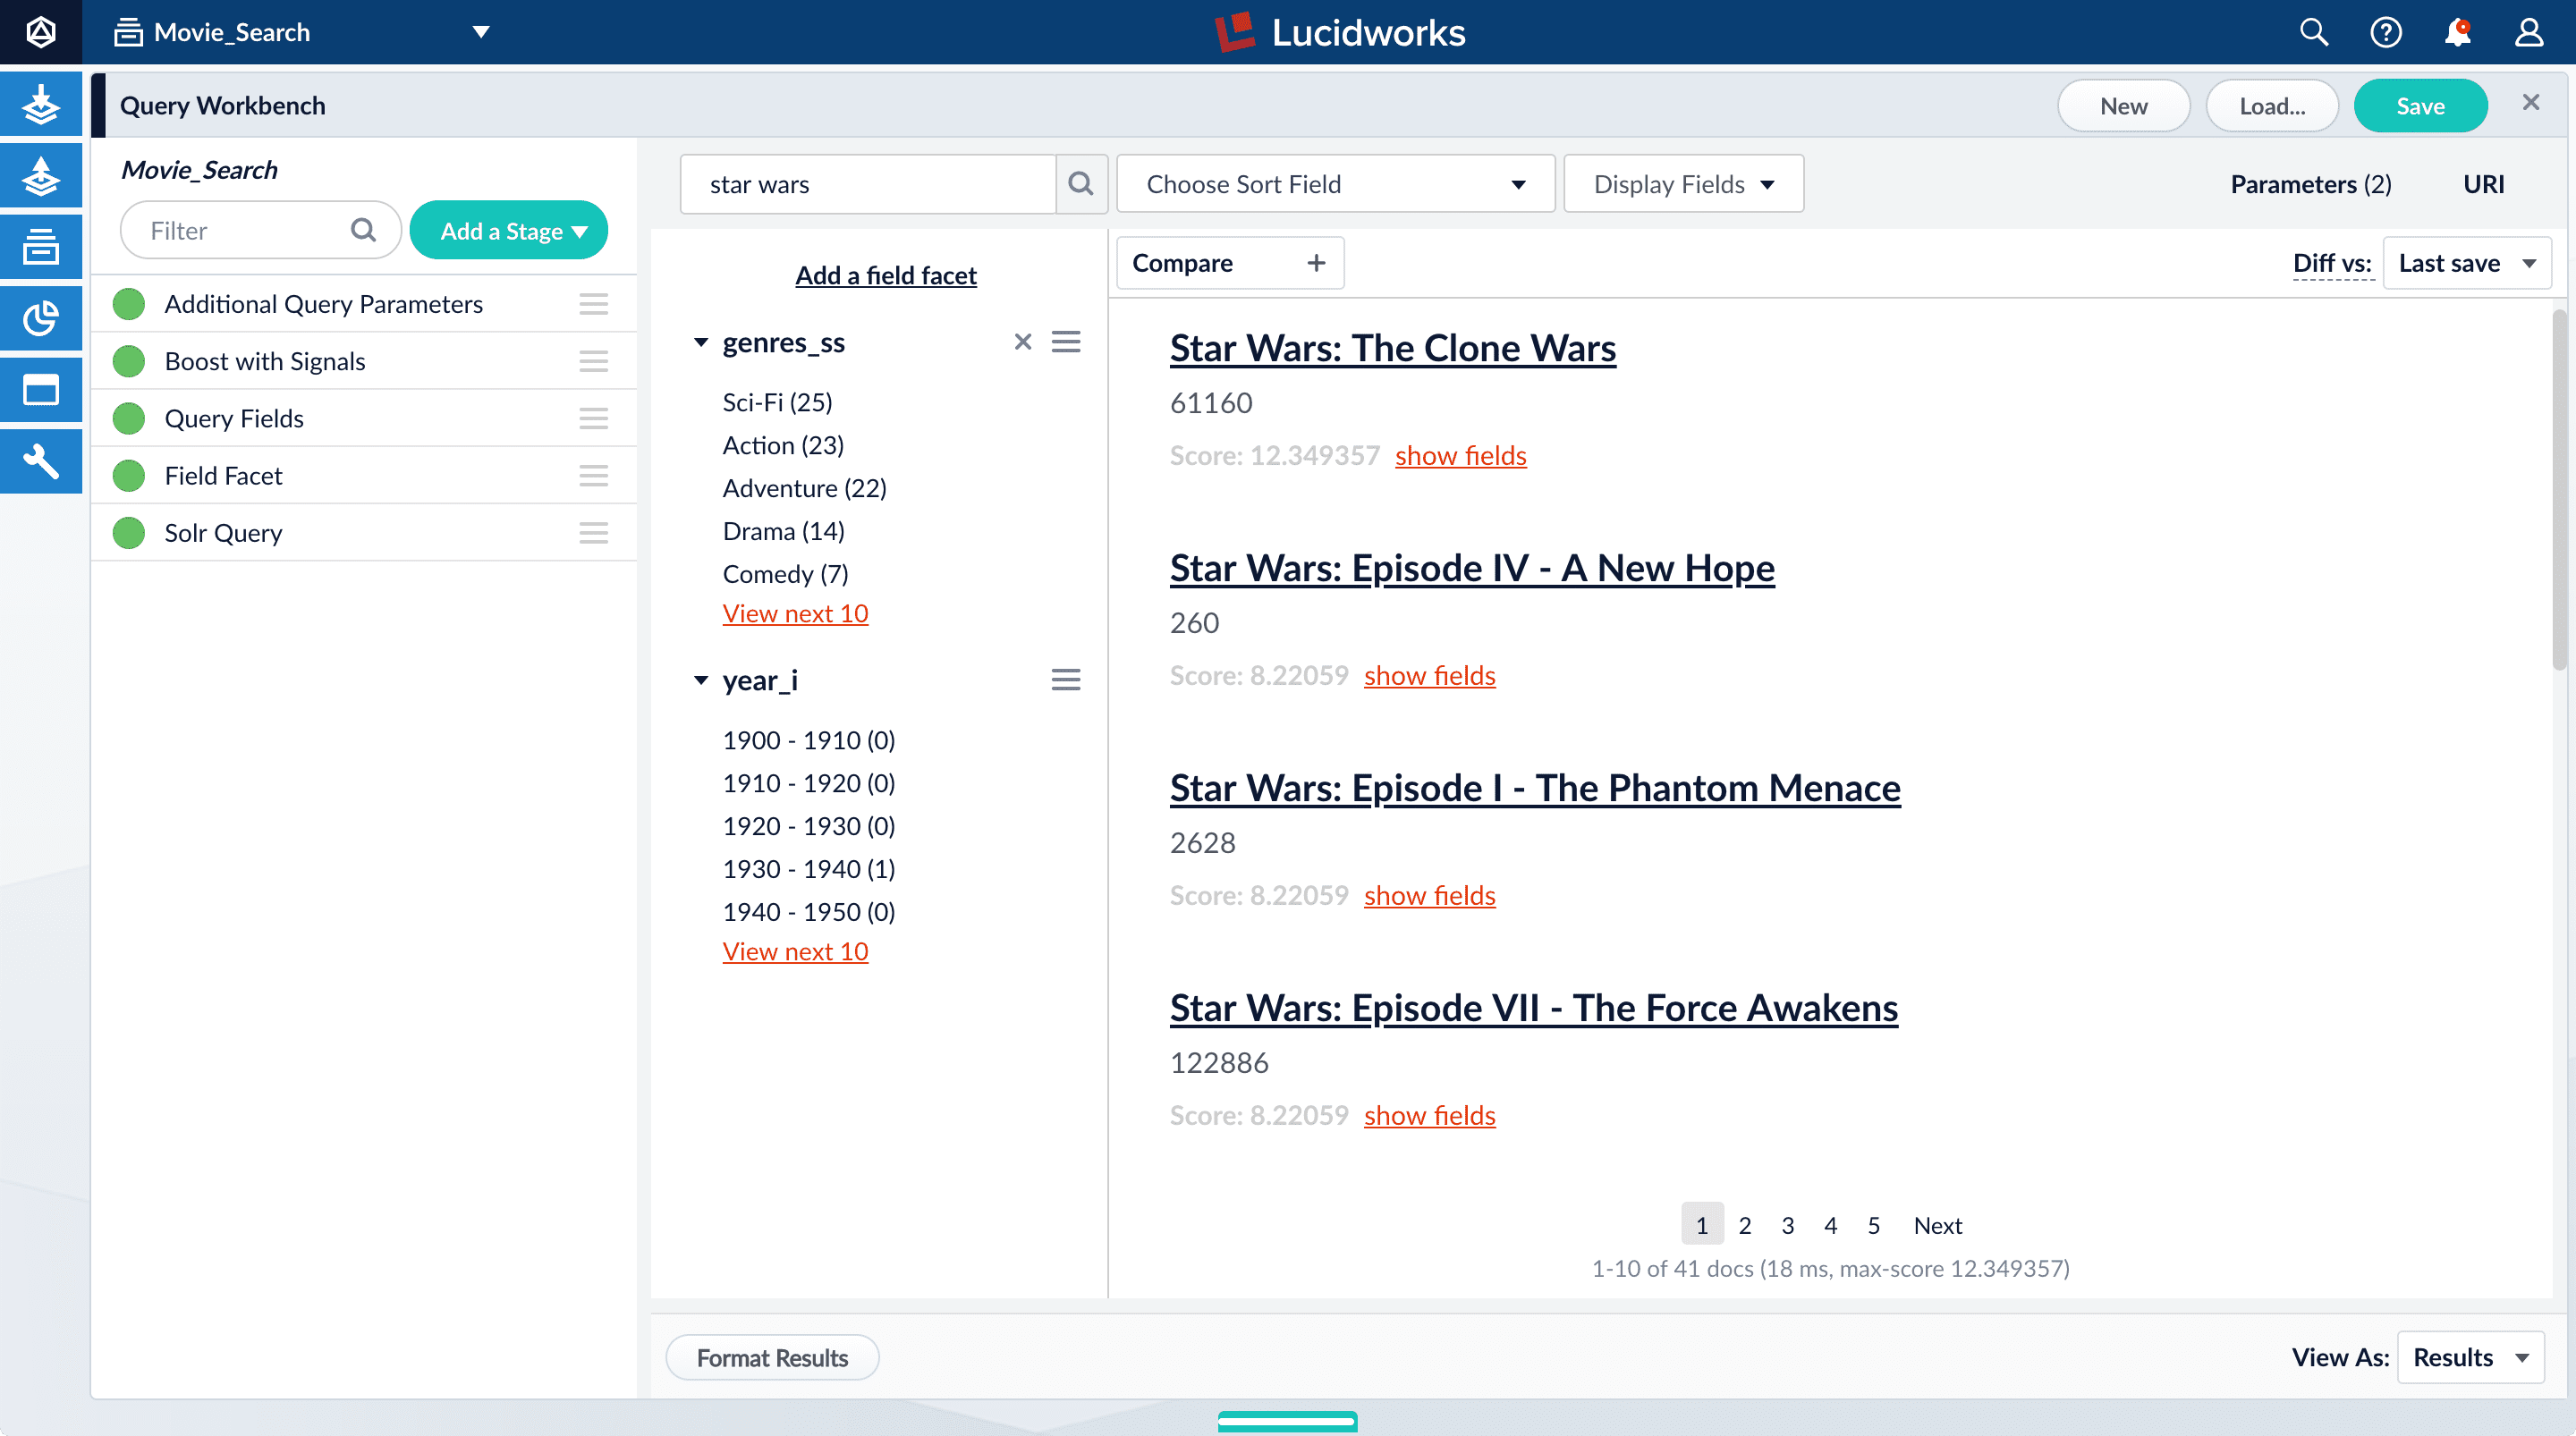
-
In Format Results, Set results per page to 20. This should allow you to scroll for this next part instead of explicitly searching for the titles.
Next you will generate signals that you can use to boost certain titles. Signals are tied to the search query, so your boosted titles will appear first in the search results only when users search for
star wars. - Hover over “Star Wars: Episode IV - A New Hope”.
- Set the number of signals to 4000 and click Simulate.
- Hover over “Star Wars: Episode V - The Empire Strikes Back”.
- Set the number of signals to 3000 and click Simulate.
- Hover over “Star Wars: Episode VI - Return of the Jedi”.
- Set the number of signals to 2000 and click Simulate.
-
In the upper right, click Save.
The Save Pipeline window appears. By default, you will overwrite the existing query pipeline for the selected collection (in this case,
Movie_Search_signals). - Click Save pipeline.
Explore the raw signals
Whenever you create a collection, two corresponding collections are also created automatically:COLLECTION_NAME_signals for raw signals and COLLECTION_NAME_signals_aggr for aggregated signals (in this case, Movie_Search_signals and Movie_Search_signals_aggr). Just as you did with your primary collection, you can use Query Workbench to explore the data in the _signals collection.- In the collection picker in the upper left, select Movie_Search_signals.
-
Open Query Workbench. Navigate to Querying > Query Workbench.
Your signal data appears.
-
Search for
type:click. -
For any of the results, click show fields.
- The
count_ifield shows the number of click signals you generated for this event. For example, given the correspondingdoc_idfor Star Wars: Episode IV - A New Hope, thecount_iequals 4000.
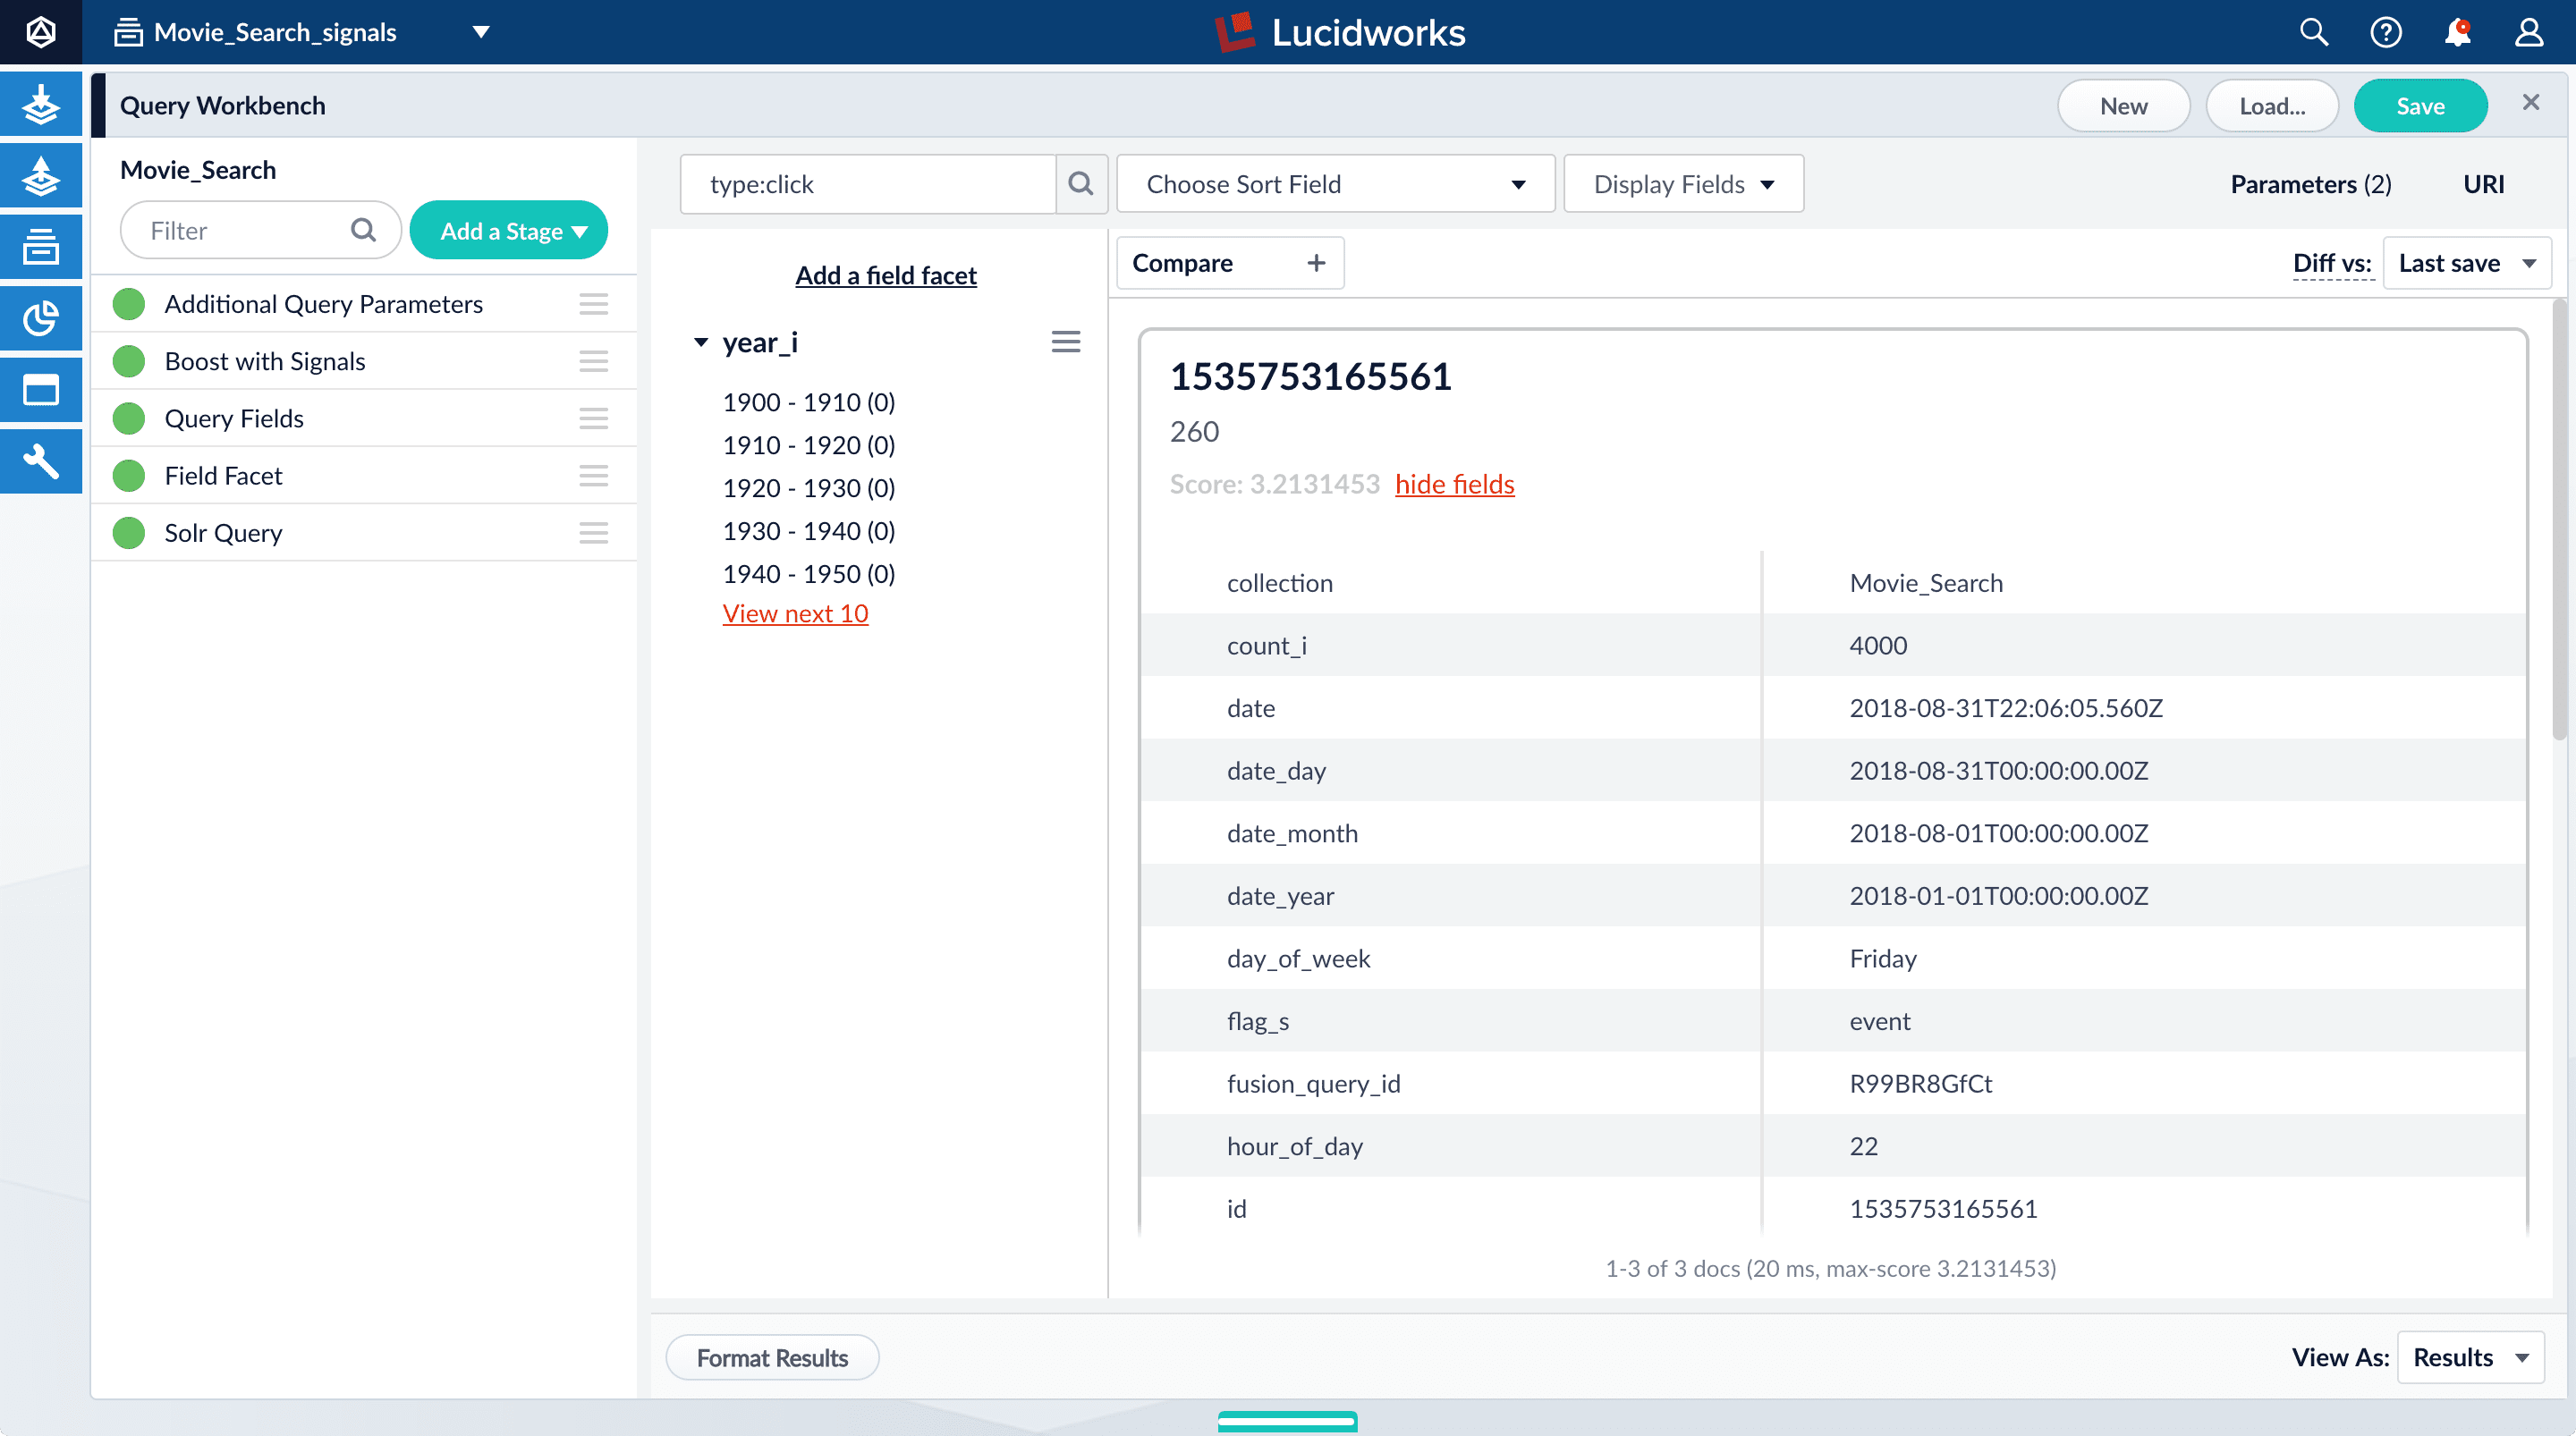
doc_id_sfield in theMovie_Search_signalscollection is the same as the contents of theidfield in yourMovies_Searchcollection, that is, the ID of the document that you clicked in Query Workbench, or for which you specified a number of clicks, and then clicked Simulate*. ** Thequery_orig_sfield in theMovie_Search_signalscollection contains the original query string that produced this search result. - The
- Click hide fields.
Optional: Format signals fields
You can configure your search view to display fields that are meaningful for your investigation. For example, you can display the document ID and the number of click signals.- Click Display Fields.
-
For the Name field, select
doc_id. -
For the Description field, select
count_i.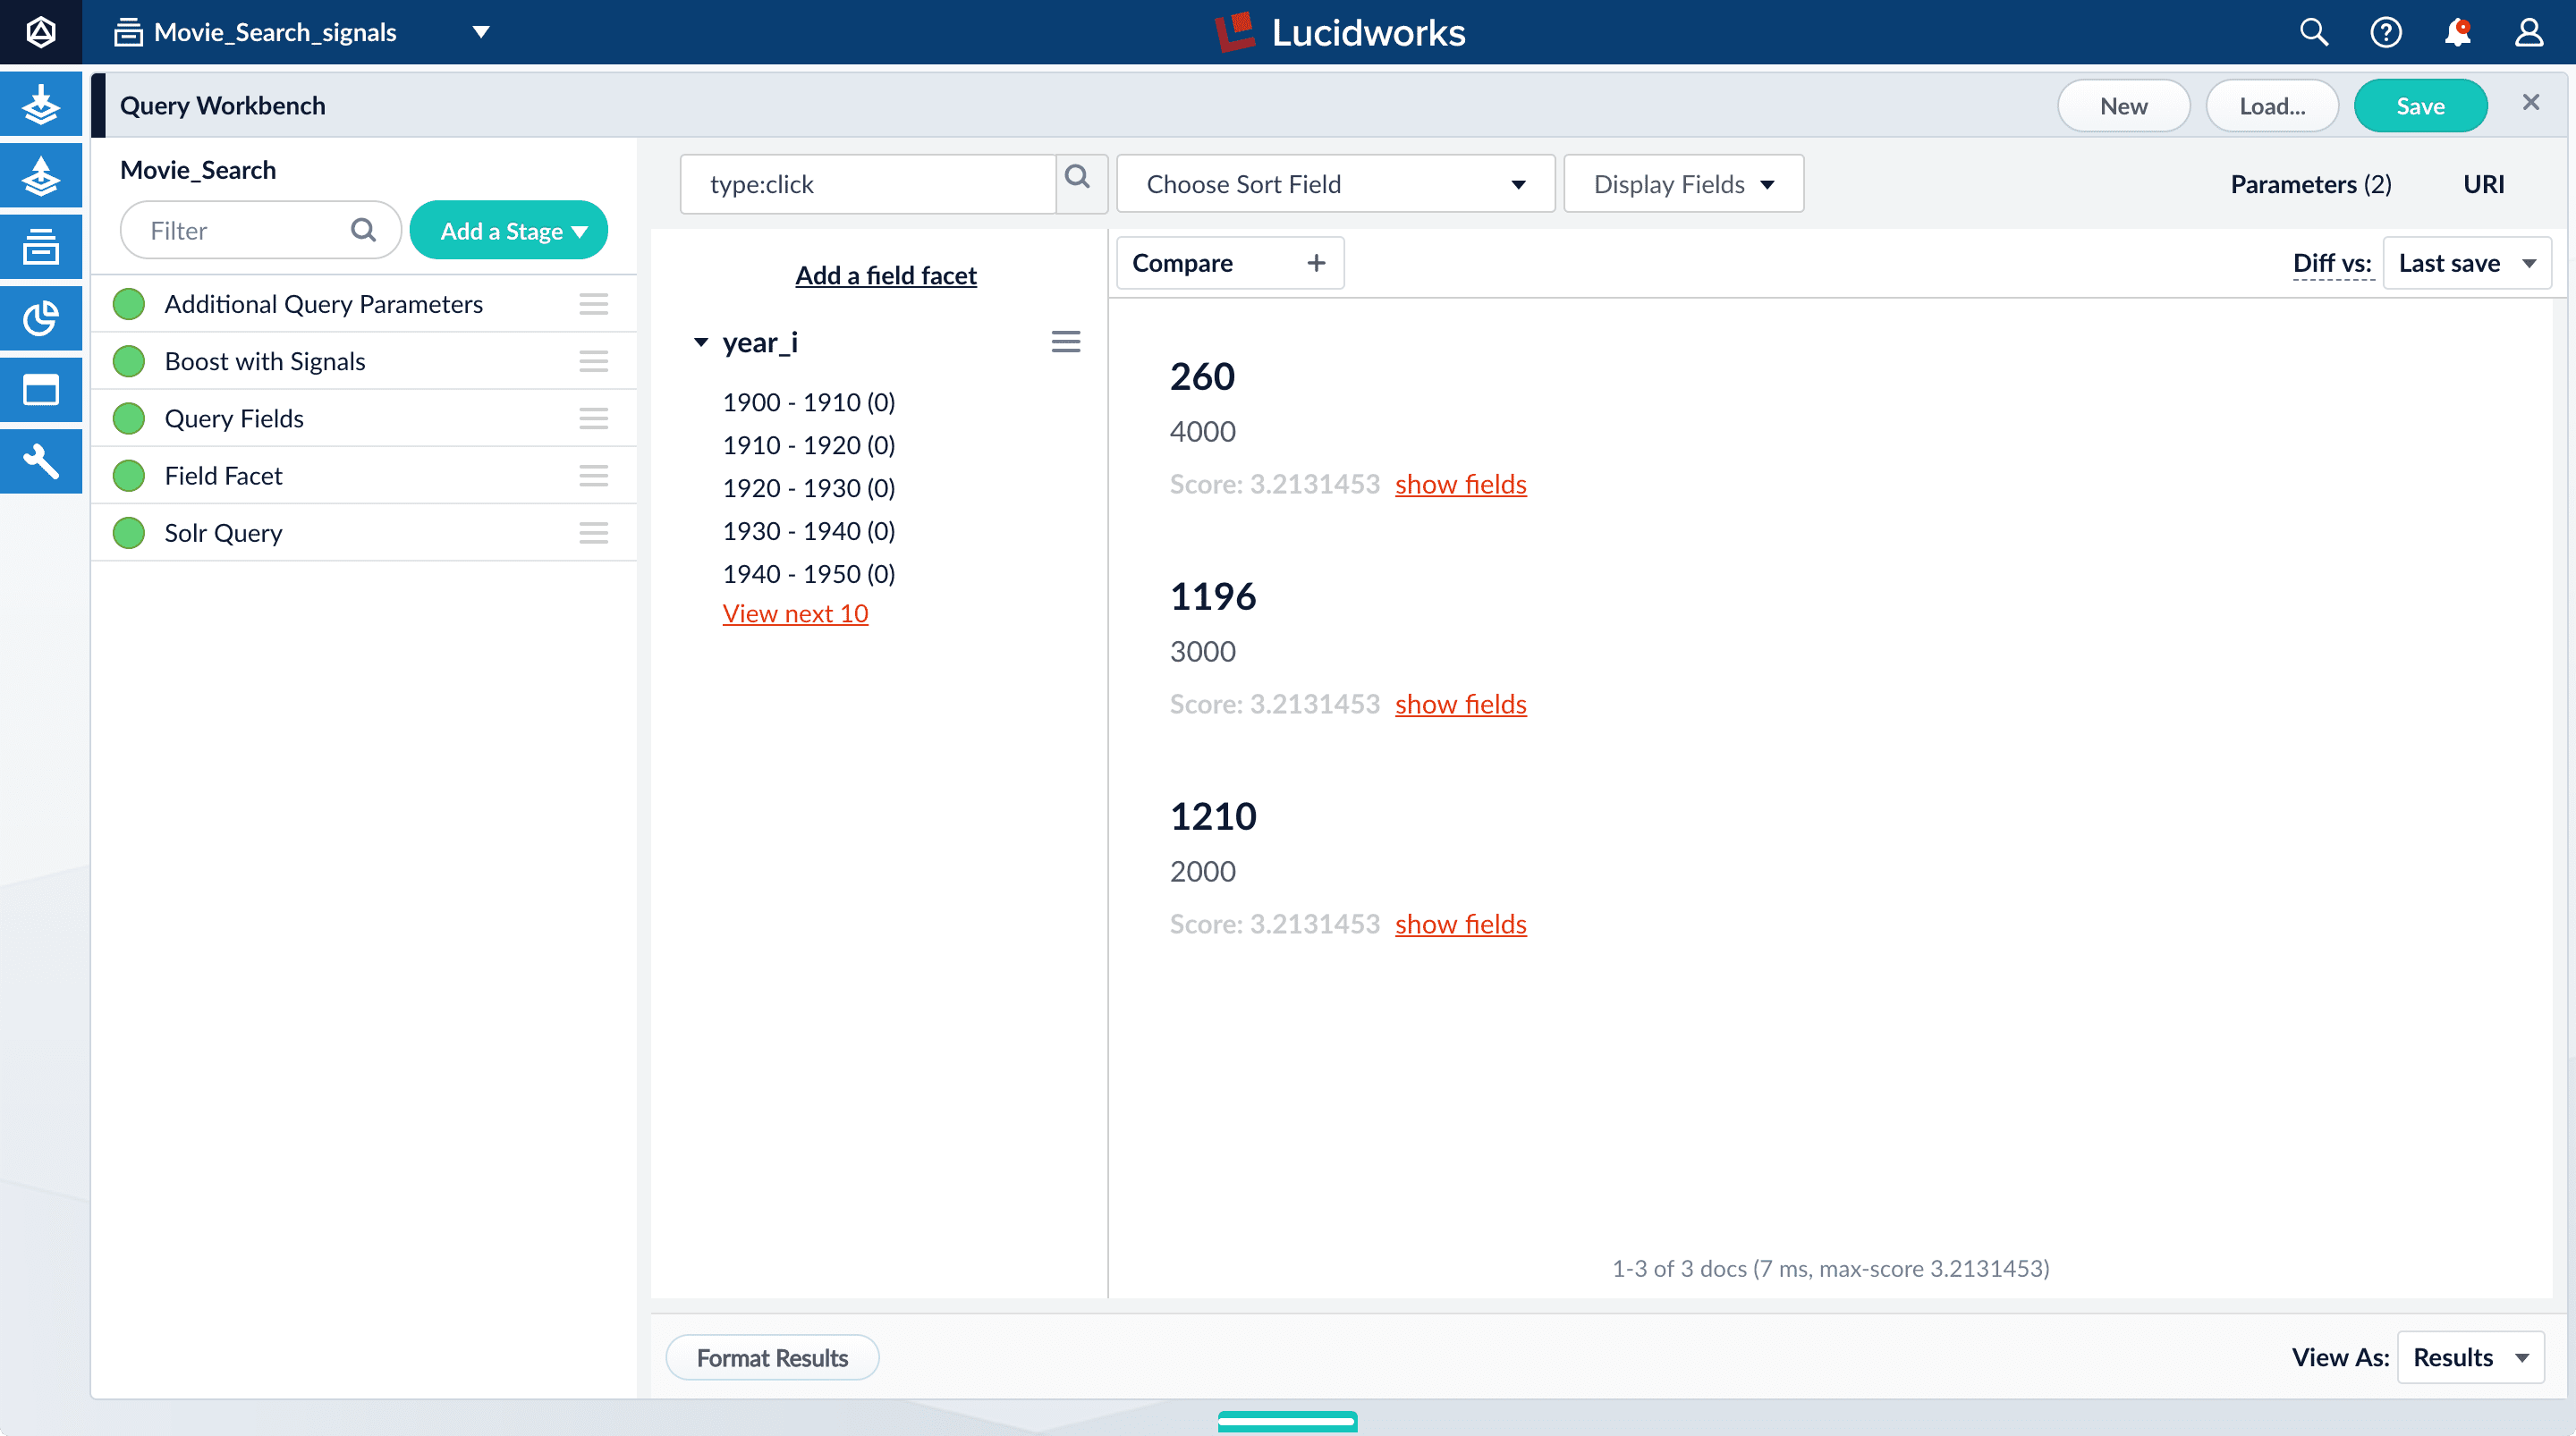
Explore the aggregated signal data
Aggregation jobs are created automatically when you create an app. However, you need to run the aggregation job manually:- Navigate to Collections > Jobs.
- Select
Movie_Search_click_signals_aggregationfrom the job list. - Click Run.
- Click Start.
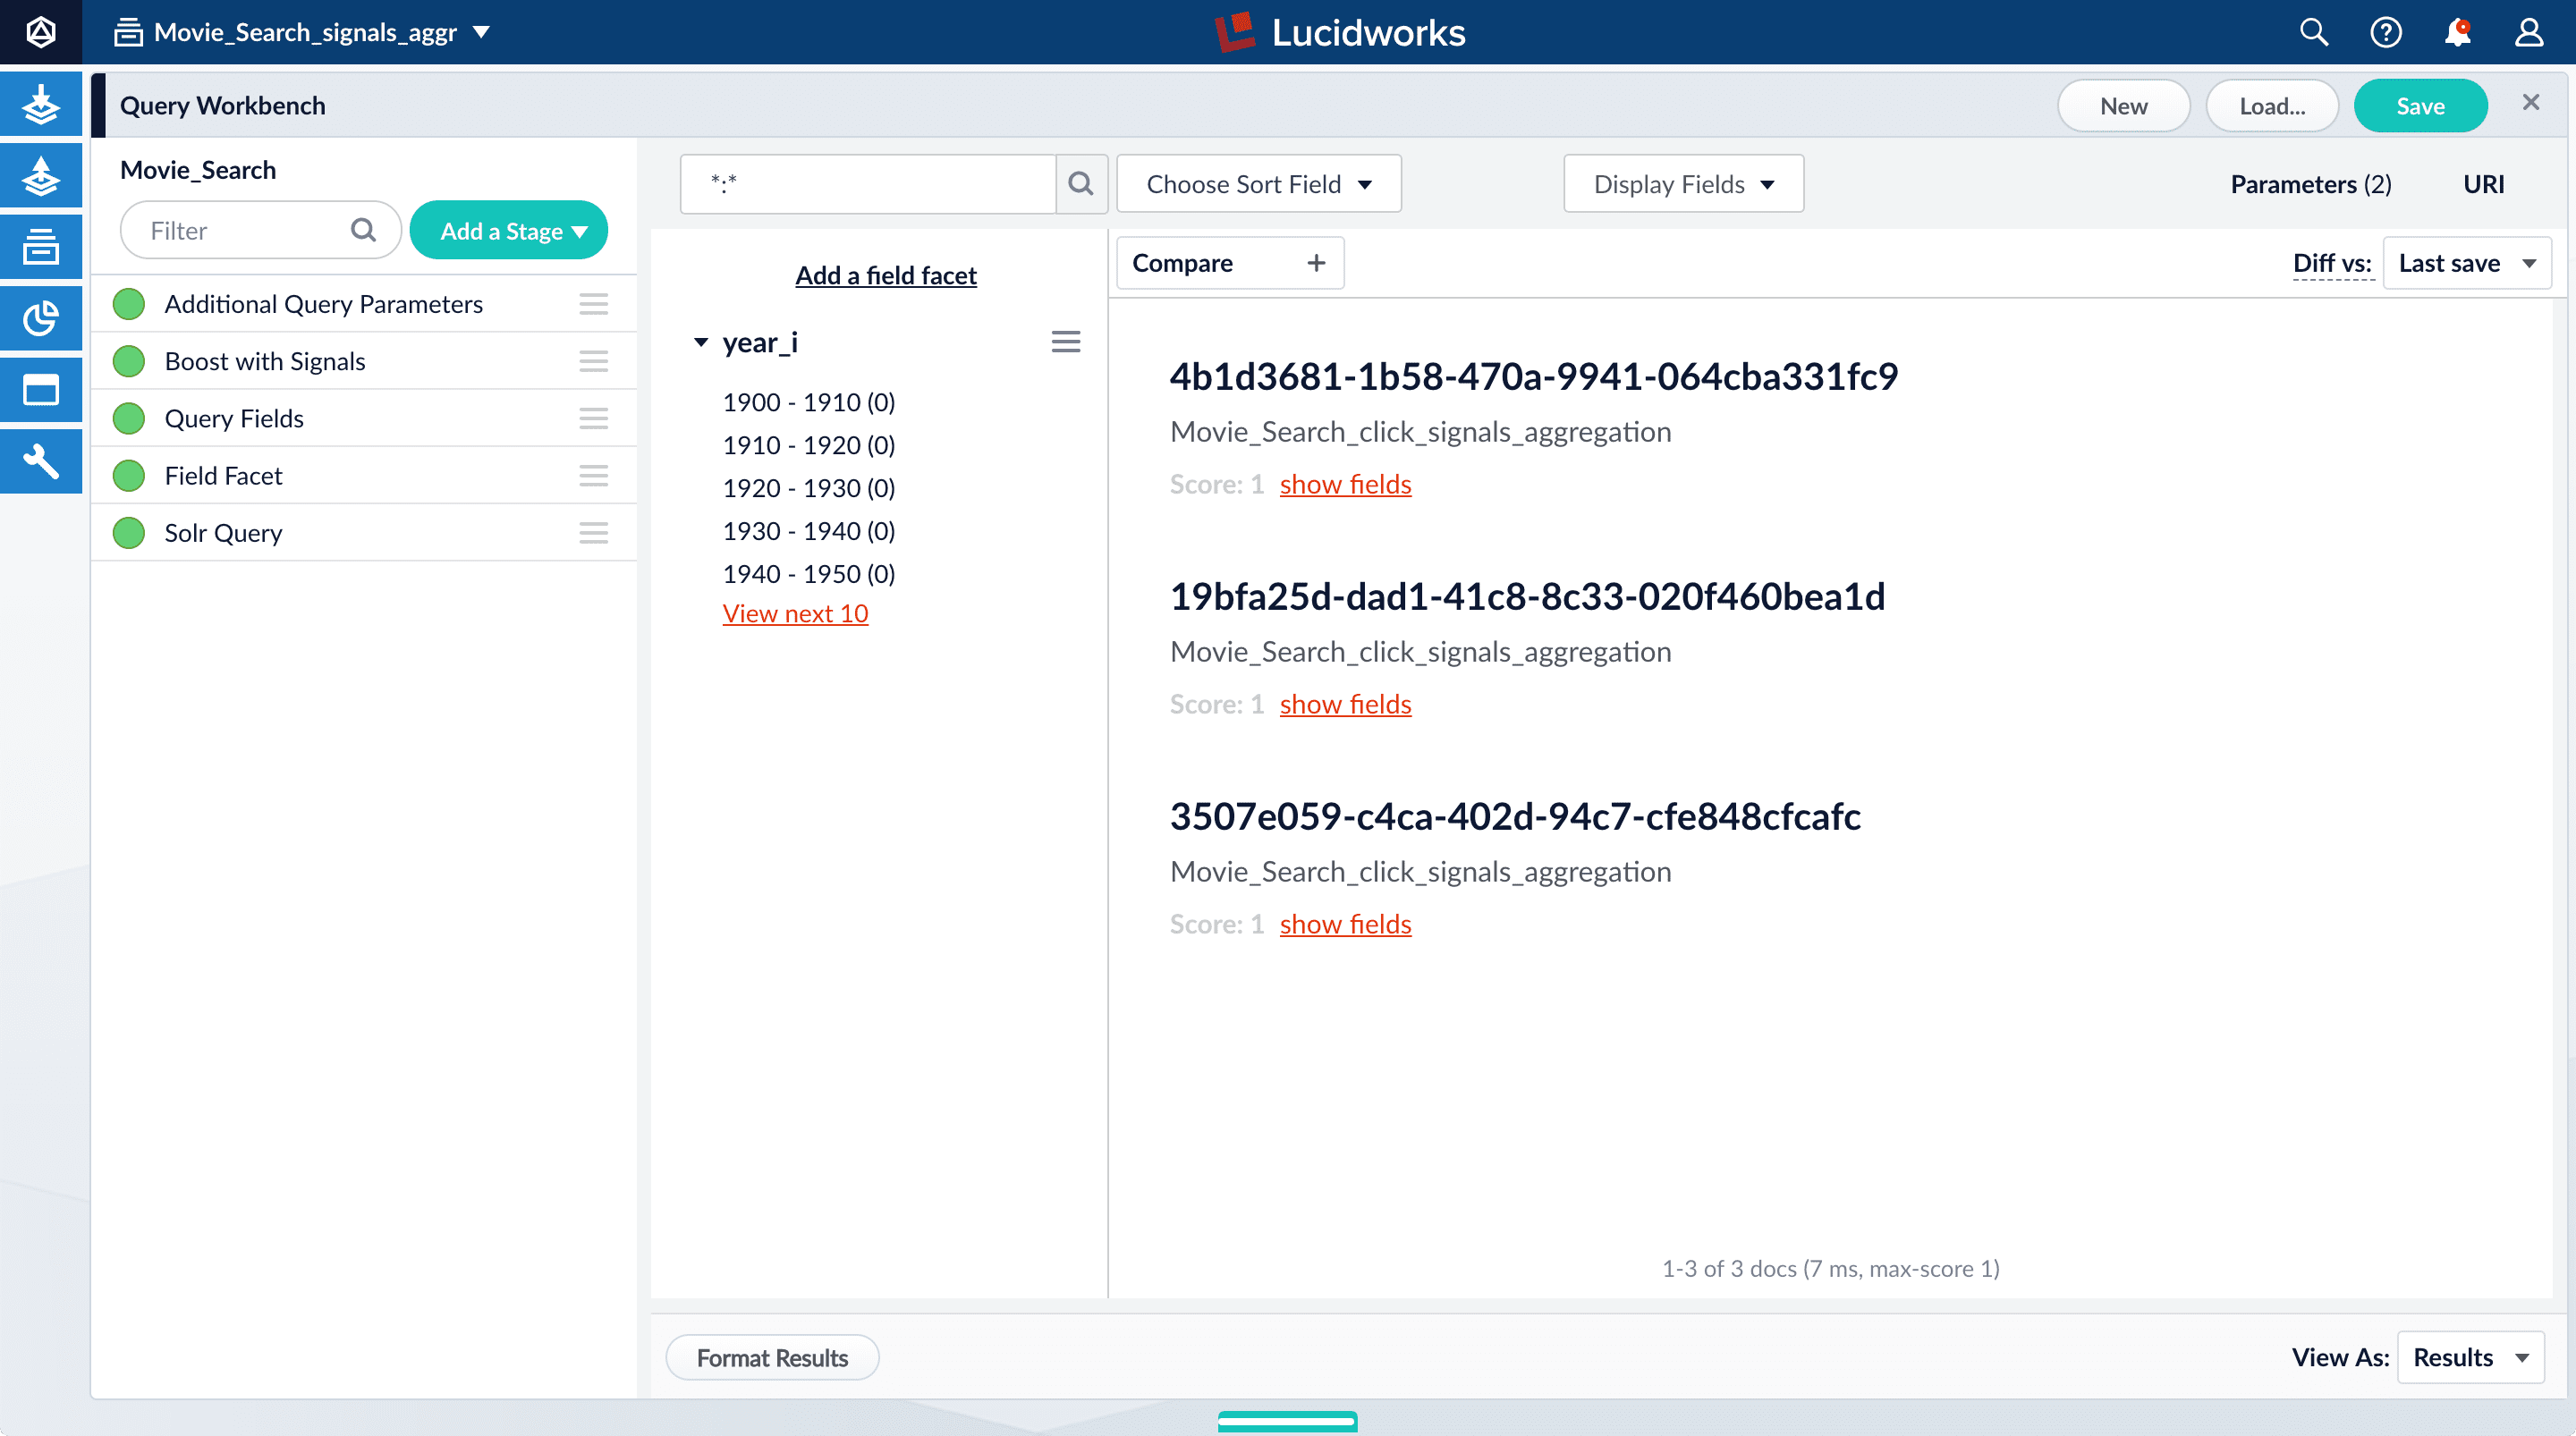
Movie_Search_signals_aggr collection.- In the collections picker in the upper left, select Movie_Search_signals_aggr.
-
Open Query Workbench. Navigate to Querying > Query Workbench.
Your aggregated signal data should appear. If not, wait a minute and then reload your browser, or click Search in Query Workbench.
- Click Display Fields.
-
For the Name field, select
doc_id. -
For the Description field, select
aggr_count_i. -
For the result 1210, click show fields.
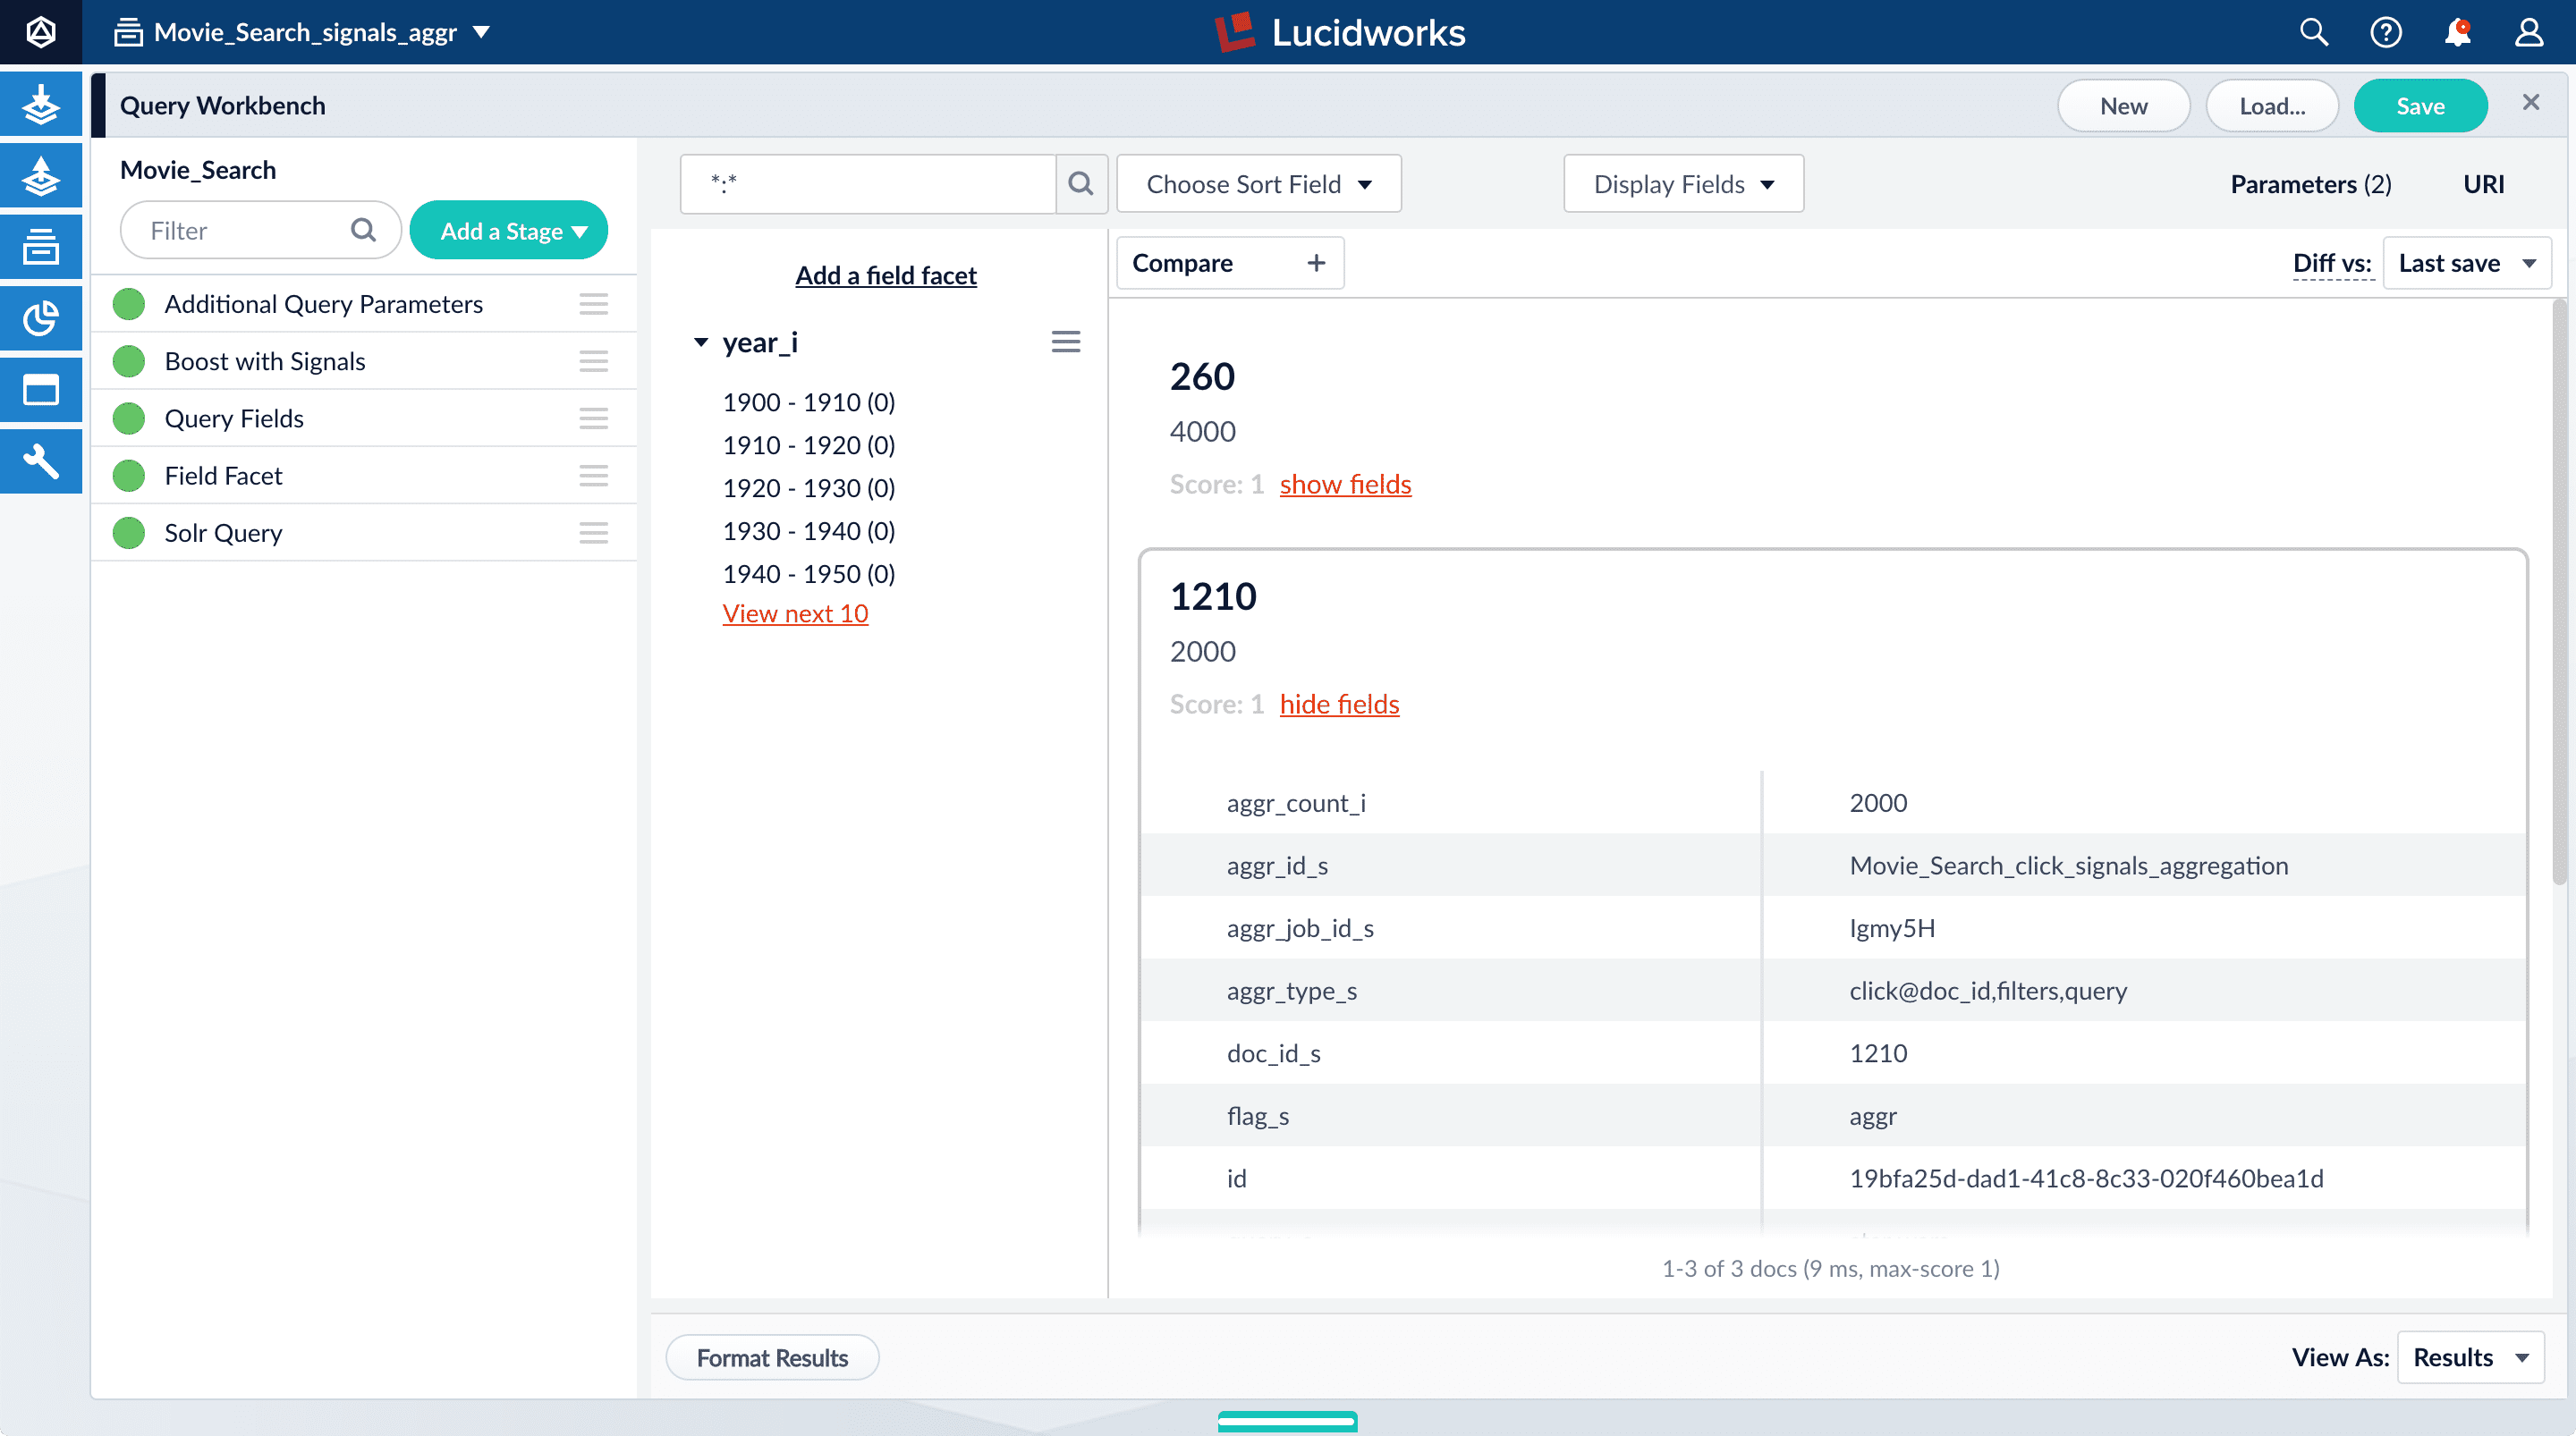
aggr_count_i. Number of signals that have been aggregated (in this case, 3000)aggr_id_s. Name of the aggregation jobaggr_job_id_s. Job IDaggr_type_s. Aggregation type
-
In the upper right, click Save.
The Save Pipeline window appears. By default, you will overwrite the existing query pipeline for the selected collection (in this case,
Movie_Search). - Click Save pipeline.
View the search results with and without default boosting
- In the collections picker in the upper left, select Movie_Search.
- Open Query Workbench. Navigate to Querying > Query Workbench.
-
Search for
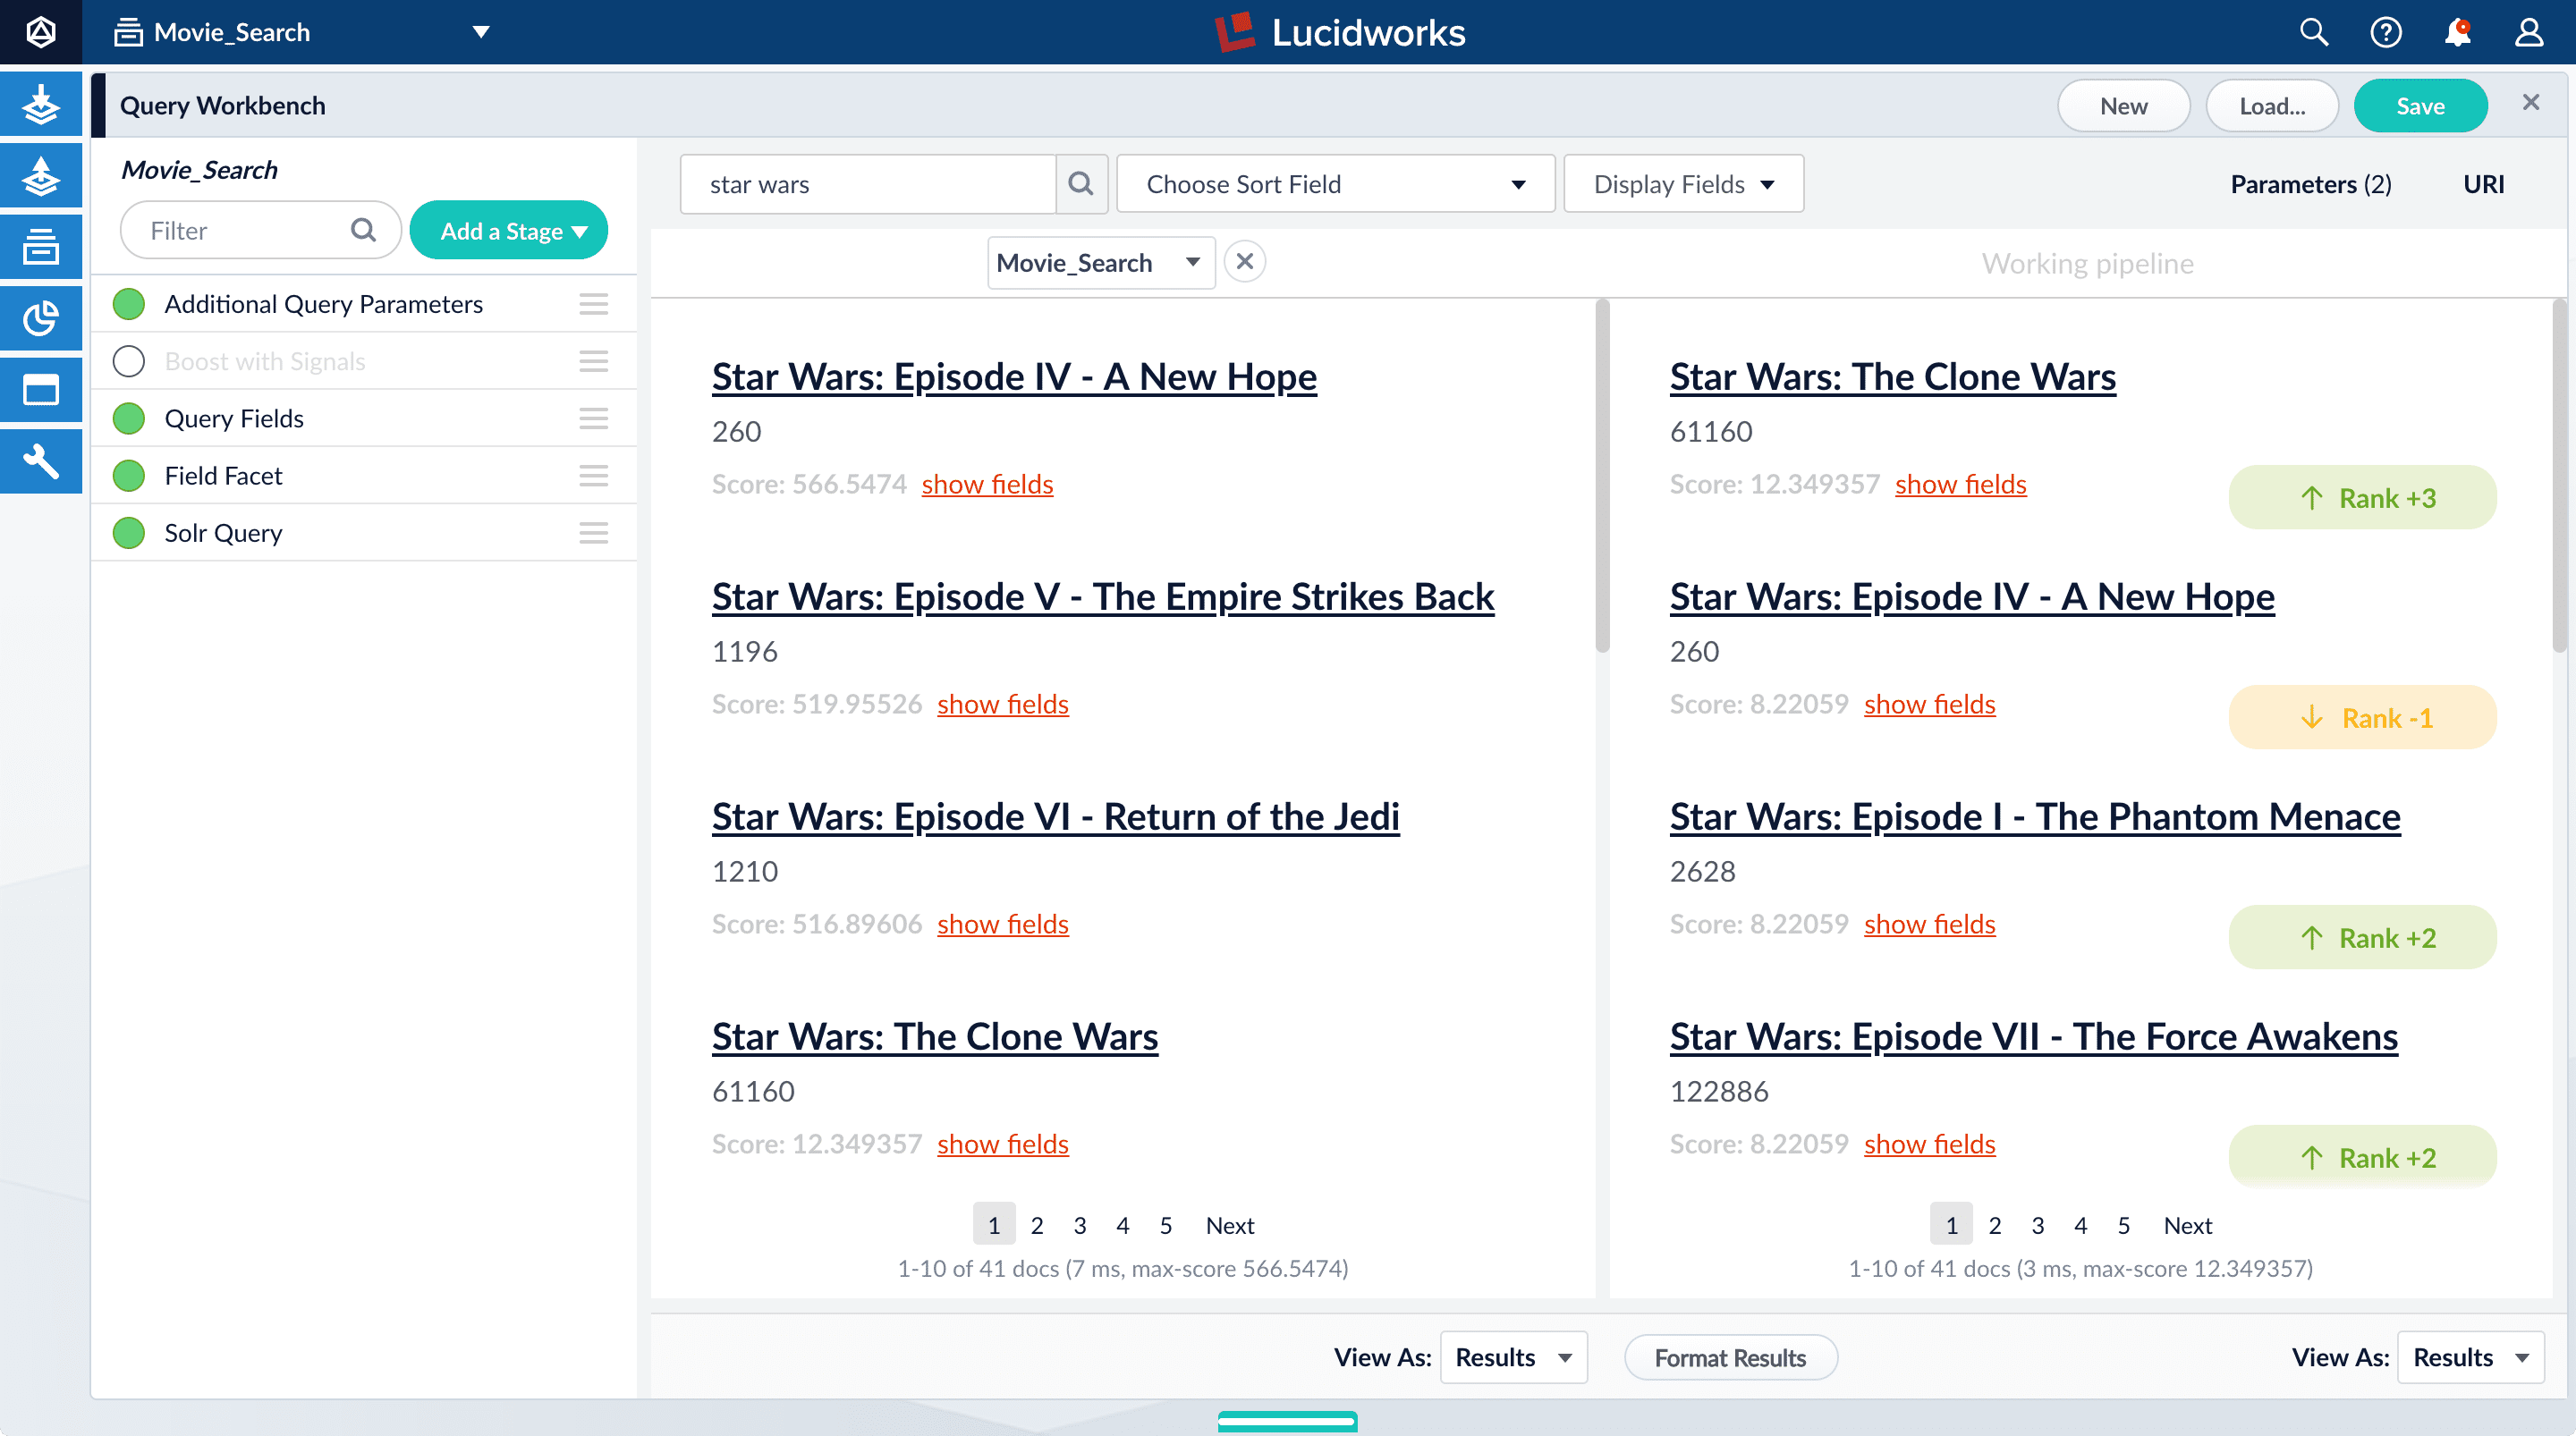
star wars. Now, “Star Wars: Episode IV - A New Hope” is the first search result, followed by Episode V and then VI. These search results are automatically boosted by the default configuration of the Boost with Signals query pipeline stage, which boosts on theidfield.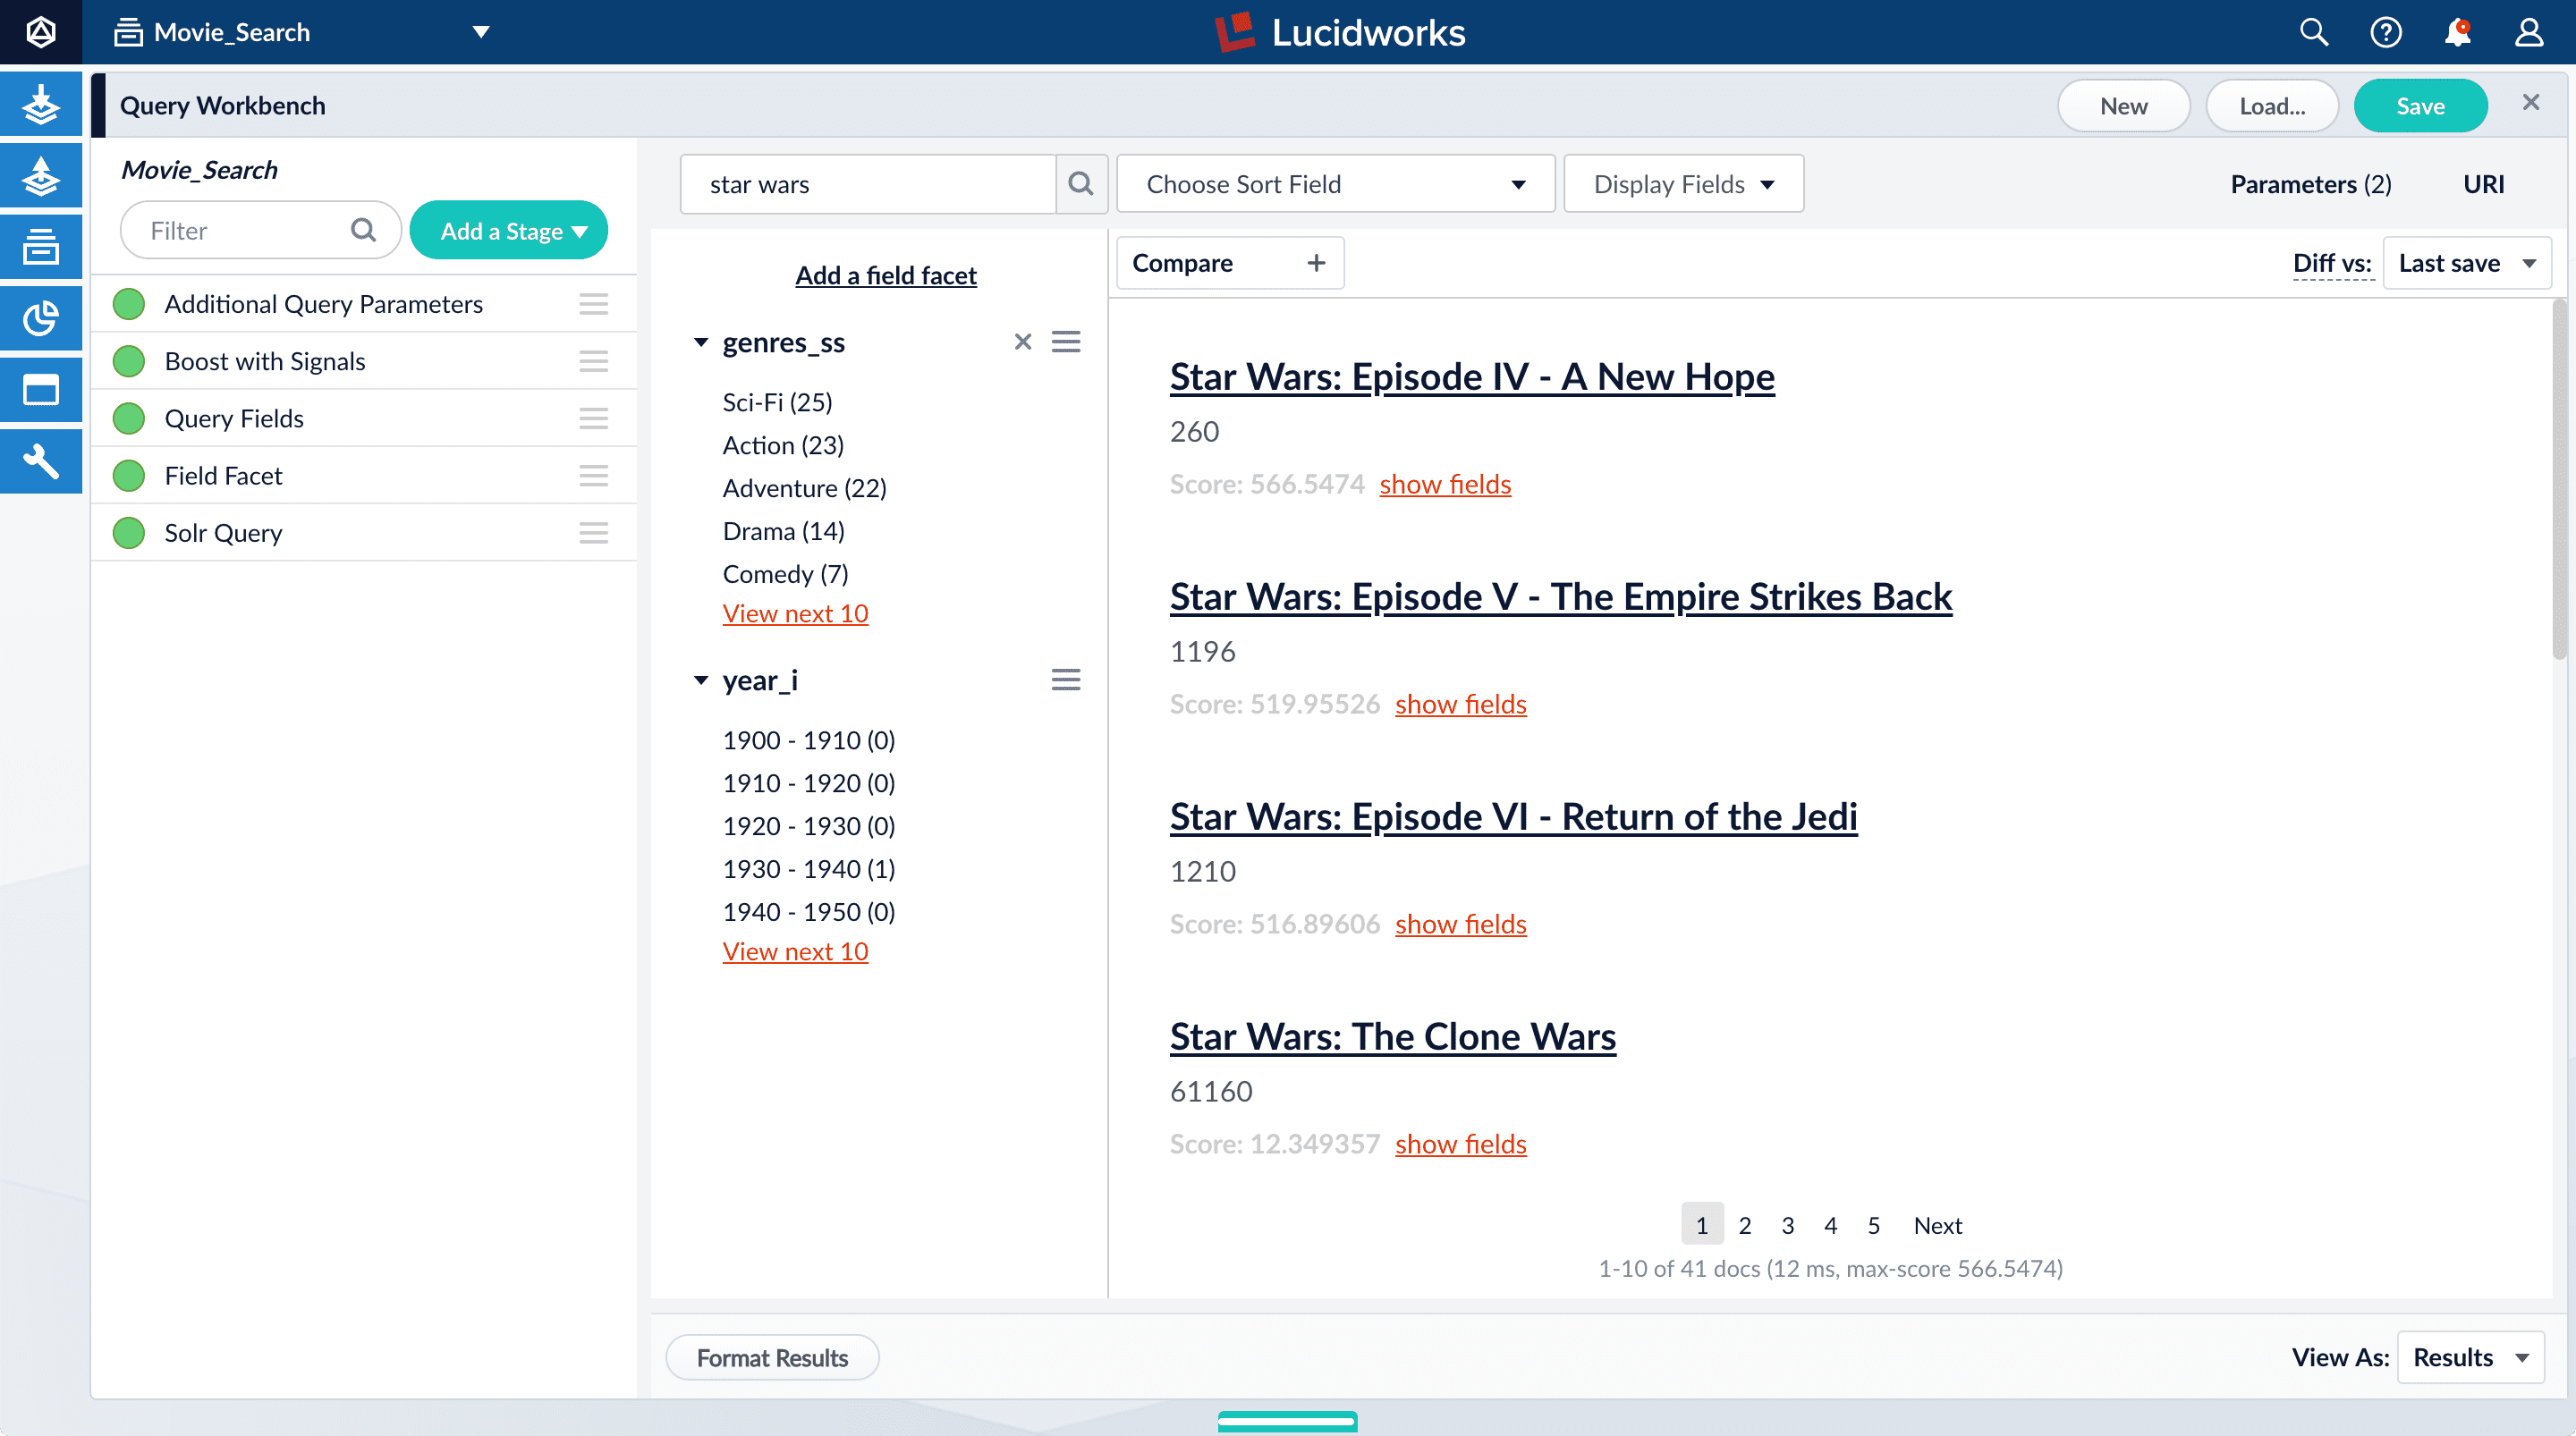 The Boost with Signals stage requires a Fusion AI license. Your Fusion trial license enables Fusion AI features.
 -
Click Compare. Another preview panel opens. Now the working pipeline is on the right and a static snapshot of that same pipeline is on the left.
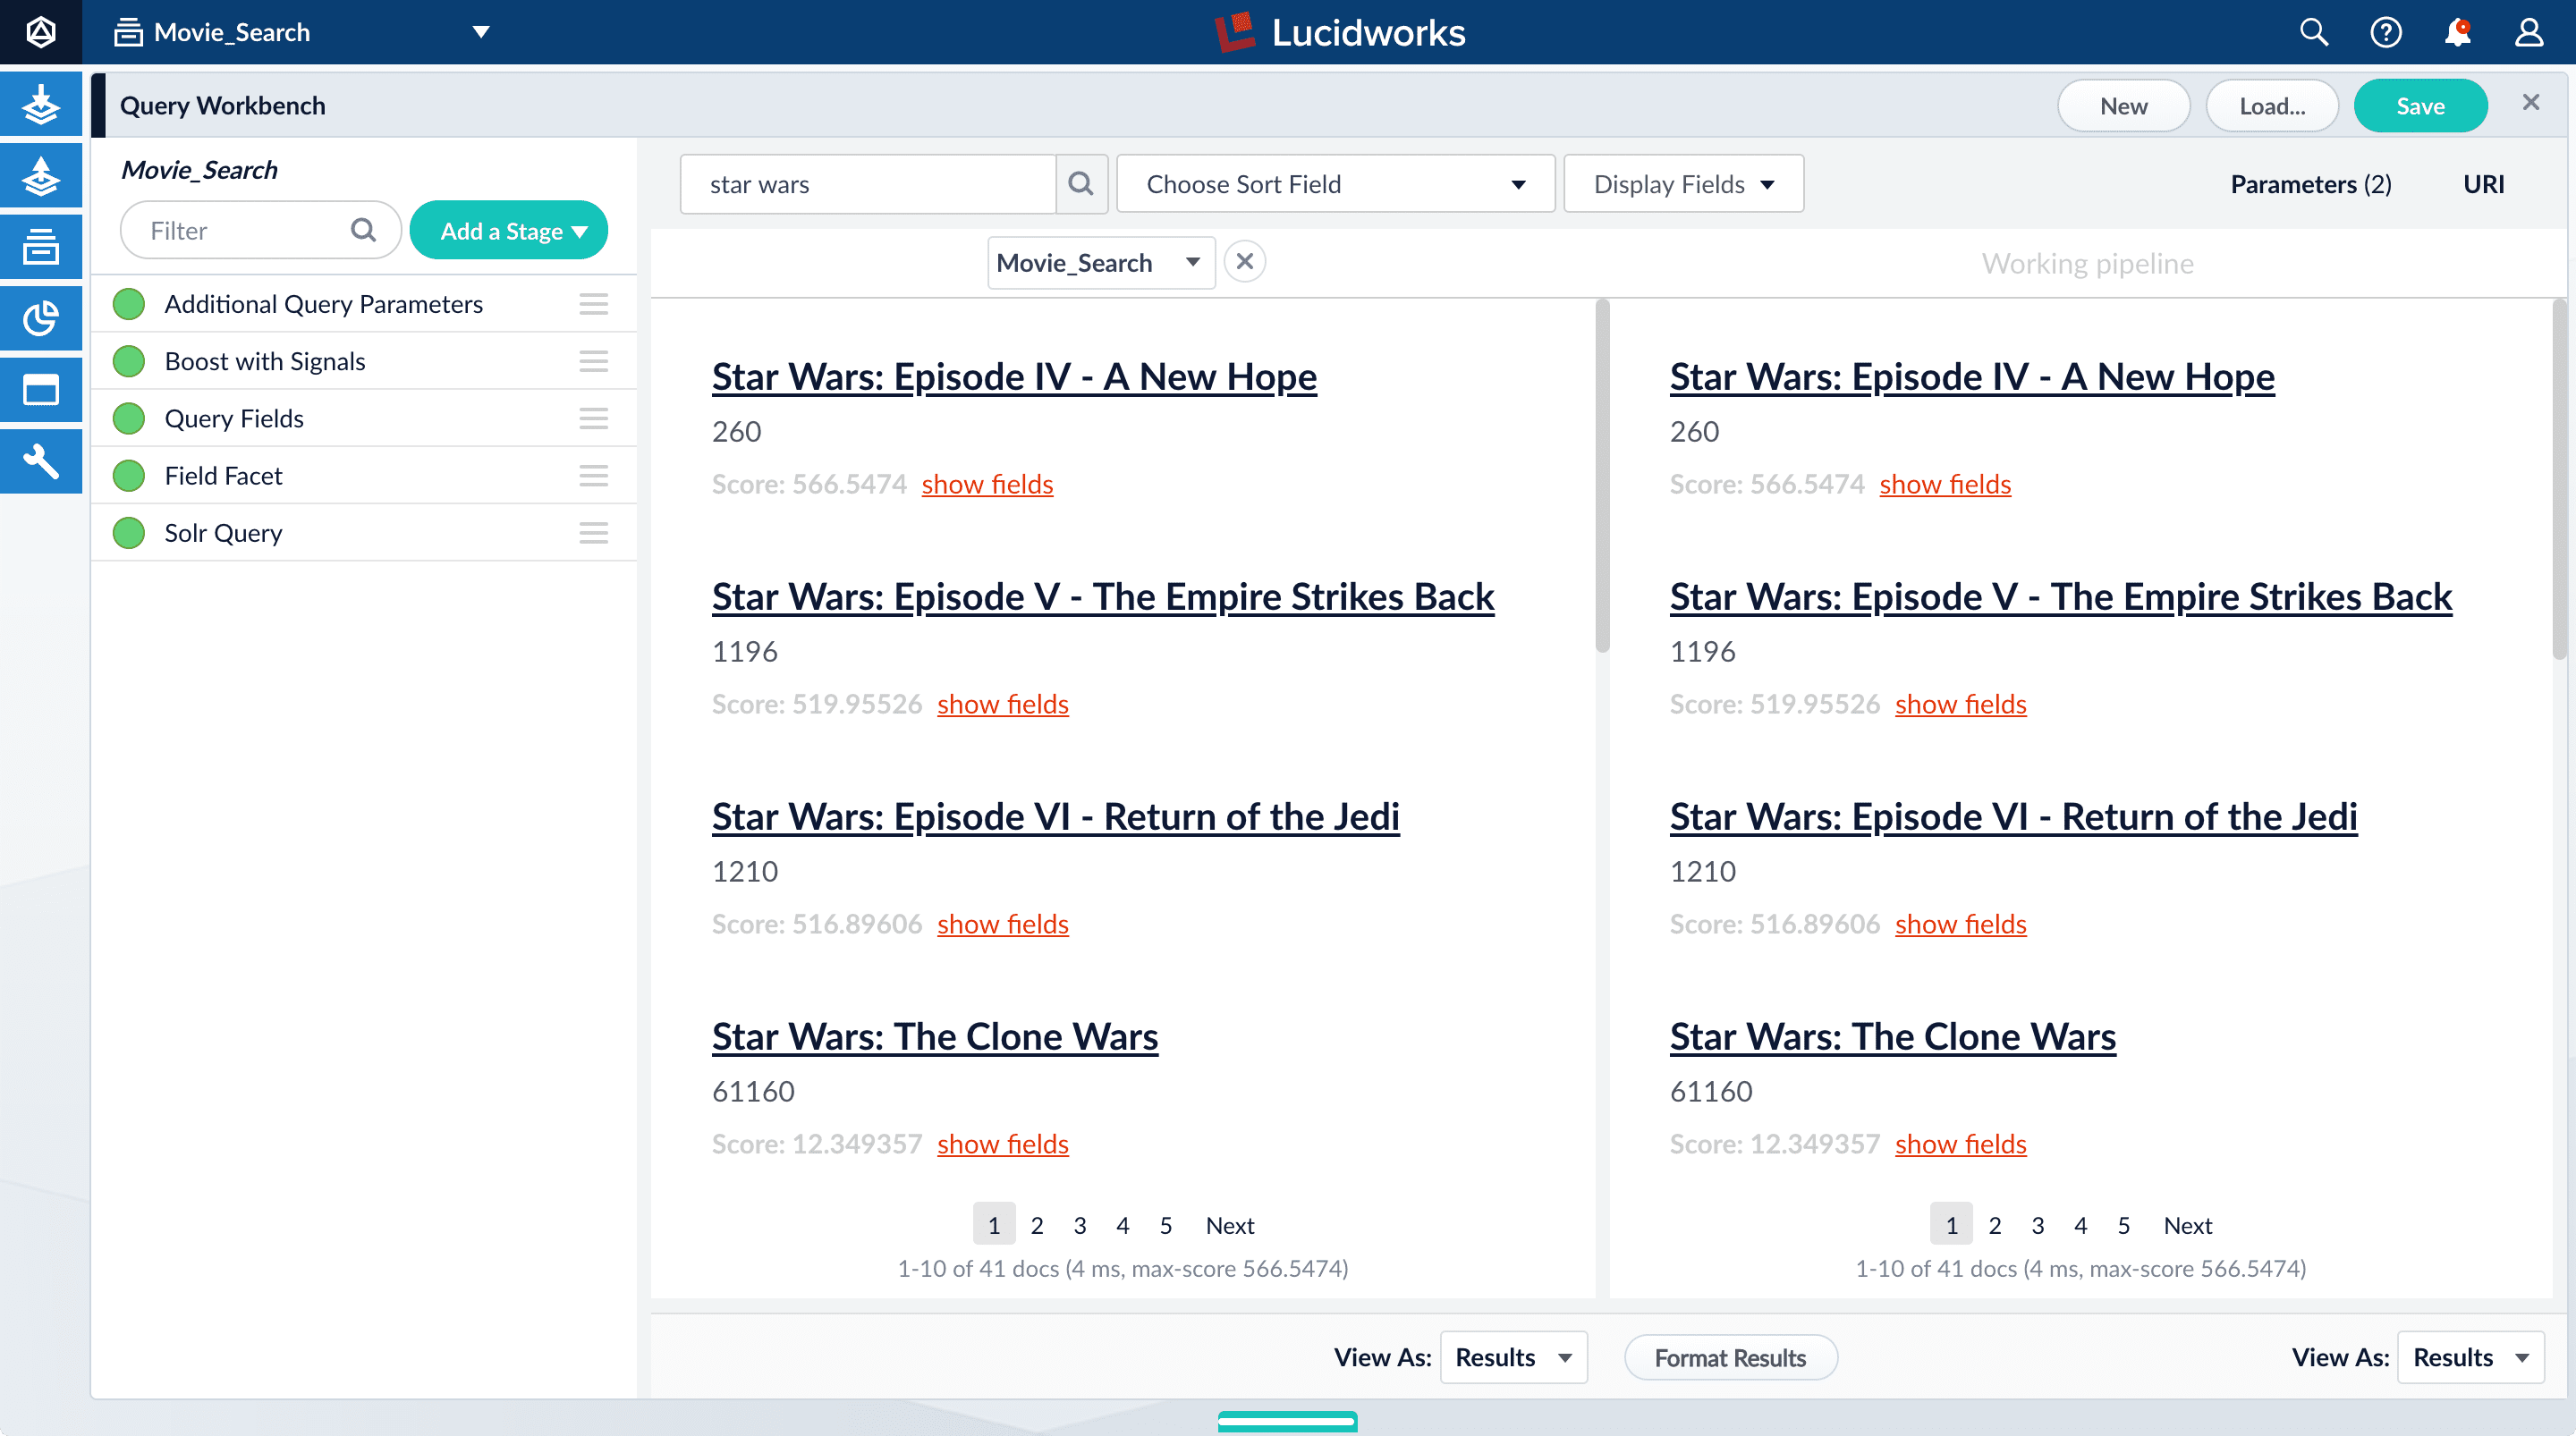
Movie_Search) with and without the Boost with Signals stage enabled. -
Turn off the Boost with Signals stage.
- Turn on the Boost with Signals stage again to restore the boosted results.
- Close the comparison preview panel by clicking the close icon.
Deploy Fusion 5 on Azure Kubernetes Service (AKS)
Deploy Fusion 5 on Azure Kubernetes Service (AKS)
Fusion supports deployment on Azure Kubernetes Service (AKS). This topic explains how to deploy a Fusion cluster on AKS using the Use a short name for the namespace, containing only letters, digits, or dashes (no dots or underscores). The setup scripts in this repo use the namespace for the Helm release name by default.If you already have helm installed, make sure you’re using the latest version:For other OS, please refer to the Helm installation docs: https://helm.sh/docs/using_helm/The Fusion helm chart requires that helm is greater than version To use these role in a cluster, as an admin user first create the namespace that you wish to install fusion into:Apply the Then bind the rolebinding and clusterolebinding to the install user:You will then be able to run the You should get into the habit of pulling this repo for the latest changes before performing any maintenance operations on your Fusion cluster to ensure you have the latest updates to the scripts.Cloning the github repo is preferred so that you can pull in updates to the scripts, but if you are not a git user, then you can download the project: https://github.com/lucidworks/fusion-cloud-native/archive/master.zip.
Once downloaded, extract the zip and cd into the To recap, you should have the following requirements in place:If you don’t want the script to create a cluster, then you need to create a cluster before running the script and simply pass the name of the existing cluster using the This way, you don’t have to remember to pass the additional This saves you from having to pass If all goes well, you should see a list of pods similar to:The number of pods per deployment / statefulset will vary based on your cluster size and replicaCount settings in your custom values YAML file.
Also, don’t worry if you see some pods having been restarted as that just means they were too slow to come up and Kubernetes killed and restarted them.
You do want to see at least one pod running for every service. If a pod is not running after waiting a sufficient amount of time,
use For an overview of the various Fusion 5 microservices, see: Fusion microservices.Once you’re ready to build a Fusion cluster for production, please see see more information at Fusion 5 Survival Guide.With Grafana, you can either setup a temporary port-forward to a Grafana pod or expose Grafana on an external IP using a K8s LoadBalancer.
To define a LoadBalancer, do (replace $ with your Helm release label):You can use
setup_f5_aks.sh script in the fusion-cloud-native repository.The
setup_f5_aks.sh script is the basic foundation for getting started and proof-of-concept purposes. For information about custom values in a production-ready environment, see Custom values YAML file.Prerequisites
This section covers prerequisites and background knowledge needed to help you understand the structure of this document and how the Fusion installation process works with Kubernetes.Release Name and Namespace
Before installing Fusion, you need to choose a https://kubernetes.io/docs/concepts/overview/working-with-objects/namespaces/ namespace to install Fusion into. Think of a K8s namespace as a virtual cluster within a physical cluster. You can install multiple instances of Fusion in the same cluster in separate namespaces. However, please do not install more than one Fusion release in the same namespace.All Fusion services must run in the same namespace, i.e. you should not try to split a Fusion cluster across multiple namespaces.__
Install Helm
Helm is a package manager for Kubernetes that helps you install and manage applications on your Kubernetes cluster. Regardless of which Kubernetes platform you’re using, you need to installhelm as it is required to install Fusion for any K8s platform.
On MacOS, you can do:3.0.0; check your Helm version by running helm version --short.Helm User Permissions
If you require that fusion is installed by a user with minimal permissions, instead of an admin user, then the role and cluster role that will have to be assigned to the user within the namespace that you wish to install fusion in are documented in theinstall-roles directory.When working with Kubernetes on the command-line, it’s useful to create a shell alias for
kubectl, e.g.:role.yaml and cluster-role.yaml files to that namespacehelm install command as the <install_user>Clone fusion-cloud-native from GitHub
You should clone this repo from github as you’ll need to run the scripts on your local workstation:fusion-cloud-native-master directory.The https://github.com/lucidworks/fusion-cloud-native/blob/master/setup_f5_aks.sh script provided in this repo is strictly optional.
The script is mainly to help those new to Kubernetes and/or Fusion get started quickly.
If you’re already familiar with K8s, Helm, and AKS, then you use Helm directly to install Fusion into an existing cluster or one you create yourself using the process described <<helm-only,here>>.If you’re new to Azure, then please visit https://azure.microsoft.com/en-us/free/search/ to set up an account.Set up the AKS CLI tools
Before launching an AKS cluster, you need to install and configurekubectl and az using the links provided below:Required AKS Command-line Tools:kubectl: https://kubernetes.io/docs/tasks/tools/install-kubectl/az: https://docs.microsoft.com/en-us/cli/azure/install-azure-cli?view=azure-cli-latest
az login command (az login –help to see available options).Azure Prerequisites
To launch a cluster in AKS (or pretty much do anything with Azure) you need to setup a Resource Group. Resource Groups are a way of organizing and managing related resources in Azure. For more information about resource groups, see https://docs.microsoft.com/en-us/azure/azure-resource-manager/resource-group-overview#resource-groups.You also need to choose a location where you want to spin up your AKS cluster, such aswestus2. For a list of locations you can choose, see https://azure.microsoft.com/en-us/global-infrastructure/locations/.Use the Azure console in your browser to create a resource group, or simply do:- Azure Account set up.
azure-cli(az) command-line tools installed.azlogin working.- Created an Azure Resource Group and selected a location to launch the cluster.
Set up Fusion on AKS
Download and run the https://github.com/lucidworks/fusion-cloud-native/blob/master/setup_f5_aks.sh to install Fusion 5.x in a AKS cluster. To create a new cluster and install Fusion, simply do:-c parameter.Use the --help option to see full script usage.By default, our script installs Fusion into the default namespace; think of a K8s namespace as a virtual cluster within a physical cluster. You can install multiple instances of Fusion in the same cluster in separate namespaces. However, please do not install more than one Fusion release in the same namespace.You can override the namespace using the -n option. In addition, our script uses f5 for the Helm release name; you can customize this using the -r option. Helm uses the release name you provide to track a specific instance of an installation, allowing you to perform updates and rollback changes for that specific release only.You can also pass the --preview option to the script, which enables soon-to-be-released features for AKS, such as deploying a multi-zone cluster across 3 availability zones for higher availability guarantees. For more information about the Availability Zone feature, see https://docs.microsoft.com/en-us/azure/aks/availability-zones.It takes a while for AKS to spin up the new cluster. The cluster will have three Standard_D4_v3 nodes which have 4 CPU cores and 16 GB of memory. Behind the scenes, our script calls the az aks create command.After running the setup_f5_aks.sh script, proceed to <<verifying,Verifying the Fusion Installation>>.AKS Ingress
Thesetup_f5_aks.sh script exposes the Fusion proxy service on an external IP over HTTP. This is done for demo or getting started purposes. However, you’re strongly encouraged to configure a K8s Ingress with TLS termination in front of the proxy service.Use the -t and -h <hostname> options to have our script create an Ingress with a TLS certificate issued by Let’s Encrypt.Upgrades and Ingress
IMPORTANT: If you used the-t -h <hostname> options when installing your cluster, our script created an additional values yaml file named tls-values.yaml.To make things easier for you when upgrading, you should add the settings from this file into your main custom values yaml file. For example:tls-values.yaml file when upgrading.Verifying the Fusion Installation
In this section, we provide some tips on how to verify the Fusion installation.Let’s review some useful kubectl commands.Enhance the K8s Command-line Experience
Here is a list of tools we found useful for improving your command-line experience with Kubernetes:- krew (kubectl plugin mgr): https://github.com/kubernetes-sigs/krew/
- kube-ps1 (show current context on command line prompt): https://github.com/jonmosco/kube-ps1
- kubectx / kubens (switch between clusters / namespaces): https://github.com/ahmetb/kubectx
Useful kubectl commands
kubectl reference: https://kubernetes.io/docs/reference/generated/kubectl/kubectl-commandsSet the namespace forkubectl if not using the default:-n with every command.Get a list of running pods: k get podsGet logs for a pod using a label: k logs –l app.kubernetes.io/component=query-pipelineGet pod deployment spec and details: k get pods <pod_id> -o yamlGet details about a pod events: k describe po <pod_id>Port forward to a specific pod: k port-forward <pod_id> 8983:8983SSH into a pod: k exec -it <pod_id> -- /bin/bashCPU/Memory usage report for pods: k top podsForcefully kill a pod: k delete po <pod_id> --force --grace-period 0Scale up (or down) a deployment: k scale deployment.v1.apps/<id> --replicas=NGet a list of pod versions: k get po -o jsonpath='{..image}' | tr -s '[[:space:]]' '\n' | sort | uniqCheck Fusion Pods and Services
Once the install script completes, you can check that all pods and services are available using:kubectl logs <pod_id> to see the logs for that pod; to see the logs for previous versions of a pod, use: kubectl logs <pod_id> -p.
You can also look at the actions Kubernetes performed on the pod using kubectl describe po <pod_id>.To see a list of Fusion services, do:Upgrading with Zero Downtime
One of the most powerful features provided by Kubernetes and a cloud-native microservices architecture is the ability to do a rolling update on a live cluster. Fusion 5 allows customers to upgrade from Fusion 5.x.y to a later 5.x.z version on a live cluster with zero downtime or disruption of service.When Kubernetes performs a rolling update to an individual microservice, there will be a mix of old and new services in the cluster concurrently (only briefly in most cases) and requests from other services will be routed to both versions. Consequently, Lucidworks ensures all changes we make to our service do not break the API interface exposed to other services in the same 5.x line of releases. We also ensure stored configuration remains compatible in the same 5.x release line.Lucidworks releases minor updates to individual services frequently, so our customers can pull in those upgrades using Helm at their discretion.To upgrade your cluster at any time, use the--upgrade option with our setup scripts in this repo.The scripts in this repo automatically pull in the latest chart updates from our Helm repository and deploy any updates needed by doing a diff of your current installation and the latest release from Lucidworks.
To see what would be upgraded, you can pass the --dry-run option to the script.Grafana Dashboards
Get the initial Grafana password from a K8s secret by doing:kubectl get services --namespace <namespace> to determine when the load balancer is setup and its IP address. Direct your browser to http://<GrafanaIP>:3000 and enter the username admin@localhost and the password that was returned in the previous step.This will log you into the application. It is recommended that you create another administrative user with a more desirable password.The dashboards and datasoure will be setup for you in grafana, simply navigate to Dashboards -> Manage to view the available dashboardsMore deployment options
- How to deploy Fusion 5 in Google Kubernetes Engine
- How to deploy Fusion 5 in Amazon Elastic Kubernetes Service
- How to deploy Fusion on 5 other Kubernetes platforms
Frequently Asked Questions
Can the stateful database services, for example, MySQL, be supported by an Azure PaaS service?This option is not supported. In theory, it may be possible to implement this function.Is it possible to use cross-zone storage solutions rather than volumes, such as Microsoft Azure file storage, for stateful services?While in theory it may be possible to implement this functionality, the configuration has not been tested by Lucidworks and is not supported.Learn more
Deploying Fusion 5
The course for Deploying Fusion 5 focuses on the prerequisite software needed to deploy Fusion, the necessary setup steps, and the physical act of deployment.
Deploy Fusion 5 on Amazon Elastic Kubernetes Service (EKS)
Deploy Fusion 5 on Amazon Elastic Kubernetes Service (EKS)
Fusion supports deployment on Amazon Elastic Kubernetes Service (EKS). This topic explains how to deploy a Fusion cluster on EKS using the Use a short name for the namespace, containing only letters, digits, or dashes (no dots or underscores). The setup scripts in this repo use the namespace for the Helm release name by default.If you already have helm installed, make sure you’re using the latest version:For other OS, please refer to the Helm installation docs: https://helm.sh/docs/using_helm/The Fusion helm chart requires that helm is greater than version To use these role in a cluster, as an admin user first create the namespace that you wish to install fusion into:Apply the Then bind the rolebinding and clusterolebinding to the install user:You will then be able to run the You should get into the habit of pulling this repo for the latest changes before performing any maintenance operations on your Fusion cluster to ensure you have the latest updates to the scripts.Cloning the github repo is preferred so that you can pull in updates to the scripts, but if you are not a git user, then you can download the project: https://github.com/lucidworks/fusion-cloud-native/archive/master.zip.
Once downloaded, extract the zip and cd into the VPC Permissions:.IAM PermissionsDownload and run the https://github.com/lucidworks/fusion-cloud-native/blob/master/setup_f5_eks.sh By default the This saves you from having to pass If all goes well, you should see a list of pods similar to:The number of pods per deployment / statefulset will vary based on your cluster size and replicaCount settings in your custom values YAML file.
Also, don’t worry if you see some pods having been restarted as that just means they were too slow to come up and Kubernetes killed and restarted them.
You do want to see at least one pod running for every service. If a pod is not running after waiting a sufficient amount of time,
use For an overview of the various Fusion 5 microservices, see: Fusion microservices.Once you’re ready to build a Fusion cluster for production, please see see more information at Fusion 5 Survival Guide.With Grafana, you can either setup a temporary port-forward to a Grafana pod or expose Grafana on an external IP using a K8s LoadBalancer.
To define a LoadBalancer, do (replace $ with your Helm release label):You can use For more information, see:
setup_f5_eks.sh script in the fusion-cloud-native repository.In addition, this topic provides information about how to configure IAM roles for the service account.Prerequisites
This section covers prerequisites and background knowledge needed to help you understand the structure of this document and how the Fusion installation process works with Kubernetes.Release Name and Namespace
Before installing Fusion, you need to choose a https://kubernetes.io/docs/concepts/overview/working-with-objects/namespaces/ Kubernetes namespace to install Fusion into. Think of a K8s namespace as a virtual cluster within a physical cluster. You can install multiple instances of Fusion in the same cluster in separate namespaces. However, please do not install more than one Fusion release in the same namespace.All Fusion services must run in the same namespace, i.e. you should not try to split a Fusion cluster across multiple namespaces.__
Install Helm
Helm is a package manager for Kubernetes that helps you install and manage applications on your Kubernetes cluster. Regardless of which Kubernetes platform you’re using, you need to installhelm as it is required to install Fusion for any K8s platform.
On MacOS, you can do:3.0.0; check your Helm version by running helm version --short.Helm User Permissions
If you require that fusion is installed by a user with minimal permissions, instead of an admin user, then the role and cluster role that will have to be assigned to the user within the namespace that you wish to install fusion in are documented in theinstall-roles directory.When working with Kubernetes on the command-line, it’s useful to create a shell alias for
kubectl, e.g.:role.yaml and cluster-role.yaml files to that namespacehelm install command as the <install_user>Clone fusion-cloud-native from GitHub
You should clone this repo from github as you’ll need to run the scripts on your local workstation:fusion-cloud-native-master directory.The https://github.com/lucidworks/fusion-cloud-native/blob/master/setup_f5_eks.sh setup_f5_eks.sh script provided in this repo is strictly optional.
The script is mainly to help those new to Kubernetes and/or Fusion get started quickly.
If you’re already familiar with K8s, Helm, and EKS, then you use Helm directly to install Fusion into an existing cluster or one you create yourself using the process described <<helm-only,here>>.If you’re new to Amazon Web Services (AWS), then please visit the Amazon Web Services https://aws.amazon.com/getting-started/ to set up an account.If you’re new to Kubernetes and EKS, then we recommend going through Amazon’s https://eksworkshop.com/introduction/ before proceeding with Fusion.Set up the AWS CLI tools
Before launching an EKS cluster, you need to install and configurekubectl, aws, eksctl, aws-iam-authenticator using the links provided below:Required AWS Command-line Tools:- kubectl: https://kubernetes.io/docs/tasks/tools/install-kubectl/
- aws: https://docs.aws.amazon.com/cli/latest/userguide/cli-chap-install.html
- eksctl: https://docs.aws.amazon.com/eks/latest/userguide/getting-started-eksctl.html
- aws-iam-authenticator: https://docs.aws.amazon.com/eks/latest/userguide/install-aws-iam-authenticator.html
aws configure to configure a profile for authenticating to AWS. You’ll use the profile name you configure in this step, which defaults to default, as the -p argument to the setup_f5_eks.sh script in the next section.When working in Ubuntu, avoid using the eksctl snap version. Alternative sources can have different versions that could cause command failures. Also, always make sure you are using the latest version for each one of the required tools.
Set up Fusion on EKS
To create a cluster in EKS the following IAM policies are required:- AmazonEC2FullAccess
- AWSCloudFormationFullAccess
setup_f5_eks.sh script to install Fusion 5.x in an EKS cluster.This script does not support multiple node pools and should not be used for production clusters.
- To create a new cluster and install Fusion, run the following command:
- Replace
my-eks-cluster,profile-name, andfusion-namespacewith your cluster, profile, and namespace values. - Pass the
--createoption with eitherdemoormulti_az.
- Replace
- To use an existing cluster and install Fusion, run the following command:
- Replace
cluster-namewith the name of the cluster you already created. - Replace
profile-namewith the name of your profile.
- Replace
default if you ran the AWS configure command without giving the profile a name.Use the --help option to see full script usage.After running the setup_f5_eks.sh script, proceed to the <<verifying,Verifying the Fusion Installation>> section below.EKS cluster overview
The EKS cluster is created usingeksctl (https://eksctl.io/). By default it will setup the following resources in your AWS account:- A dedicated VPC for the EKS cluster in the specified region with CIDR:
192.168.0.0/16 - 3 Public and 3 Private subnets within the created VPC, each with a
/19CIDR range, along with the corresponding route tables. - A NAT gateway in each Public subnet
- An Auto Scaling Group of the instance type specified by the script, which defaults to
m5.2xlarge, with 3 instances spanning the public subnets.
EKS Ingress
Thesetup_f5_eks.sh script exposes the Fusion proxy service on an external DNS name provided by an ELB over HTTP. This is done for demo or getting started purposes. However, you’re strongly encouraged to configure a K8s Ingress with TLS termination in front of the proxy service.
See: https://aws.amazon.com/premiumsupport/knowledge-center/terminate-https-traffic-eks-acm/Our EKS script creates a classic ELB for exposing fusion proxy service. In case you need to change this behavior and use https://github.com/kubernetes-sigs/aws-load-balancer-controller instead you can use the following parameters when running the setup_f5_eks.sh script:kube-system namespace is being used for installing the aws-load-balancer-controller because pods priorityClassName is set to system-cluster-critical.In case you need to deploy an internal ALB you can use the --internal-alb option. This will create the nodes in the internal subnets. Fusion will be reachable from an AWS instance located in any of the external subnets on the same VPC. To use an ALB also an ingress with a DNS name is required, you can use the -h option to create an ingress with the required DNS name.Finally, use Route 53 or your DNS provider for creating an A ALIAS DNS record for your DNS name pointing to the ingress ADRESS. You can get the address listing the ingress using the command kubectl get ing.Verifying the Fusion Installation
In this section, we provide some tips on how to verify the Fusion installation.Let’s review some useful kubectl commands.Enhance the K8s Command-line Experience
Here is a list of tools we found useful for improving your command-line experience with Kubernetes:- krew (kubectl plugin mgr): https://github.com/kubernetes-sigs/krew/
- kube-ps1 (show current context on command line prompt): https://github.com/jonmosco/kube-ps1
- kubectx / kubens (switch between clusters / namespaces): https://github.com/ahmetb/kubectx
Useful kubectl commands
kubectl reference: https://kubernetes.io/docs/reference/generated/kubectl/kubectl-commandsSet the namespace forkubectl if not using the default:-n with every command.Get a list of running pods: k get podsGet logs for a pod using a label: k logs –l app.kubernetes.io/component=query-pipelineGet pod deployment spec and details: k get pods <pod_id> -o yamlGet details about a pod events: k describe po <pod_id>Port forward to a specific pod: k port-forward <pod_id> 8983:8983SSH into a pod: k exec -it <pod_id> -- /bin/bashCPU/Memory usage report for pods: k top podsForcefully kill a pod: k delete po <pod_id> --force --grace-period 0Scale up (or down) a deployment: k scale deployment.v1.apps/<id> --replicas=NGet a list of pod versions: k get po -o jsonpath='{..image}' tr -s '[[:space:]]' '\n' sort uniqCheck Fusion Pods and Services
Once the install script completes, you can check that all pods and services are available using:kubectl logs <pod_id> to see the logs for that pod; to see the logs for previous versions of a pod, use: kubectl logs <pod_id> -p.
You can also look at the actions Kubernetes performed on the pod using kubectl describe po <pod_id>.To see a list of Fusion services, do:Upgrading with Zero Downtime
One of the most powerful features provided by Kubernetes and a cloud-native microservices architecture is the ability to do a rolling update on a live cluster. Fusion 5 allows customers to upgrade from Fusion 5.x.y to a later 5.x.z version on a live cluster with zero downtime or disruption of service.When Kubernetes performs a rolling update to an individual microservice, there will be a mix of old and new services in the cluster concurrently (only briefly in most cases) and requests from other services will be routed to both versions. Consequently, Lucidworks ensures all changes we make to our service do not break the API interface exposed to other services in the same 5.x line of releases. We also ensure stored configuration remains compatible in the same 5.x release line.Lucidworks releases minor updates to individual services frequently, so our customers can pull in those upgrades using Helm at their discretion.To upgrade your cluster at any time, use the--upgrade option with our setup scripts in this repo.The scripts in this repo automatically pull in the latest chart updates from our Helm repository and deploy any updates needed by doing a diff of your current installation and the latest release from Lucidworks.
To see what would be upgraded, you can pass the --dry-run option to the script.Grafana Dashboards
Get the initial Grafana password from a K8s secret by doing:kubectl get services --namespace <namespace> to determine when the load balancer is setup and its IP address. Direct your browser to http://<GrafanaIP>:3000 and enter the username admin@localhost and the password that was returned in the previous step.This will log you into the application. It is recommended that you create another administrative user with a more desirable password.The dashboards and datasoure will be setup for you in grafana, simply navigate to Dashboards -> Manage to view the available dashboardsConfigure IAM roles for the service account
Configuring IAM roles lets you utilize the Amazon Web Services Security Token Service (AWS STS) for short-term authentication credentials to access services like the Amazon S3 simple storage service.To configure IAM roles, your user account must be grantedadmin permissions or IAM:FullAccess. Complete the following steps:- To create the OpenID Connect (OIDC) provider, run the following command:
- To create an IAM role for the service account associated with the plugin-pod, run the following command:
This command:
- Creates an IAM role and attaches the target policy.
- Updates the existing Kubernetes
f5-connector-pluginservice account and annotates it with the IAM role. - Uses the existing
policy/AmazonS3ReadOnlyAccesspolicy.
To utilize this feature, create a data source with the settings in S3 Authentication Settings > AWS Instance Credentials Authentication Settings. For detailed installation information, AWS S3 V2 connector.
- Welcome to the AWS Security Token Service API Reference
- Temporary security credentials in IAM
- IAM roles for service accounts
- What is Amazon EKS?
- Fine-grained IAM roles for service accounts
More deployment options
- How to deploy Fusion 5 in Google Kubernetes Engine
- How to deploy Fusion 5 in Azure Kubernetes Service
- How to deploy Fusion 5 on other Kubernetes platforms
Learn more
Deploying Fusion 5
The course for Deploying Fusion 5 focuses on the prerequisite software needed to deploy Fusion, the necessary setup steps, and the physical act of deployment.
Deploy Fusion 5 on Google Kubernetes Engine (GKE)
Deploy Fusion 5 on Google Kubernetes Engine (GKE)
Fusion supports deployment on Google Kubernetes Engine (GKE). This topic explains how to deploy a Fusion cluster on GKE using the Use a short name for the namespace, containing only letters, digits, or dashes (no dots or underscores). The setup scripts in this repo use the namespace for the Helm release name by default.If you already have helm installed, make sure you’re using the latest version:For other OS, please refer to the Helm installation docs: https://helm.sh/docs/using_helm/The Fusion helm chart requires that helm is greater than version To use these role in a cluster, as an admin user first create the namespace that you wish to install fusion into:Apply the Then bind the rolebinding and clusterolebinding to the install user:You will then be able to run the You should get into the habit of pulling this repo for the latest changes before performing any maintenance operations on your Fusion cluster to ensure you have the latest updates to the scripts.Cloning the github repo is preferred so that you can pull in updates to the scripts, but if you are not a git user, then you can download the project: https://github.com/lucidworks/fusion-cloud-native/archive/master.zip.
Once downloaded, extract the zip and cd into the Use a short name for the namespace, containing only letters, digits, or dashes (no dots or underscores). The setup scripts in this repo use the namespace for the Helm release name by default.If you already have helm installed, make sure you’re using the latest version:For other OS, please refer to the Helm installation docs: https://helm.sh/docs/using_helm/The Fusion helm chart requires that helm is greater than version To use these role in a cluster, as an admin user first create the namespace that you wish to install fusion into:Apply the Then bind the rolebinding and clusterolebinding to the install user:You will then be able to run the You should get into the habit of pulling this repo for the latest changes before performing any maintenance operations on your Fusion cluster to ensure you have the latest updates to the scripts.Cloning the github repo is preferred so that you can pull in updates to the scripts, but if you are not a git user, then you can download the project: https://github.com/lucidworks/fusion-cloud-native/archive/master.zip.
Once downloaded, extract the zip and cd into the Use the #WARNING# If using Helm V2, the After running the Please refer to the Kubernetes documentation on configuring an Ingress for GKE: https://cloud.google.com/kubernetes-engine/docs/tutorials/http-balancerCreate a BackendConfig object in your namespace:Then make sure that the following entries are in the right place in your values.yaml file:and upgrade your release to apply the configuration changesThe To make things easier for you when upgrading, you should add the settings from this file into your main custom values yaml file, e.g.:This way you don’t have to remember to pass the additional This saves you from having to pass If all goes well, you should see a list of pods similar to:The number of pods per deployment / statefulset will vary based on your cluster size and replicaCount settings in your custom values YAML file.
Also, don’t worry if you see some pods having been restarted as that just means they were too slow to come up and Kubernetes killed and restarted them.
You do want to see at least one pod running for every service. If a pod is not running after waiting a sufficient amount of time,
use For an overview of the various Fusion 5 microservices, see: Fusion microservices.Once you’re ready to build a Fusion cluster for production, please see see more information at Fusion 5 Survival Guide.With Grafana, you can either setup a temporary port-forward to a Grafana pod or expose Grafana on an external IP using a K8s LoadBalancer.
To define a LoadBalancer, do (replace $ with your Helm release label):You can use
setup_f5_gke.sh script in the fusion-cloud-native repository.Prerequisites
This section covers prerequisites and background knowledge needed to help you understand the structure of this document and how the Fusion installation process works with Kubernetes.Release Name and Namespace
Before installing Fusion, you need to choose a https://kubernetes.io/docs/concepts/overview/working-with-objects/namespaces/ Kubernetes namespace to install Fusion into. Think of a K8s namespace as a virtual cluster within a physical cluster. You can install multiple instances of Fusion in the same cluster in separate namespaces. However, please do not install more than one Fusion release in the same namespace.All Fusion services must run in the same namespace, i.e. you should not try to split a Fusion cluster across multiple namespaces.__
Install Helm
Helm is a package manager for Kubernetes that helps you install and manage applications on your Kubernetes cluster. Regardless of which Kubernetes platform you’re using, you need to installhelm as it is required to install Fusion for any K8s platform.
On MacOS, you can do:3.0.0; check your Helm version by running helm version --short.Helm User Permissions
If you require that fusion is installed by a user with minimal permissions, instead of an admin user, then the role and cluster role that will have to be assigned to the user within the namespace that you wish to install fusion in are documented in theinstall-roles directory.When working with Kubernetes on the command-line, it’s useful to create a shell alias for
kubectl, e.g.:role.yaml and cluster-role.yaml files to that namespacehelm install command as the <install_user>Clone fusion-cloud-native from GitHub
You should clone this repo from github as you’ll need to run the scripts on your local workstation:fusion-cloud-native-master directory.Prerequisites
This section covers prerequisites and background knowledge needed to help you understand the structure of this document and how the Fusion installation process works with Kubernetes.Release Name and Namespace
Before installing Fusion, you need to choose a https://kubernetes.io/docs/concepts/overview/working-with-objects/namespaces/ Kubernetes namespace to install Fusion into. Think of a K8s namespace as a virtual cluster within a physical cluster. You can install multiple instances of Fusion in the same cluster in separate namespaces. However, please do not install more than one Fusion release in the same namespace.All Fusion services must run in the same namespace, i.e. you should not try to split a Fusion cluster across multiple namespaces.__
Install Helm
Helm is a package manager for Kubernetes that helps you install and manage applications on your Kubernetes cluster. Regardless of which Kubernetes platform you’re using, you need to installhelm as it is required to install Fusion for any K8s platform.
On MacOS, you can do:3.0.0; check your Helm version by running helm version --short.Helm User Permissions
If you require that fusion is installed by a user with minimal permissions, instead of an admin user, then the role and cluster role that will have to be assigned to the user within the namespace that you wish to install fusion in are documented in theinstall-roles directory.When working with Kubernetes on the command-line, it’s useful to create a shell alias for
kubectl, e.g.:role.yaml and cluster-role.yaml files to that namespacehelm install command as the <install_user>Clone fusion-cloud-native from GitHub
You should clone this repo from github as you’ll need to run the scripts on your local workstation:fusion-cloud-native-master directory.The https://github.com/lucidworks/fusion-cloud-native/blob/master/setup_f5_gke.sh setup_f5_gke.sh script provided in this repo is strictly optional.
The script is mainly to help those new to Kubernetes and/or Fusion get started quickly.
If you’re already familiar with K8s, Helm, and GKE, then you can skip the script and just use Helm directly to install Fusion into an existing cluster or one you create yourself using the process described <<helm-only,here>>.Set up the Google Cloud SDK (one time only)
If you’ve already installed thegcloud command-line tools, you can skip to <<cluster-create,Create a Fusion cluster in GKE>>.These steps set up your local Google Cloud SDK environment so that you’re ready to use the command-line tools to manage your Fusion deployment.Usually, you only need to perform these setup steps once. After that, you’re ready to create a cluster.For a nice getting started tutorial for GKE, see: https://cloud.google.com/kubernetes-engine/docs/deploy-app-clusterHow to set up the Google Cloud SDK:- https://console.cloud.google.com/apis/library/container.googleapis.com?q=kubernetes%20engine
- Log in to Google Cloud:
gcloud auth login - Set up the Google Cloud SDK:
gcloud config set compute/zone <zone-name>If you are working with regional clusters instead of zone clusters, usegcloud config set compute/region <region-name>instead.gcloud config set core/account <email address>- New GKE projects only:
gcloud projects create <new-project-name>If you have already created a project, for example in https://console.cloud.google.com/, then skip to the next step. gcloud config set project <project-name>
kubectl using:Create a single-node demo cluster
Run the https://github.com/lucidworks/fusion-cloud-native/blob/master/setup_f5_gke.shsetup_f5_gke.sh script to install Fusion 5.x in a GKE cluster. To create a new, single-node demo cluster and install Fusion, simply do:--help option to see script usage. If you want the script to create a cluster for you, then you need to pass the --create option with either demo or multi_az. If you don’t want the script to create a cluster, then you need to create a cluster before running the script and simply pass the name of the existing cluster using the -c parameter.If you pass --create demo to the script, then we create a single node GKE cluster (defaults to using n1-standard-8 node type). The minimum node type you’ll need for a 1 node cluster is an n1-standard-8 (on GKE) which has 8 CPU and 30 GB of memory. This is cutting it very close in terms of resources as you also need to host all of the Kubernetes system pods on this same node. Obviously, this works for kicking the tires on Fusion 5.1 but is not sufficient for production workloads.You can change the instance type using the -i parameter; see: https://cloud.google.com/compute/docs/regions-zones/#available for a list of which machine types are available in your desired region.If not provided the script generates a custom values file named
gke_<cluster>_<namespace>_fusion_values.yaml which you can use to customize the Fusion chart.__setup_f5_gke.sh script installs Helm’s tiller component into your GKE cluster with the cluster admin role. If you don’t want this, then please upgrade to Helm v3.If you see an error similar to the following, then wait a few seconds and try running the setup_f5_gke.sh script again with the same arguments as this is usually a transient issue:setup_f5_gke.sh script, proceed to the <<verifying,Verifying the Fusion Installation>> section below.When you’re ready to deploy Fusion to a production-like environment, see more information at Fusion 5 Survival Guide.Create a three-node regional cluster to withstand a zone outage
With a three-node regional cluster, nodes are deployed across three separate availability zones.<cluster>value should be the name of a non-existent cluster; the script will create the new cluster.<project>must match the name of an existing project in GKE. Rungcloud config get-value projectto get this value.<namespace>Kubernetes namespace to install Fusion into, defaults todefaultwith releasef5<region-name>value should be the name of a GKE region, defaults tous-west1. Rungcloud config get-value compute/zoneto get this value.
solr_zone system property set to the zone it is running in, such as -Dsolr_zone=us-west1-a.After running the setup_f5_gke.sh script, proceed to the <<verifying,Verifying the Fusion Installation>> section below.When you’re ready to deploy Fusion to a production-like environment, see more information at Fusion 5 Survival Guide.GKE Ingress and TLS
The Fusion proxy service provides authentication and serves as an API gateway for accessing all other Fusion services. It’s typical to use an Ingress for TLS termination in front of the proxy service.Thesetup_f5_gke.sh supports creating an Ingress with a TLS cert for a domain you own by passing: -t -h <hostname>After the script runs, you need to create an A record in GCP’s DNS service to map your domain name to the Ingress IP. Once this occurs, our script setup uses https://letsencrypt.org/ to issue a TLS cert for your Ingress.To see the status of the Let’s Encrypt issued certificate, do:The GCP Ingress defaults to a 30 second timeout, which can lead to false negatives for long running requests such as importing apps. To configure the timeout for the backend in kubernetes:
Ingresses and externalTrafficPolicy
When running a fusion cluster behind an externally controlled LoadBalancer it can be advantageous to configure theexternalTrafficPolicy of the proxy service to Local. This preserves the client
source IP and avoids a second hop for LoadBalancer and NodePort type services, but risks potentially
imbalanced traffic spreading. Although when running in a cluster with a dedicated pool for spark jobs
that can scale up and down freely it can prevent unwanted request failures. This behaviour can be
altered with the api-gateway.service.externalTrafficPolicy value, which is set to Local if the example values
file is used.You must use externalTrafficPolicy=Local for the Trusted HTTP Realm to work correctly.If you are already using a custom ‘values.yaml’ file, create an entry for externalTrafficPolicy under api-gateway service.Considerations when using the nginx ingress controller
If you are using thenginx ingress controller to fulfil your ingress definitions there are a couple
of options that are recommended to be set in the configmap:Custom values
There are some example values files that can be used as a starting point for resources, affinity and replica count configuration in theexample-values folder.
These can be passed to the install script using the --values option, for example:--values option can be passed multiple times, if the same configuration property is contained within multiple values files then the values from the latest file passed as a --values option are used.Connectors custom values
If you are using Fusion 5.9 or later, you can specify resources and replica count per connector. This allows you to set different resource limits for each connector. If you do not set custom values for a connector, that connector uses the default values.Set each connector’s resource values in theconnector-plugin section under pluginValues. The pluginValues section is a list of plugins and its resources. The following sample shows an example.-
<1>The plugin ID. The plugin ID must match the plugin ID on the plugin ZIP file. without thelucidworks.prefix. For example, if the plugin ID on the plugin ZIP file islucidworks.sharepoint-optimized, the plugin ID issharepoint-optimized. -
<2>The resources settings. You may specify the limits, the requests, and the CPU and memory for each. -
<3>The number of replicas per connector. This value is 1 by default.
After editing the
connector-plugin section, you must reinstall the affected connector.Upgrades and Ingress
If you used the
-t -h <hostname> options when installing your cluster, our script created an additional values yaml file named tls-values.yaml.tls-values.yaml file when upgrading.Verifying the Fusion Installation
In this section, we provide some tips on how to verify the Fusion installation.Let’s review some useful kubectl commands.Enhance the K8s Command-line Experience
Here is a list of tools we found useful for improving your command-line experience with Kubernetes:- krew (kubectl plugin mgr): https://github.com/kubernetes-sigs/krew/
- kube-ps1 (show current context on command line prompt): https://github.com/jonmosco/kube-ps1
- kubectx / kubens (switch between clusters / namespaces): https://github.com/ahmetb/kubectx
Useful kubectl commands
kubectl reference: https://kubernetes.io/docs/reference/generated/kubectl/kubectl-commandsSet the namespace forkubectl if not using the default:-n with every command.Get a list of running pods: k get podsGet logs for a pod using a label: k logs –l app.kubernetes.io/component=query-pipelineGet pod deployment spec and details: k get pods <pod_id> -o yamlGet details about a pod events: k describe po <pod_id>Port forward to a specific pod: k port-forward <pod_id> 8983:8983SSH into a pod: k exec -it <pod_id> -- /bin/bashCPU/Memory usage report for pods: k top podsForcefully kill a pod: k delete po <pod_id> --force --grace-period 0Scale up (or down) a deployment: k scale deployment.v1.apps/<id> --replicas=NGet a list of pod versions: k get po -o jsonpath='{..image}' | tr -s '[[:space:]]' '\n' | sort | uniqCheck Fusion Pods and Services
Once the install script completes, you can check that all pods and services are available using:kubectl logs <pod_id> to see the logs for that pod; to see the logs for previous versions of a pod, use: kubectl logs <pod_id> -p.
You can also look at the actions Kubernetes performed on the pod using kubectl describe po <pod_id>.To see a list of Fusion services, do:Upgrading with Zero Downtime
One of the most powerful features provided by Kubernetes and a cloud-native microservices architecture is the ability to do a rolling update on a live cluster. Fusion 5 allows customers to upgrade from Fusion 5.x.y to a later 5.x.z version on a live cluster with zero downtime or disruption of service.When Kubernetes performs a rolling update to an individual microservice, there will be a mix of old and new services in the cluster concurrently (only briefly in most cases) and requests from other services will be routed to both versions. Consequently, Lucidworks ensures all changes we make to our service do not break the API interface exposed to other services in the same 5.x line of releases. We also ensure stored configuration remains compatible in the same 5.x release line.Lucidworks releases minor updates to individual services frequently, so our customers can pull in those upgrades using Helm at their discretion.To upgrade your cluster at any time, use the--upgrade option with our setup scripts in this repo.The scripts in this repo automatically pull in the latest chart updates from our Helm repository and deploy any updates needed by doing a diff of your current installation and the latest release from Lucidworks.
To see what would be upgraded, you can pass the --dry-run option to the script.Grafana Dashboards
Get the initial Grafana password from a K8s secret by doing:kubectl get services --namespace <namespace> to determine when the load balancer is setup and its IP address. Direct your browser to http://<GrafanaIP>:3000 and enter the username admin@localhost and the password that was returned in the previous step.This will log you into the application. It is recommended that you create another administrative user with a more desirable password.The dashboards and datasoure will be setup for you in grafana, simply navigate to Dashboards -> Manage to view the available dashboardsMore deployment options
- How to deploy Fusion 5 on Amazon Elastic Kubernetes Service
- How to deploy Fusion 5 on Azure Kubernetes Service
- How to deploy Fusion on 5 other Kubernetes platforms
Learn more
Deploying Fusion 5
The course for Deploying Fusion 5 focuses on the prerequisite software needed to deploy Fusion, the necessary setup steps, and the physical act of deployment.
Fusion 5 Upgrades
Fusion 5 Upgrades
This guide describes how to perform Fusion 5 upgrades.Lucidworks recommends upgrading to the next minor version only. For example, you should upgrade from Fusion 5.6.1 to Fusion 5.7.1 before upgrading to Fusion 5.8.0.The general upgrade process is described in this article. However, the specific upgrade procedures may vary depending on your upgrade path. For the most accurate instructions, please refer to the upgrade article specific to your upgrade.
Fusion includes upgrade scripts for natively supported deployment types. To upgrade:Except for ZooKeeper, all K8s deployments and statefulsets use a ZooKeeper instances use You can also set the Lucidworks releases minor updates to individual services frequently. Pull in those upgrades using Helm at your discretion.How to upgrade Fusion
Before upgrading, be aware of changes by checking for Deprecations and Removals between versions.
General upgrade process
Fusion natively supports deployments on supported Kubernetes platforms, including AKS, EKS, and GKE.Fusion includes an upgrade script for AKS, EKS, and GKE. This script is not generated for other Kubernetes deployments.Upgrades differ from platform to platform. See below for more information about upgrading on your platform of choice.Whenever you upgrade Fusion, you must also update your remote connectors, if you are running any. You can download the latest files at V2 Connectors Downloads.Natively supported deployment upgrades
| Deployment type | Platform |
|---|---|
| Azure Kubernetes Service (AKS) | aks |
| Amazon Elastic Kubernetes Service (EKS) | eks |
| Google Kubernetes Engine (GKE) | gke |
- Open the
<platform>_<cluster>_<release>_upgrade_fusion.shupgrade script file for editing. - Update the
CHART_VERSIONto your target Fusion version, and save your changes. - Run the
<platform>_<cluster>_<release>_upgrade_fusion.shscript. The<release>value is the same as your namespace, unless you overrode the default value using the-roption.
kubectl get pods to see the changes applied to your cluster. It may take several minutes to perform the upgrade, as new Docker images are pulled from DockerHub. To see the versions of running pods, do:Other Kubernetes deployment upgrades
To update an existing installation, do:RollingUpdate update policy:OnDelete to avoid changing critical stateful pods in the Fusion deployment. To apply changes to Zookeeper after performing the upgrade (uncommon), you need to manually delete the pods. For example:Delete one pod at a time. Verify the new pod is healthy and serving traffic, before deleting the next healthy pod.
updateStrategy under the zookeeper section in your "${MY_VALUES}" file:Upgrades with Helm v3
One of the most powerful features provided by Kubernetes and a cloud-native microservices architecture is the ability to do a rolling update on a live cluster. For example, Fusion 5 allows customers to upgrade from Fusion 5.1.0 to a later 5.x.y version on a live cluster with zero downtime or disruption of service.When Kubernetes performs a rolling update to an individual microservice, there is a mix of old and new services in the cluster. Requests from other services route to both versions.Lucidworks ensures all changes we make to our service do not break the API interface exposed to other services in the same minor release version (5.x). We also ensure that the stored configuration remains compatible in the same minor release version.
- Clone the fusion-cloud-native repo, if you haven’t already.
-
Locate the
setup_f5_<platform>.shscript that matches your Kubernetes platform. -
Run the script with the
--upgradeoption.
Helm upgrade script
Once you deploy a working cluster, use the upgrade script created by thecustomize_fusion_values.sh script. The upgrade script hard-codes the parameters and eases the need to remember which parameters to pass to the script. This is helpful when working with multiple K8s clusters. Make sure you check the script into version control alongside your custom values YAML files.Whenever you change the custom values YAML files for your cluster, you need to run the upgrade script to apply the changes. The script calls helm upgrade with the correct parameters and --values options.Important reference information
Our reference section includes information on Fusion’s API, index pipelines stages, query pipelines stages, connections, and more. See Reference for complete reference information.LucidAcademy
Lucidworks offers free training to help you get started with Fusion. Visit the LucidAcademy and select classes such as Working With Data and Query Fine-Tuning to learn how Fusion ingests, indexes, and queries data.Key Improvements over Fusion 4
Fusion 5 offers the following upgrade benefits over Fusion 4:- Predictive Merchandiser: AI-powered visual tool including abilities to pin, boost, bury, or block products, rewrite and fix misspellings, and interpret synonyms.
- Advanced Machine Learning models and jobs.
- Semantic Vector Search to improve product discovery by influencing recall, relevancy, and precision.
- Signals for automatic self-tuning relevancy.
- Goes beyond search for personalized content discovery: Browse pages, Recommendations, Chatbots, AB Testing, Analytics, and more.