Data SourcesApplications UI
A data source is a configuration that manages the import and indexing of data into an application. In the Springboard UI, data sources contain the information you want Springboard to search. For conceptual information, see Data sources.
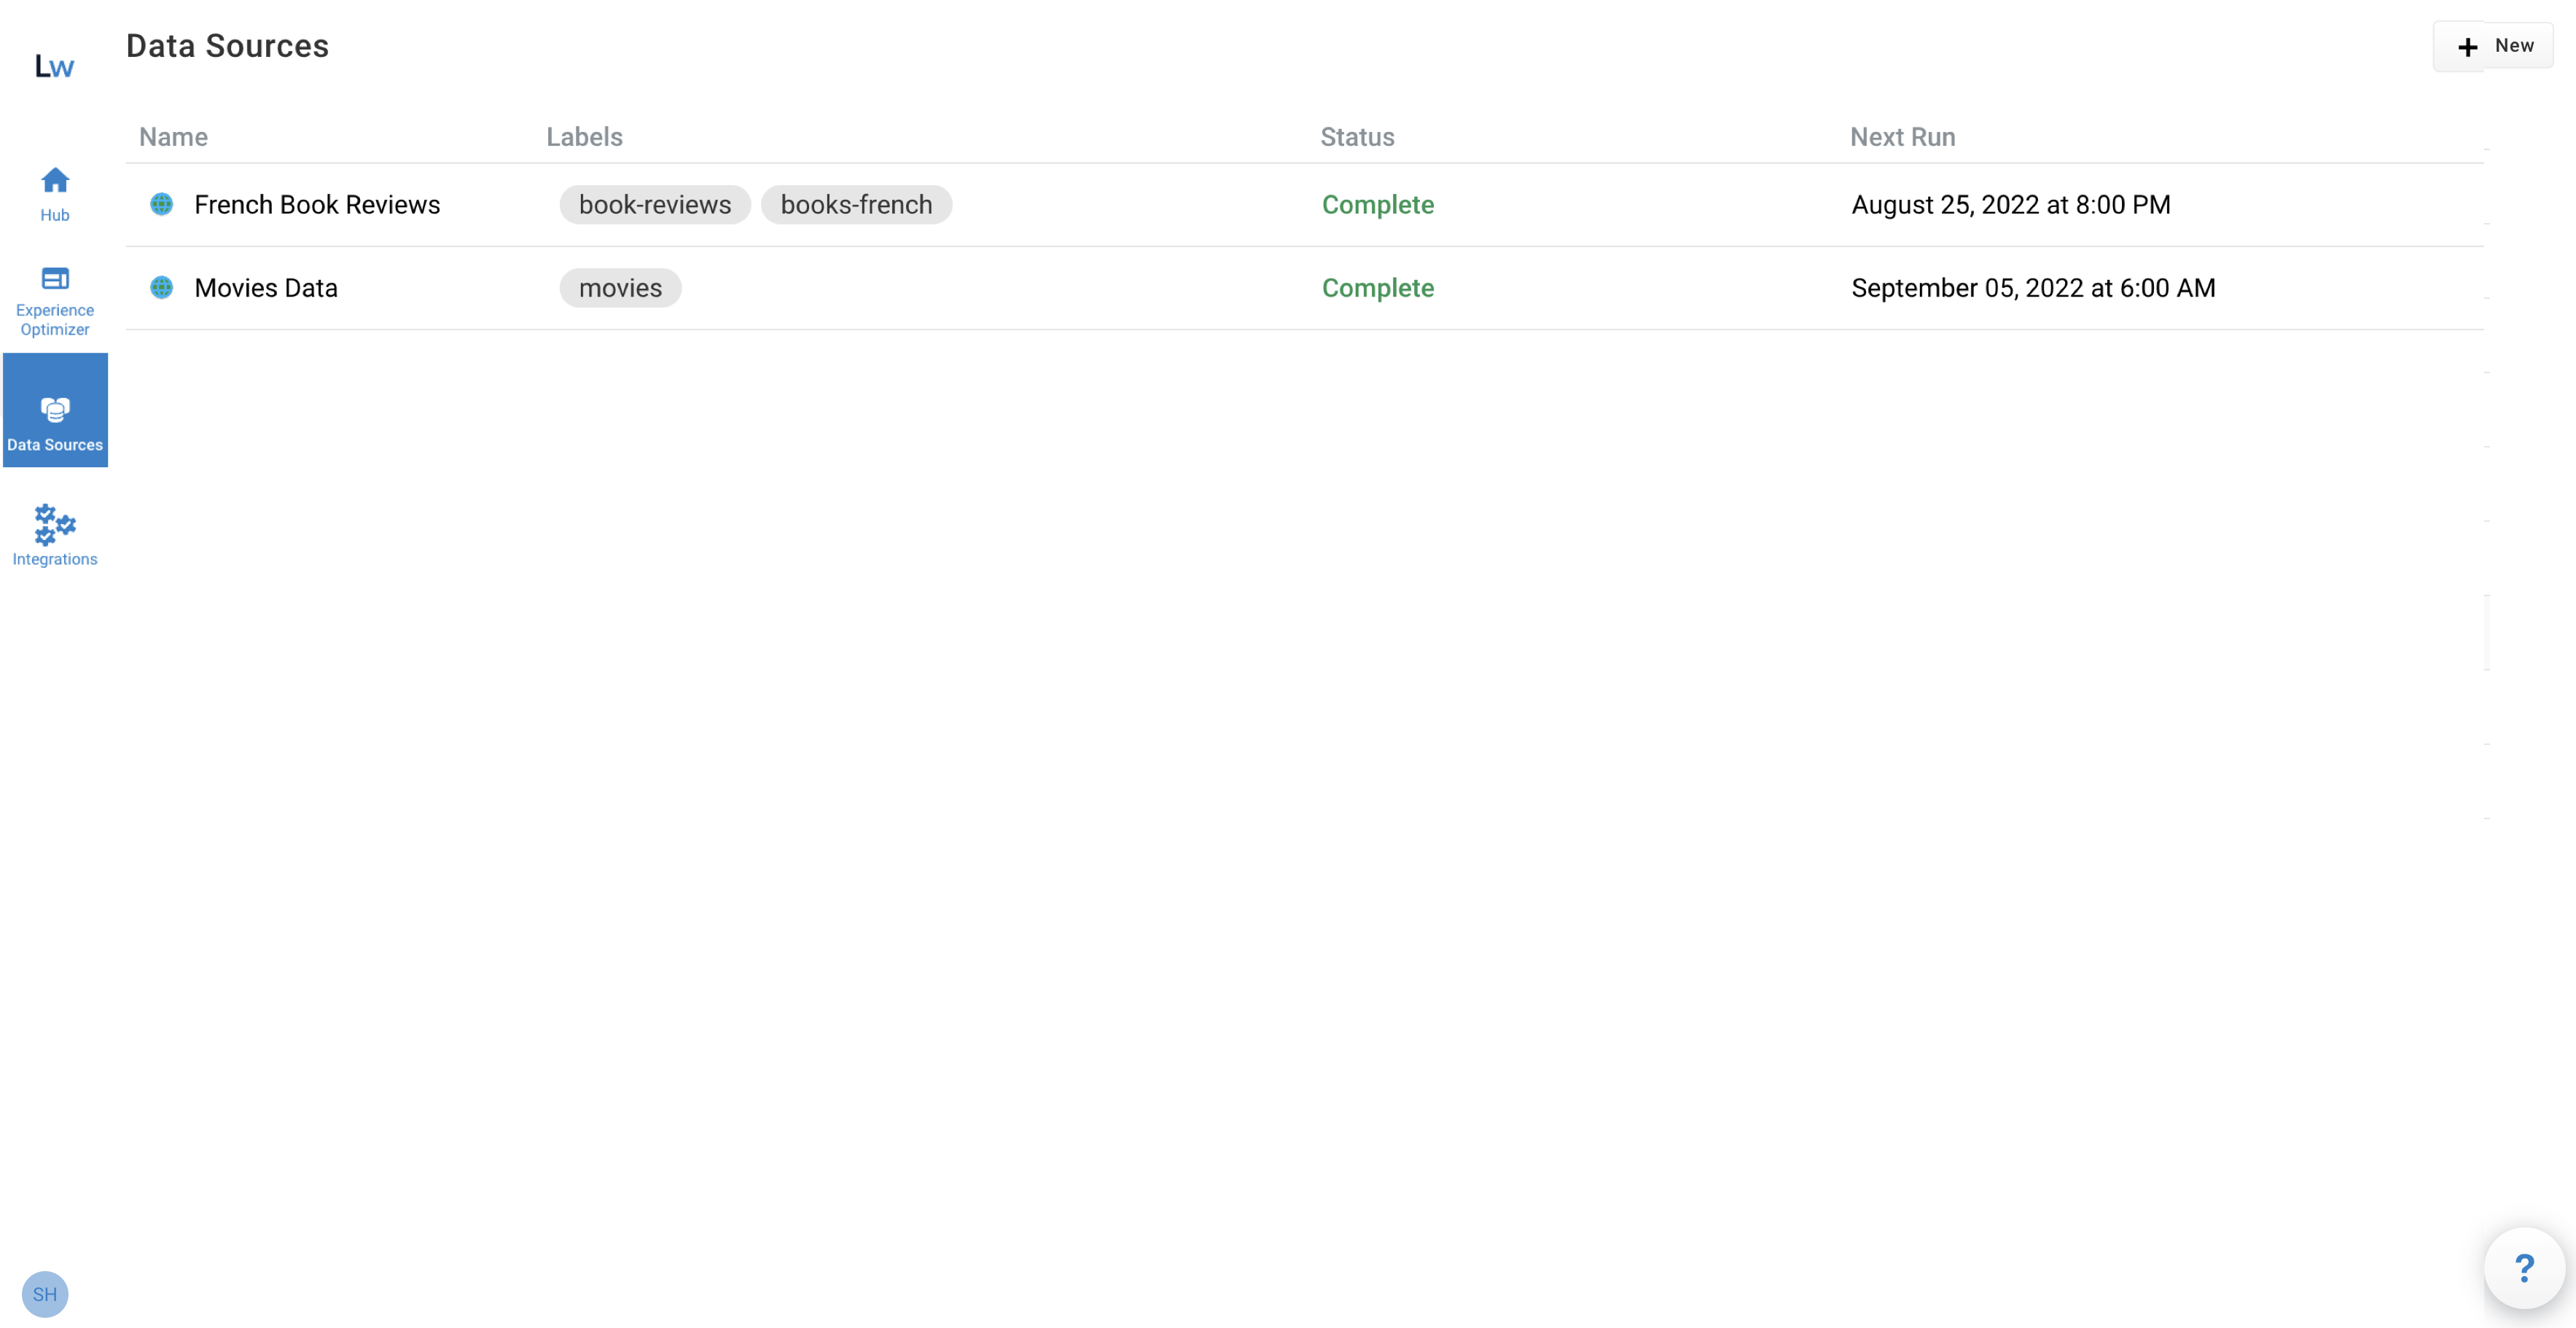
To open the screen, select the Data Sources icon from the Applications UI sidebar or Manage from the Data sources section of the Hub screen.
The Data Sources screen displays a list of existing data sources with the following information:
| Field | Description | ||
|---|---|---|---|
Name |
The unique name that identifies the data source configuration in that Springboard application. |
||
Labels |
Optional short identifier. The first label is used when sorting the data sources by the Labels column. |
||
Status |
The current status of the data source. To view the Last run date and time, point to the status text. The statuses are:
|
||
Next Run |
The date and time of the next scheduled crawl of the data source. The format is
|
| If you haven’t configured any data sources yet, a prompt to configure your first data source displays. |
To view detailed information or edit or delete the data source, point to the entry in the list and click View/Edit. The Edit Data Source screen displays.
Details tab
The Details tab displays the current configuration. For more information about how to edit or delete the data source, see Manage Springboard data sources.
History tab
History tab for non-push data sources
For web and other non-push data sources, the History tab displays the 20 most recent data source crawl entries.
| Click the arrow beside a column title to change the sort order. |
| Field | Description |
|---|---|
Job ID |
The unique identifier for the data source crawl job. You can click the |
Start Time |
The date and time the crawl started based on the user’s browser timezone settings. The format is |
Duration |
If the status of the crawl is Finished, Failed, Authentication Failed, or Cleanup Skipped, the column displays the length of time from Start Time until the crawl finished or generated the error. The format is |
Status |
The current status of the data source crawl. The statuses are:
|
Job ID detailed run report
The Job ID detailed run report only applies to non-push data source crawls, and provides job information about pages or files that were:
-
Processed and indexed
-
Excluded because the crawl encountered an access, request, or response error
-
Skipped due to an issue that prevented the page or file being indexed
| One important benefit of this report is that you can investigate why specific documents were not indexed, and make any necessary corrections. |
| Field | Description | ||
|---|---|---|---|
Job ID |
The unique identifier for the data source crawl job. |
||
Back arrow |
Displays the History tab for the data source. |
||
Search |
Enter a term or phrase from the URL, Referrer URL, or Message columns and press Enter to display the page and file entries containing that text. To clear the Search field, click X. When the field is cleared, all entries for that report display. |
||
Crawl Status filter |
Select a status to display only those entries. Options are: All, Error, Indexed, and Skipped. All displays every Error, Indexed, and Skipped page and file entry for that Job ID. |
||
Crawl Status |
Indicates the status of the page or file entry for that Job ID. Statuses are:
|
||
URL |
The URL the job crawls. |
||
Referrer URL |
The URL where the page or file entry was discovered. |
||
Message |
Information about the page or file and any processing details pertinent to the entry.
|
||
Page selection |
Select Previous, Next, or a specific page of results. |
||
Jump to |
Select a specific result page number to display. |
History tab for push data sources
For push data sources, the History tab displays the 20 most recent entries for batches that are submitted for processing.
| Click the arrow beside a column title to change the sort order. |
| Field | Description |
|---|---|
Job ID |
The unique job identifier for the specific batch associated with the push data source. |
End Time |
The date and time the push data source batch either failed or was successfully processed. |
Status |
The status of the specific batch associated with the push data source. The statuses are:
|