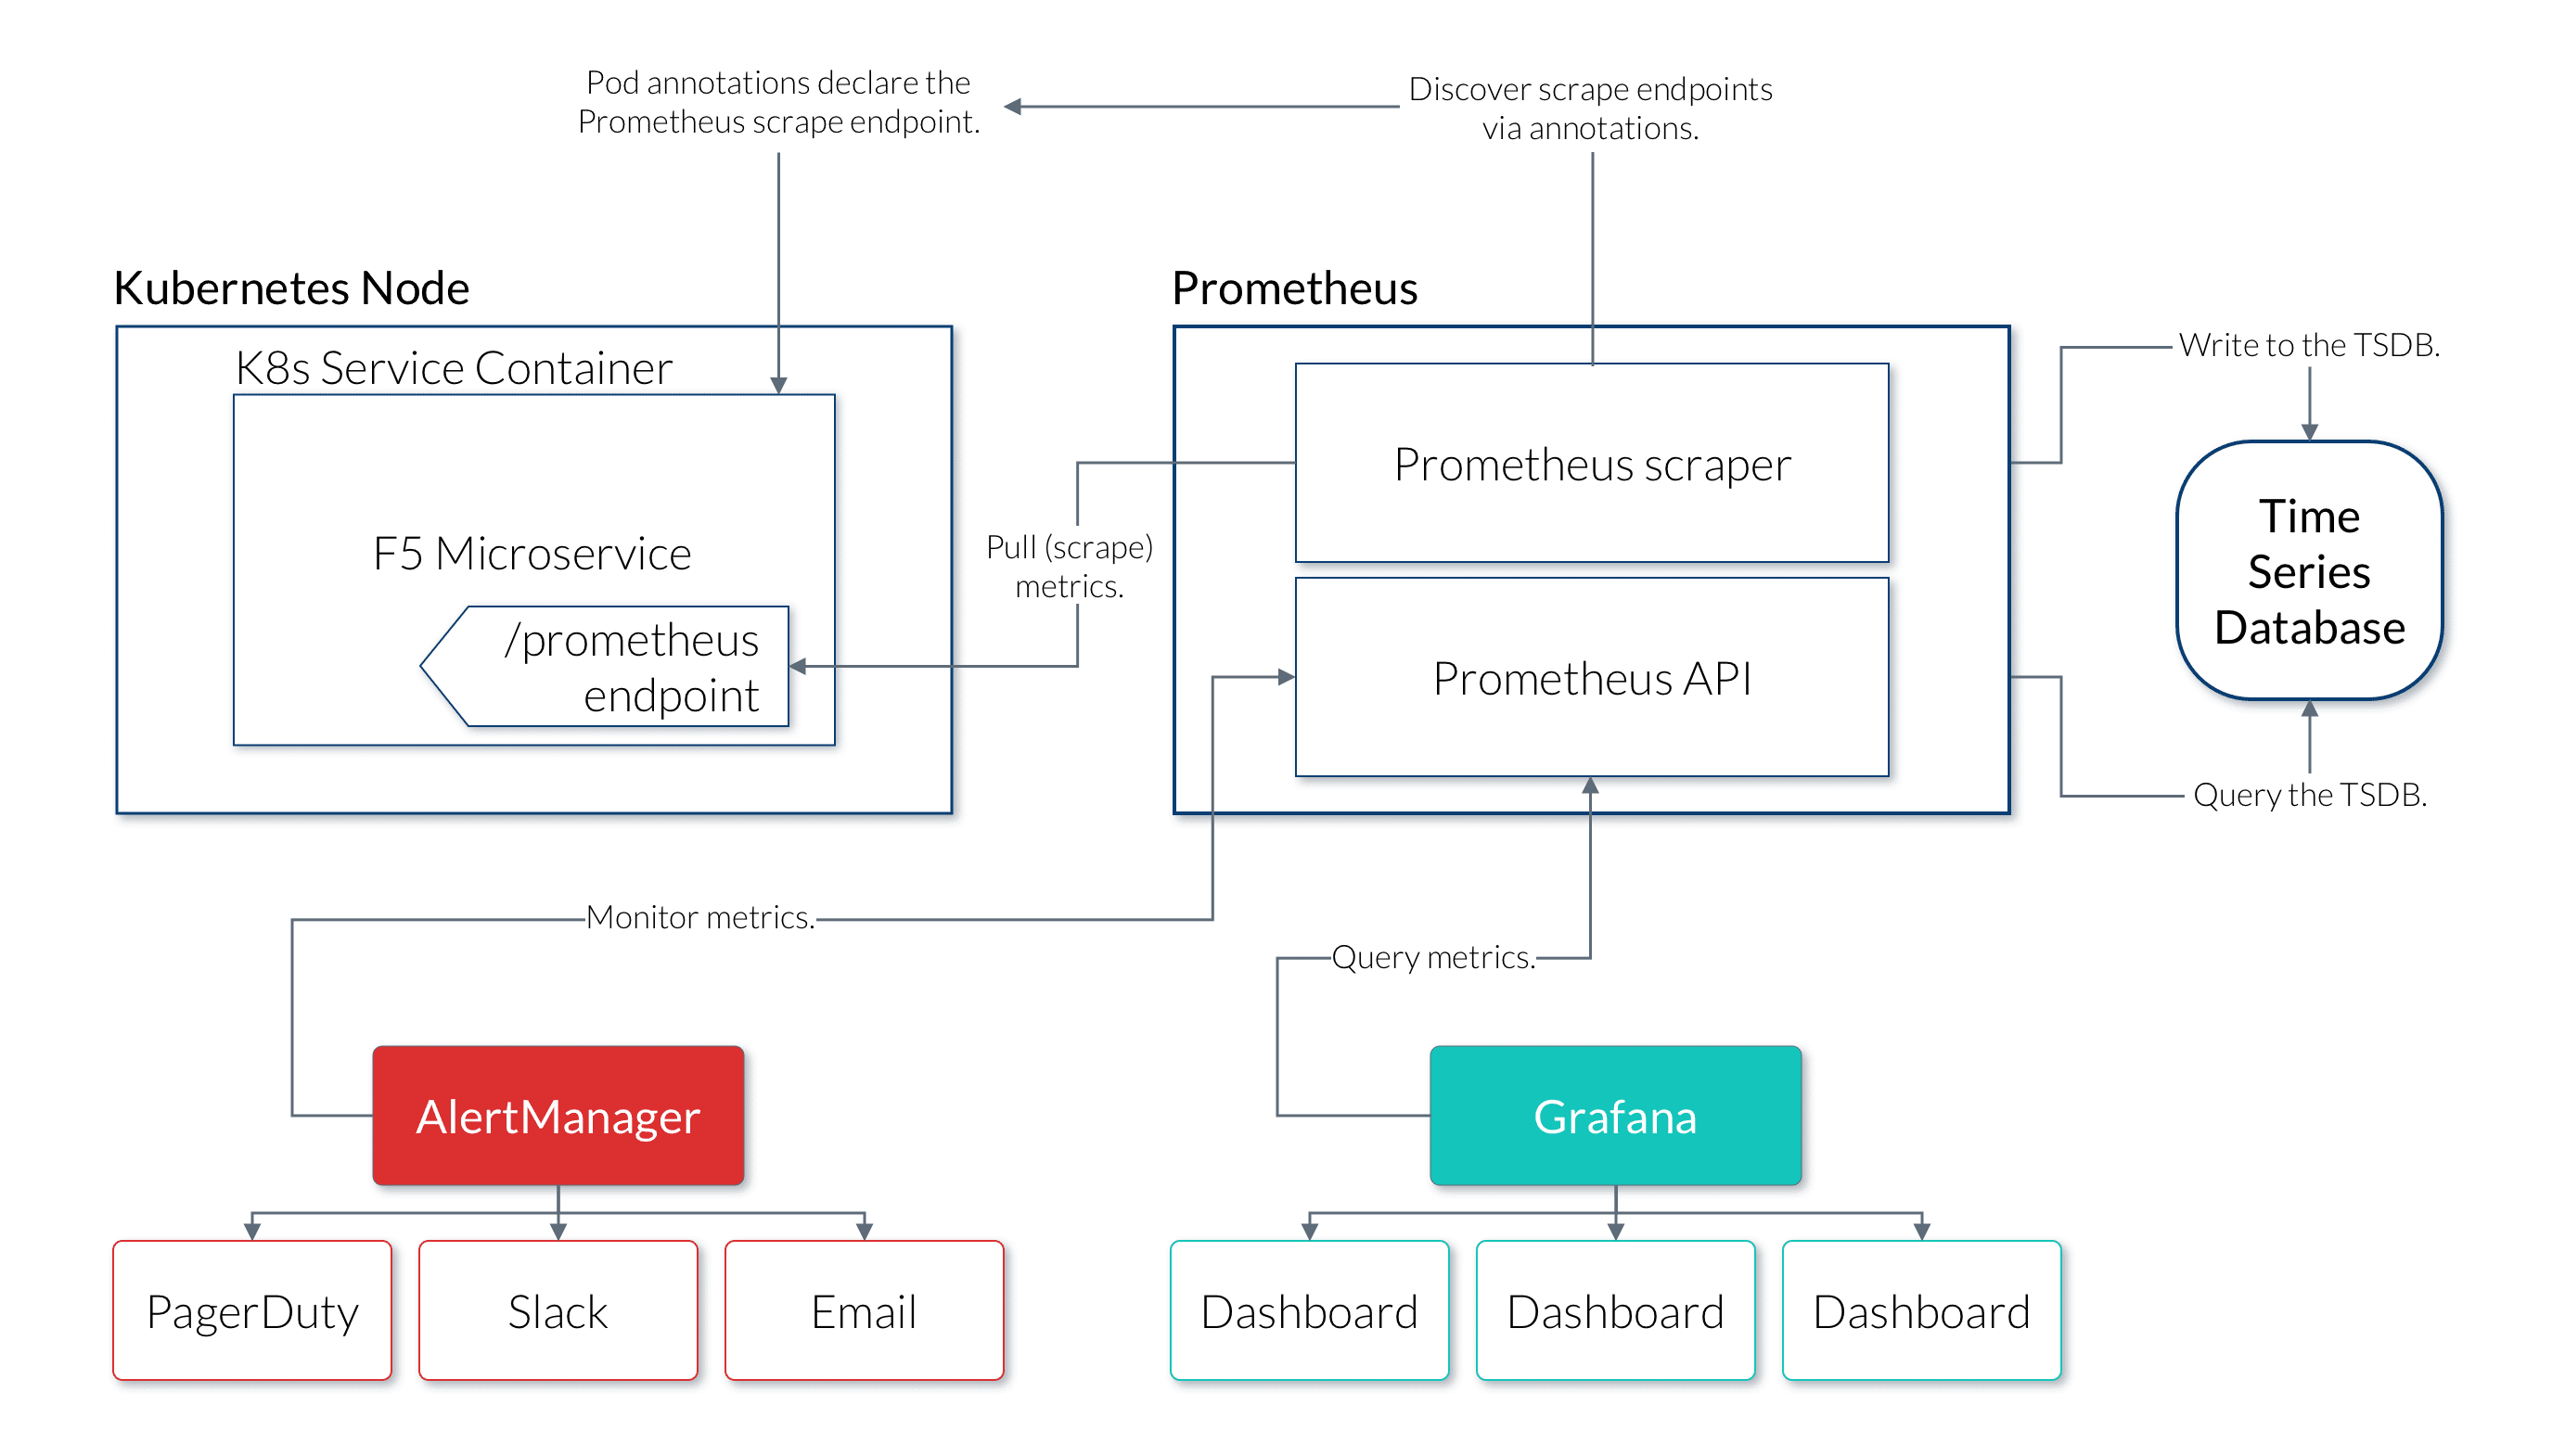
Prometheus and Grafana in Fusion
Overview
Starting in Fusion 5.0.2, support is added for Prometheus and Grafana for enhanced metrics collection and querying.
Prometheus provides a powerful solution for recording metrics, persisting them to a pluggable time series datastore, and querying them for both visualizations and alerting purposes. Metrics data is pulled from Fusion and stored in a time series datastore.
Grafana provides an industry-standard metric visualization tool that supports complex visualizations over any number of different pluggable data sources, organized into panels and managed dashboards. Grafana fully supports Prometheus as a datasource, allowing you to query against it when creating or editing panels in your dashboards.
See Grafana Dashboards for information on available Fusion 5 dashboards.
