> ## Documentation Index
> Fetch the complete documentation index at: https://doc.lucidworks.com/llms.txt
> Use this file to discover all available pages before exploring further.
# Signal Usage Metrics
export const LwTemplate = ({title = "Key questions to get you started", icon = "sparkles", cta = "Powered by Agent Studio", linkHref = "https://lucidworks.com/demo/?utm_source=docs&utm_medium=referral&utm_campaign=docs_cta_ai"}) => {
const [isLoaded, setIsLoaded] = useState(false);
useEffect(() => {
const timer = setTimeout(() => {
setIsLoaded(true);
}, 500);
return () => clearTimeout(timer);
}, []);
return
{isLoaded && `
}} />}
Powered by Lucidworks Agent Studio
;
};
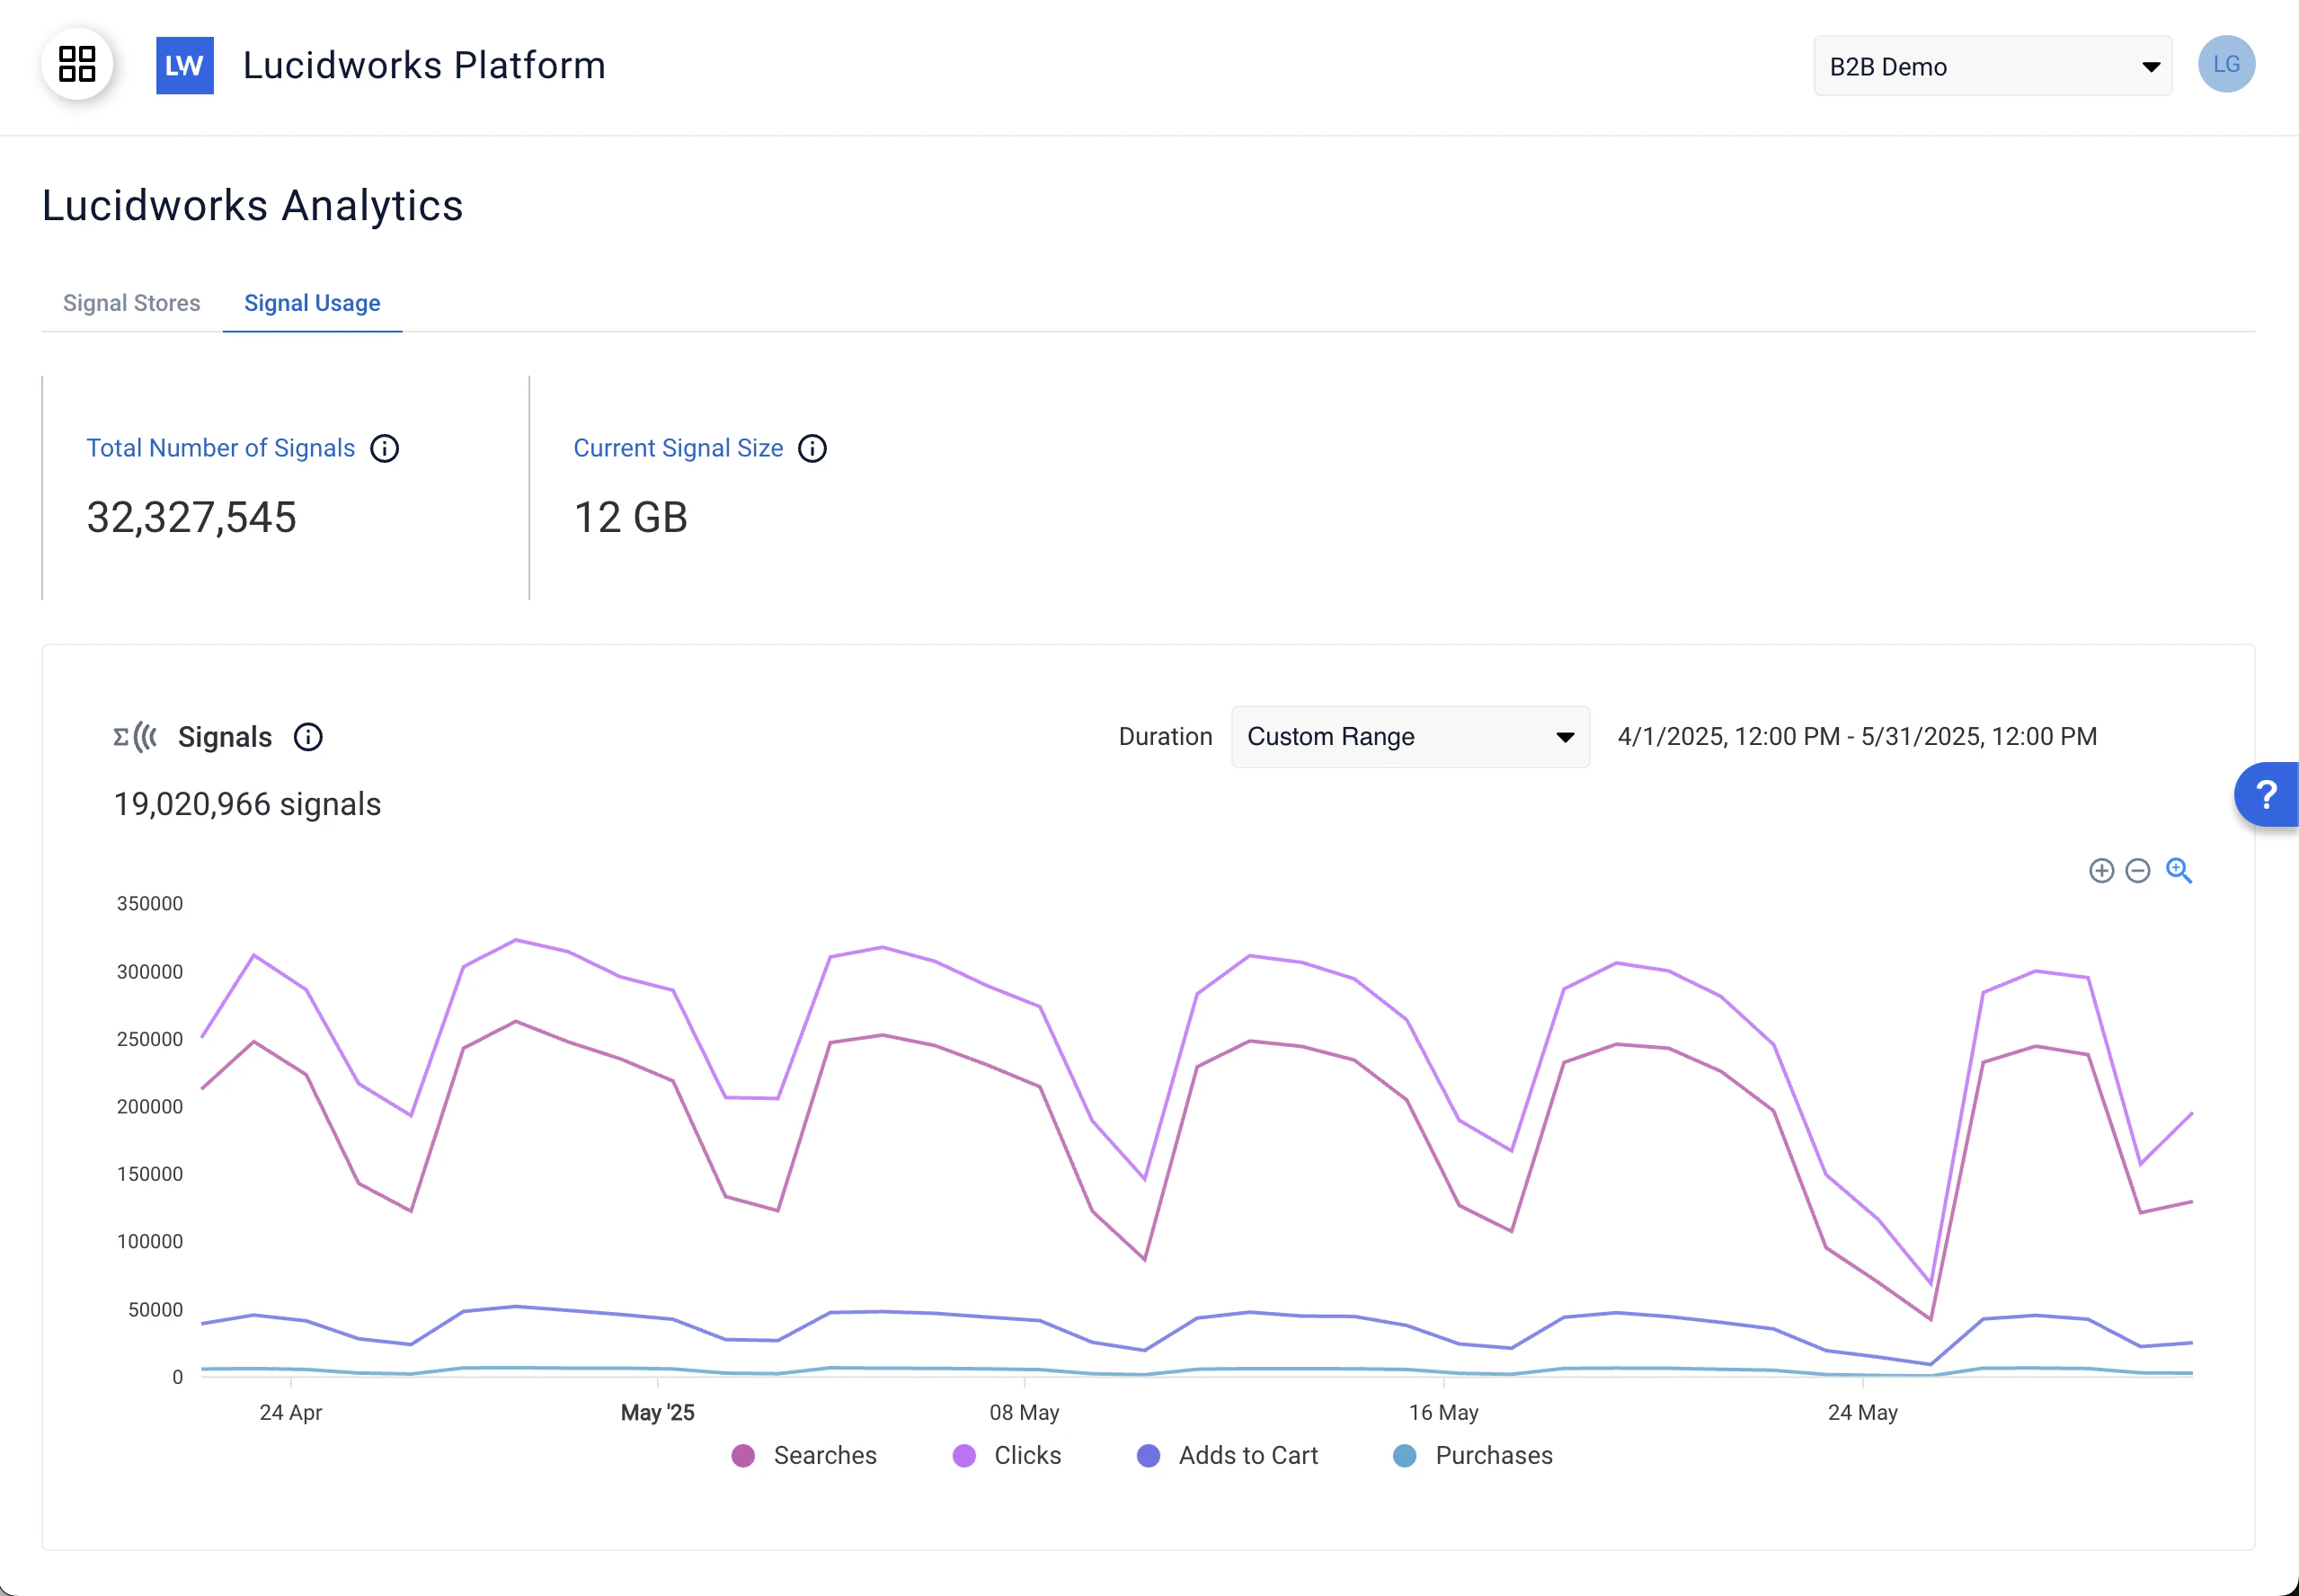
The Signal Usage screen displays global signal usage metrics for a specified date range.
Here you can see the total volume of signals from all of your signals buckets, distinguished by signal type.
You can use this screen to confirm that signals are flowing into the system so that you can use them in Analytics Studio, Commerce Studio, or anywhere signals are displayed. This graph lets you identify issues with signal intake and take prompt action to adapt settings and configuration to prevent issues that might be caused by missing signals or incomplete data.
Click your organization type for information about the benefits of using the Signal Usage screen:
These metrics reflect user behavior patterns that help you improve product offerings and campaigns that enhance the customer search experience and increase conversions. For example, a significant increase during a promotional campaign helps confirm the success of the event, and lets you adjust the campaign to increase conversions.
The Signal Usage screen helps your organization monitor data flow and identify ingestion and other issues quickly, which enhances the ability to maintain operational efficiency. For example, if a significant decrease in signals occurs, you can troubleshoot automated workflows and other areas to determine the cause.
Signal usage metrics provide information about relevance, ranking, and discoverability of site content. For example, a decrease in signals can indicate users may not be finding the information they need. A review of relevance settings and potential content gaps could help resolve any issues.
To access the Signal Usage screen, open the megamenu and click **Signals**, then click the **Signal Usage** tab.
Click **Get Started** below for a quick demo that shows you how to navigate to the Signal Usage screen and explore your signal data.
 Click **Get Started** below for a quick demo that shows you how to navigate to the Signal Usage screen and explore your signal data.