> ## Documentation Index
> Fetch the complete documentation index at: https://doc.lucidworks.com/llms.txt
> Use this file to discover all available pages before exploring further.
# Experiments
export const InlineImage = ({src, alt = '', height = '2em'}) => {
return ;
};
export const LwTemplate = ({title = "Key questions to get you started", icon = "sparkles", cta = "Powered by Agent Studio", linkHref = "https://lucidworks.com/demo/?utm_source=docs&utm_medium=referral&utm_campaign=docs_cta_ai"}) => {
const [isLoaded, setIsLoaded] = useState(false);
useEffect(() => {
const timer = setTimeout(() => {
setIsLoaded(true);
}, 500);
return () => clearTimeout(timer);
}, []);
return
{isLoaded && `
}} />}
Powered by Lucidworks Agent Studio
;
};
[localhost link]: http://localhost:3000/docs/lucidworks-search/06-metrics-and-analytics/experiments
[mintlify link]: https://doc.lucidworks.com/docs/lucidworks-search/06-metrics-and-analytics/experiments
[old doc.lw link]: https://doc.lucidworks.com/managed-fusion/5.9/mykfo7
When making changes to a query pipeline or query parameters that will affect users' search experience, it is often a good idea to run an experiment in order to verify that the results are what you intended. Lucidworks Search lets you create and run experiments that take care of dividing traffic between variants and calculating the results of each variant with respect to configurable objectives such as purchases, click-through rate or search relevance.
There are two ways that a search application might interact with an experiment:
* Preferred: Using a query profile
* Alternative: Using an Experiment query pipeline stage
If a query profile is configured to use an experiment, then a search app sends queries and signals to the query profile endpoint. If the experiment is active, then Lucidworks Search routes each query through one of the experiment variants. The search app will also send subsequent signal data relating to that query — clicks, purchases, "likes", or whatever is relevant to the application — to that same query profile, and Lucidworks Search will record it along with information about the experiment variant that the user was exposed to.
Lucidworks Search generates and stores the data that metrics calculations use. It also automatically creates jobs that periodically calculate the metrics. After metrics have been calculated, they are available in [App Insights](/docs/lucidworks-search/06-metrics-and-analytics/app-insights/overview).
This topic explains the experiment workflow and basic concepts. These additional topics provide details about how to implement experiments to improve the user experience:
* **Plan an experiment**
* **Set Up an Experiment using a Query Profile**
* **Run an Experiment**
* **Analyze experiment results**
From a planning standpoint, an experiment has these parts:
* **A baseline control.** One of the experiment variants will be the control. This is "how we are doing things today." If you are experimenting from the start, choose the simplest variant as the control.
* **Experiment variants.** Experiment variants other than the control are attempts to improve the user’s extended search experience. Which relevancy strategy works best for your search app and your users?
* **Metrics.** This is how you know whether the search variants produce differences in user interactions, and whether the differences are statistically significant.
In the remainder of this topic, you will make decisions about these broad areas, as well as about experiment details.
## Plan what you want to vary
Identify different relevancy strategies, where each represents a hypothesis about which user experience will drive more click-throughs, purchases, and so on. Use the [Query Workbench](/docs/lucidworks-search/03-ui-tour/query-workbench) to explore how to produce different search results and recommendations using different query pipelines, and evaluate which ones might engage your users most effectively.
## Plan what you want to measure
Metrics compare the control against other variants pairwise. For example, if the variants are `experiment`, `B`, `C`, and `D`, and you choose `experiment` as the control, then the comparisons for which metrics are generated will be `experiment/B`, `experiment/C`, and `experiment/D`.
For more information, see [experiment metrics](/docs/lucidworks-search/06-metrics-and-analytics/experiment-metrics).
## Design the experiment
When designing an experiment, you must make these decisions:
* How users are identified
* Percentage of total traffic to send through the experiment
* Number of variants and how they differ
* Metrics to generate
In many cases identifying users is straightforward, using an existing user ID or session ID if the application has one. In other cases, you may need to generate an identifier of some sort to send in on queries. It is important to send in some kind of identifier with each query so that the experiment can route the query to a variant, and to send that same identifier with any subsequent signals that resulted from that query. Queries without a user ID will not be routed through the experiment.
The percentage of total traffic to send through the experiment is the one variable that can change over the course of the experiment. It is often a good practice to start out sending only a small percentage of search traffic through a new experiment, in order to verify that each of the variants are functioning properly. Then, once you have established that the behavior is as intended, you can increase the percentage of traffic through the experiment to the desired level.
With modest usage and for a possibly small effect, or when testing multiple variants at the same time, you might want to send 100% of users through the experiment and let it run longer. For high usage and an effect that is expected to be larger, and with only two variants, you might not need to send all users through the experiment and the experiment will not take as long.
## Choose traffic weights
Lucidworks Search uses *traffic weights* to apportion search traffic among the variants. This allows you to send a different percentage of traffic through each variant if desired.
### Automatic traffic weights (multi-armed bandit)
The **Automatically Adjust Weights Between Variants** configuration option enables multi-armed bandits and eliminates the need to specify a traffic weight for each variant.
You must schedule metrics jobs manually. Lucidworks recommends you schedule metrics jobs to run on an hourly basis. The weights between variants only change after the metrics jobs run.
Lucidworks Search’s multi-arm bandit implementation uses a variation of [Thompson Sampling](https://en.wikipedia.org/wiki/Thompson_sampling) (sometimes called Bayesian Bandits). This algorithm uses the current count of successes versus failures to build a beta distribution that represents the level of confidence in the primary metric value for each variant. It then samples a random number from each variant’s distribution, and picks the highest number.
This type of implementation has three effects:
* It weights better-performing variants higher.
Since the beta distribution of each variant is centered around the primary metric value for that variant, a random number selected from a higher-performing variant is likely to be higher than a random number picked from a lower-performing variant.
* Lower-performing variants remain in play
Picking a random number from each distribution preserves the chance that Fusion will try a lower-performing variant, as long as there is still a chance that it is better.
* The more confident the measurements, the narrower the beta distributions become.
The more uncertain the measurements, the wider the distributions will be, and thus the more likely that Lucidworks Search will choose variants that appear to be performing more poorly.
Since Lucidworks Search adjusts the weights between variants each time the metrics jobs run, users can still get different results on subsequent visits. For example, if variant A is getting 80% of traffic, but after recalculating metrics it is only getting 50% of traffic, then some users who were previously assigned to variant A will be assigned to variant B. However, only the bare minimum of users will be reassigned to a new variant. Most users will see no changes. Once the experiment has been running for some time, the changes between the variants should be fairly small, so relatively few users should be affected.
### Manually specifying traffic weights
The formula for variant A is:
{/* // This has the `subs=...` already, but I wanted to make sure this block showed up during a search for Eliza. Blend the two as required! */}
```
Proportion~A~ = (Traffic weight~A~)/(Sum of traffic weights for all variants)
```
For example:
| Variant traffic weights | Sum of traffic weights | Variant proportions |
| ----------------------- | ---------------------- | ------------------- |
| 1.0 1.0 | 2 | 0.5 0.5 |
| 1.0 1.0 2.0 | 4 | 0.25 0.25 0.5 |
| 0.5 1.0 1.0 2.5 | 5 | 0.1 0.2 0.2 0.5 |
## Calculate sample sizes
Lucidworks Search calculates the required sample size to detect a statistically significant result based on the results at runtime. The "confidence level" metric has this minimum sample size factored in, so that confidence is always low for experiments that have not yet reached their required sample size.
However, if you would like to use different power or significance level in evaluating your experiment (Lucidworks Search uses 0.08 and 0.05), or if you would like to establish your own sample size based on a desired minimum detectable effect, you may do so.
## Choose an implementation approach
You can construct an experiment in either of two ways:
* **Experiment and query profile.** (recommended) For most cases, you will want to create additional query pipelines that return different search results. A query profile directs traffic through the query pipelines in accordance with the traffic weights of experiment variants.
* **Experiment stage in a query pipeline.** If you want to use parts of a single query pipeline in all experiment variants, you can add an Experiment stage to that pipeline (the pipeline that receives search queries). The app can direct queries to the endpoint of a query profile that references the pipeline (recommended) or to the endpoint of the query pipeline. If used, the query profile *does not* reference an experiment.
## Next step
You have planned the experiment. Next, you will set it up using either a query profile or an Experiment stage. This guide includes both options.
Perform the tasks needed to set up an experiment. This topic describes how to set up an experiment using a query profile that references the experiment.
{/* // tag::before-you-begin[] */}
## Before you begin
Before you set up an experiment, you must already have:
* **A search app.** The key aspect of the search app for experiments is that the search app identifies users in some way. A user ID might be associated with users persistently (this is best) or only for the current session. Searches and subsequent actions by anonymous users are not sent through an experiment.
{/* // + */}
{/* // TIP: You can use [Fusion App Studio](/app-studio/4.1/963/fusion-app-studio) to build your search app. */}
* **A Fusion app.** The Fusion app provides the search functionality you want to provide. Below, you will modify the app to include an experiment.
* **Data for users to search.** The app should have data that users can search and search results that users can interact with. Typically, users will search a single dataset in the sense that different users are not given search results from different datasets. But in an experiment, different experiment variants *can* use data in different collections.
* **Results for users to interact with.** Experiment metrics depend on users interacting with search results, for example, clicking on them. A search app uses signals to report the interactions to Fusion.
* **A plan for the experiment.** This plan includes which control and variants to compare, the projected traffic, sample sizes, experiment duration, metrics, and decision criteria.
Basically, you need a working system in some environment on which you want to perform experiments, and a plan for experiment variants and for deciding which results are best.
{/* // end::before-you-begin[] */}
## Create query pipelines
The primary approach for experiment variants is to have multiple query pipelines. You must create additional query pipelines as needed *before* creating the experiment.
You can also vary the collection that is searched and query parameters, which you do when creating the experiment. In fact, if that is all you are varying, you can define an experiment that uses a single query pipeline. (And you can skip this section.)
You will need the following pipelines:
* **Pipeline for the control variant.** The first variant in an experiment is the control. The A/B/n experiment metrics compare the control variant pairwise with the other variants. The control variant should probably use the default query pipeline. Here, we assume that is the case.
You could modify the configuration of the default query pipeline (which the control variant will use) before the experiment. However, doing so has two disadvantages. First, pairwise comparisons in the experiment will not be against the status quo. Second, Fusion AI will not have a baseline of historical signal data to compare against (that comparison lets an experiment reach higher confidence numbers more quickly).
* **Pipelines for other variants.** Other variants in an experiment can use other query pipelines, each with different stages and/or that are configured differently. These are "how you might do things differently."
**How to create query pipelines for non-control variants**
Create and configure the additional query pipelines you need for non-control variants. Repeat these steps for each pipeline.
{/* // tag::create-pipelines[] */}
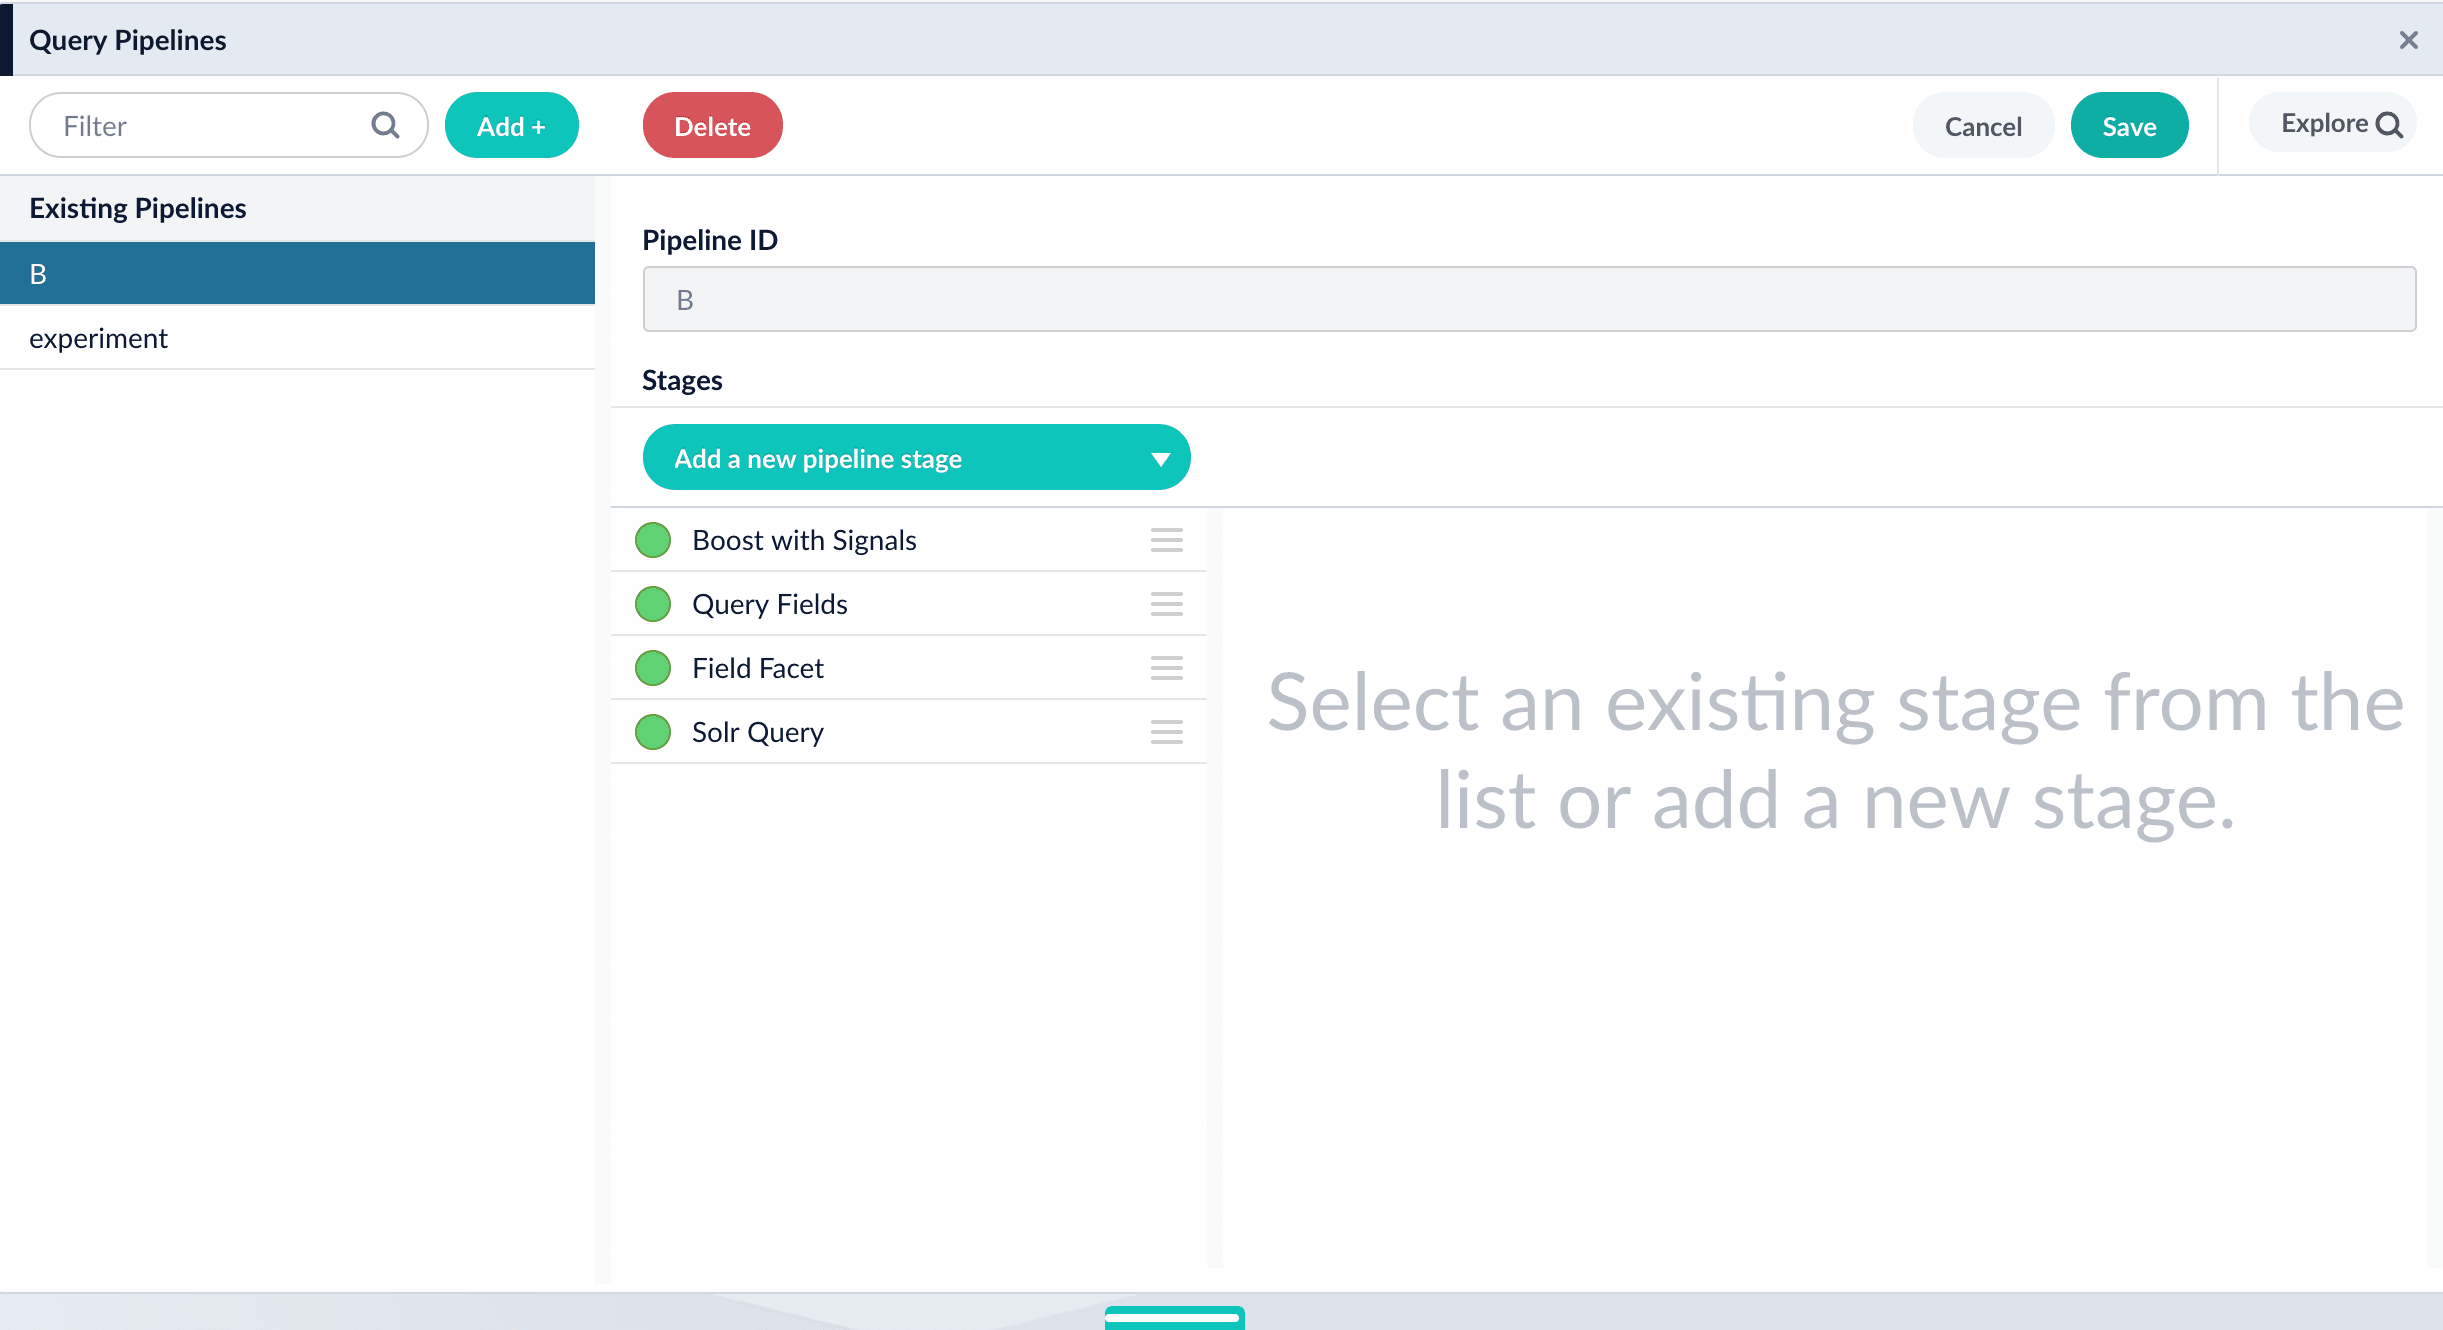
1. Navigate to Querying > **Query Pipelines**.
2. Click **Add**.
3. Enter a **Pipeline ID** (arbitrary name) for the pipeline, and then click **Save**.
4. Modify the pipeline as desired, for example, by adding, configuring, and reordering stages.
5. Click **Save**.
{/* // end::create-pipelines[] */}
## Create the query profile and the experiment
In the Fusion UI, you can use either of these equivalent approaches to set up an experiment:
* **[Create the experiment in the Query Profiles UI](#option-a-create-the-experiment-in-the-query-profiles-ui).** Choose an existing query profile or create a new one. Then create the experiment in the **Querying** > **Query Profiles** UI.
* **[Create the experiment in the Experiments UI](#option-b-create-the-experiment-in-the-experiments-ui).** Create an experiment in the **Analytics** > **Experiments** UI, and then reference the experiment in the **Querying** > **Query Profiles** UI.
### Option A: Create the experiment in the Query Profiles UI
1. **Choose or create a query profile.** Choose an existing query profile (for example, the default query profile) or create a new query profile for the experiment.
**How to choose an existing query profile:**
1. Navigate to Querying > **Query Profiles**.
2. In the left pane, click the query profile you want to use.
3. Verify that the pipeline, search handler, collection ID, and parameters are correct.
4. (Optional) Click **New params** and specify URL parameters to add to all queries for this query profile.
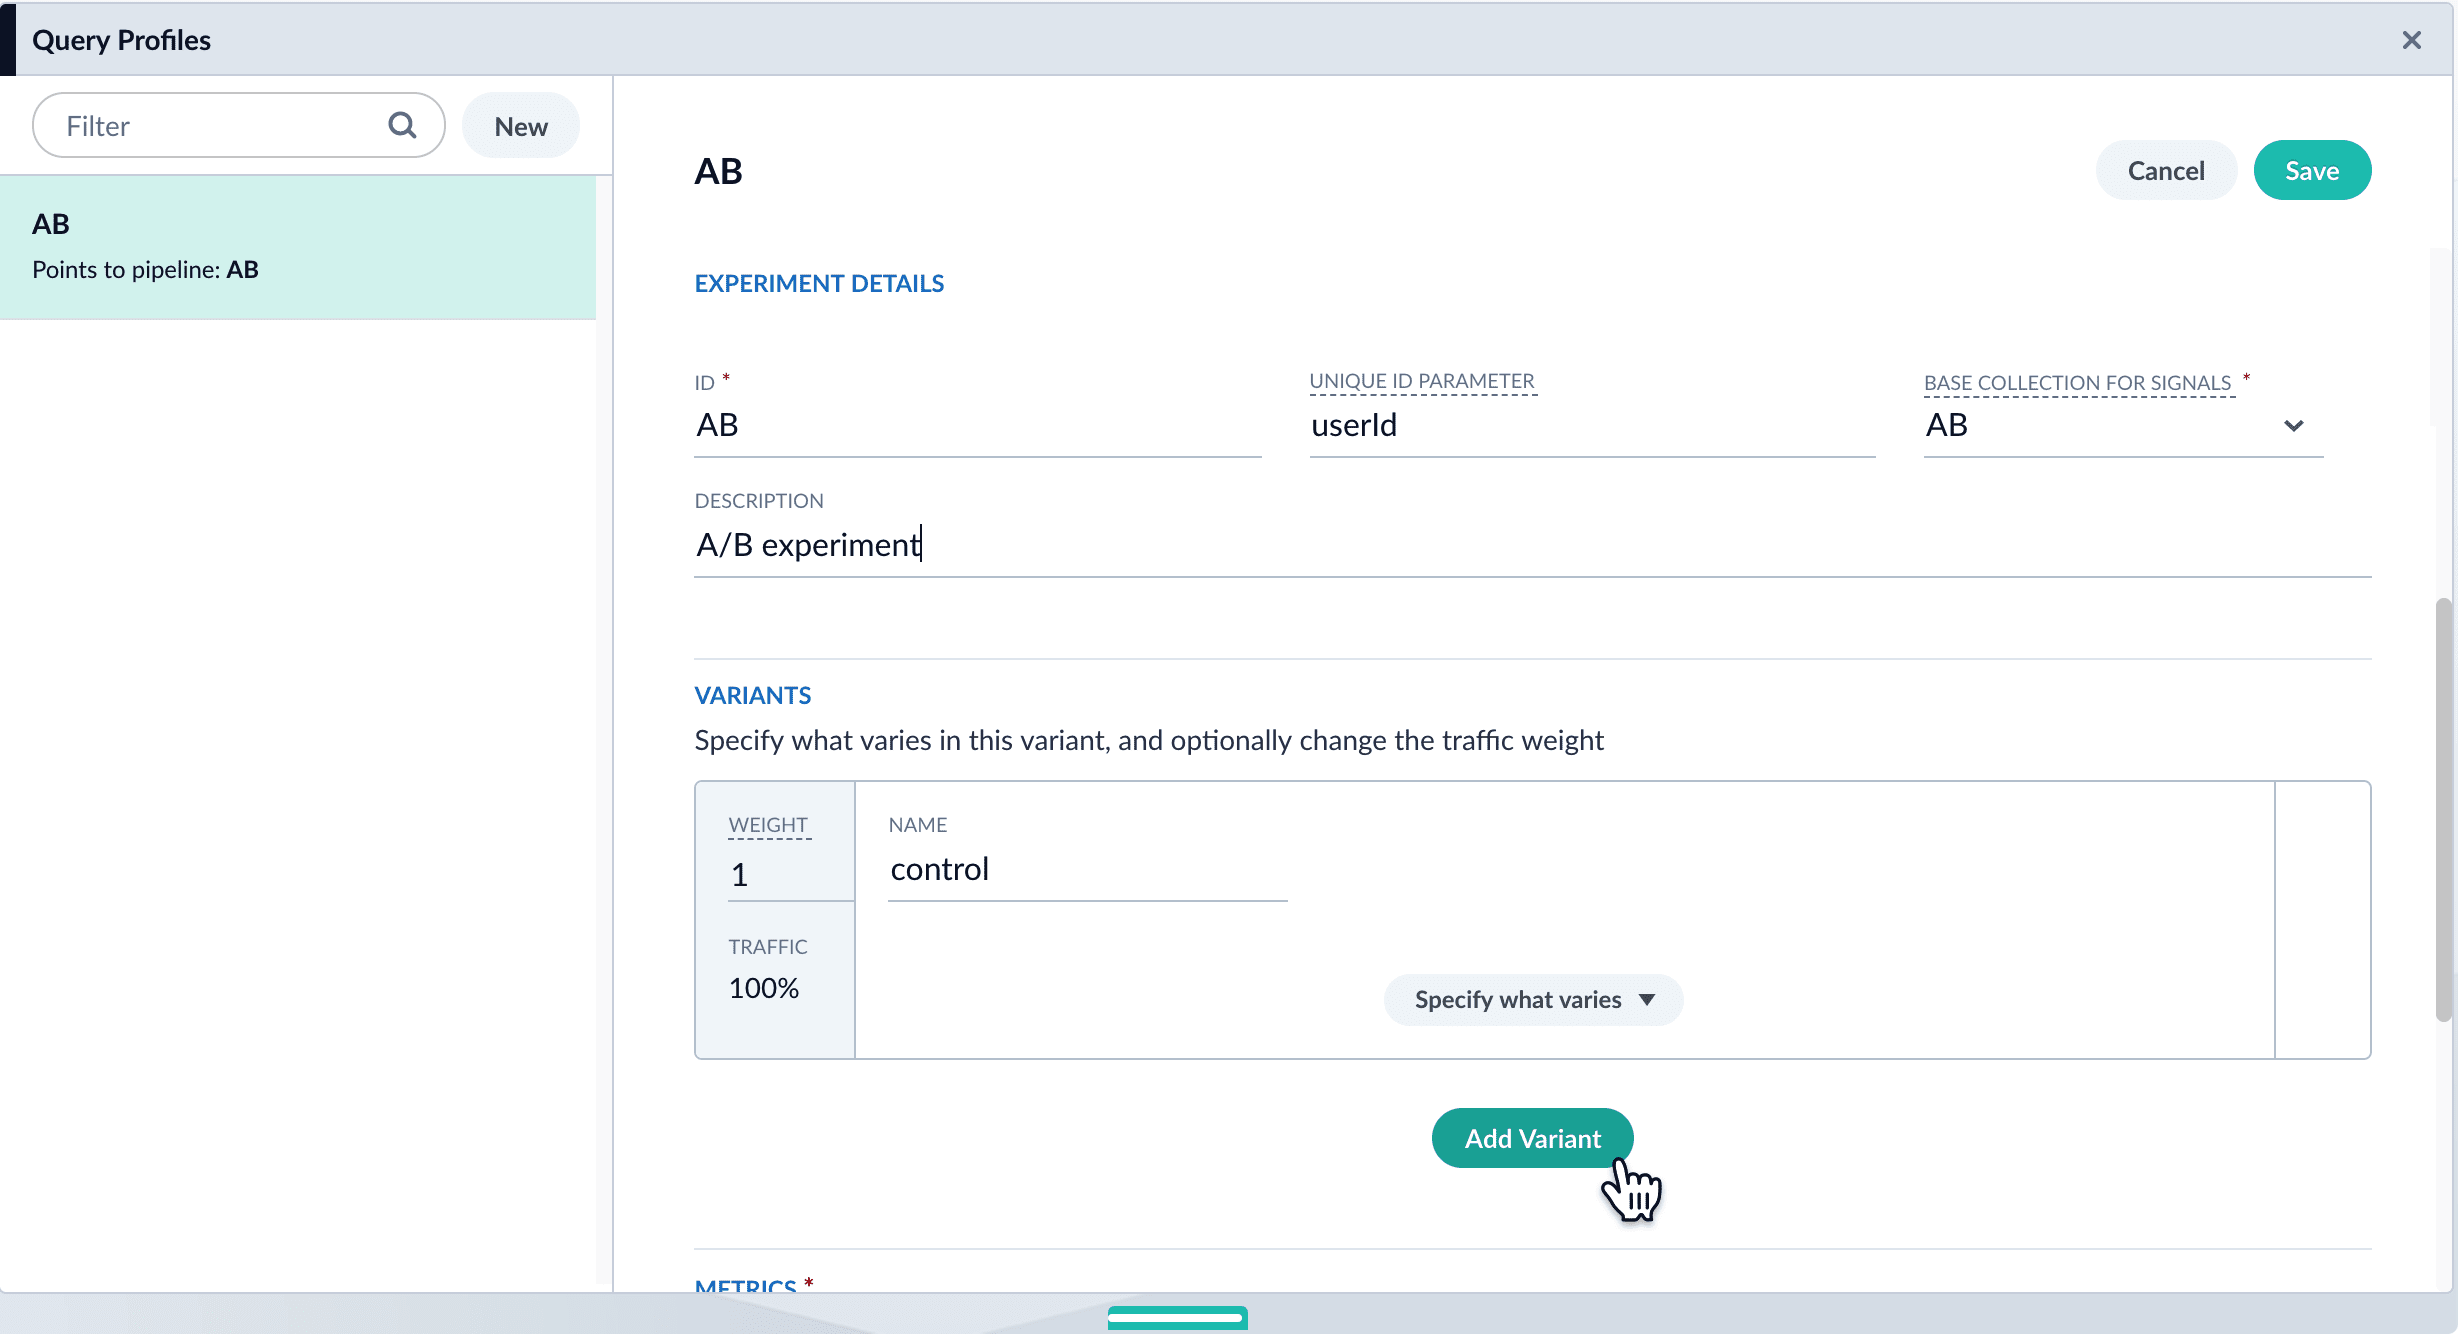
**How to create a new query profile:**
1. Navigate to Querying > **Query Profiles**.
2. Click **New**.
3. Enter a **Query Profile ID** (an arbitrary name for the query profile).
4. Choose a pipeline and a collection.
5. (Optional) Click **New params** and specify URL parameters to add to all queries for this query profile.
2. **Enable experimentation and specify experiment details in the query profile**:
1. Click the checkbox in front of **Enable experimentation**.
2. Specify the percent of traffic to include in the experiment.
3. Click the , and then click **Add Experiment**.
4. Enter an arbitrary **ID** (name) for the experiment.
5. Verify that the **unique ID parameter** is correct. It is the parameter that uniquely identifies each user. The default is `userId`. Correct the parameter if necessary, for example by specifying the session ID field instead.
6. Choose the base collection for signals. Signals resulting from requests that flow through the experiment are stored in the `_signals` collection associated with this collection.
7. (Optional) Enter a description for the experiment.
8. (Optional) To use a multi-armed bandit, select **Automatically Adjust Weights Between Variants**.
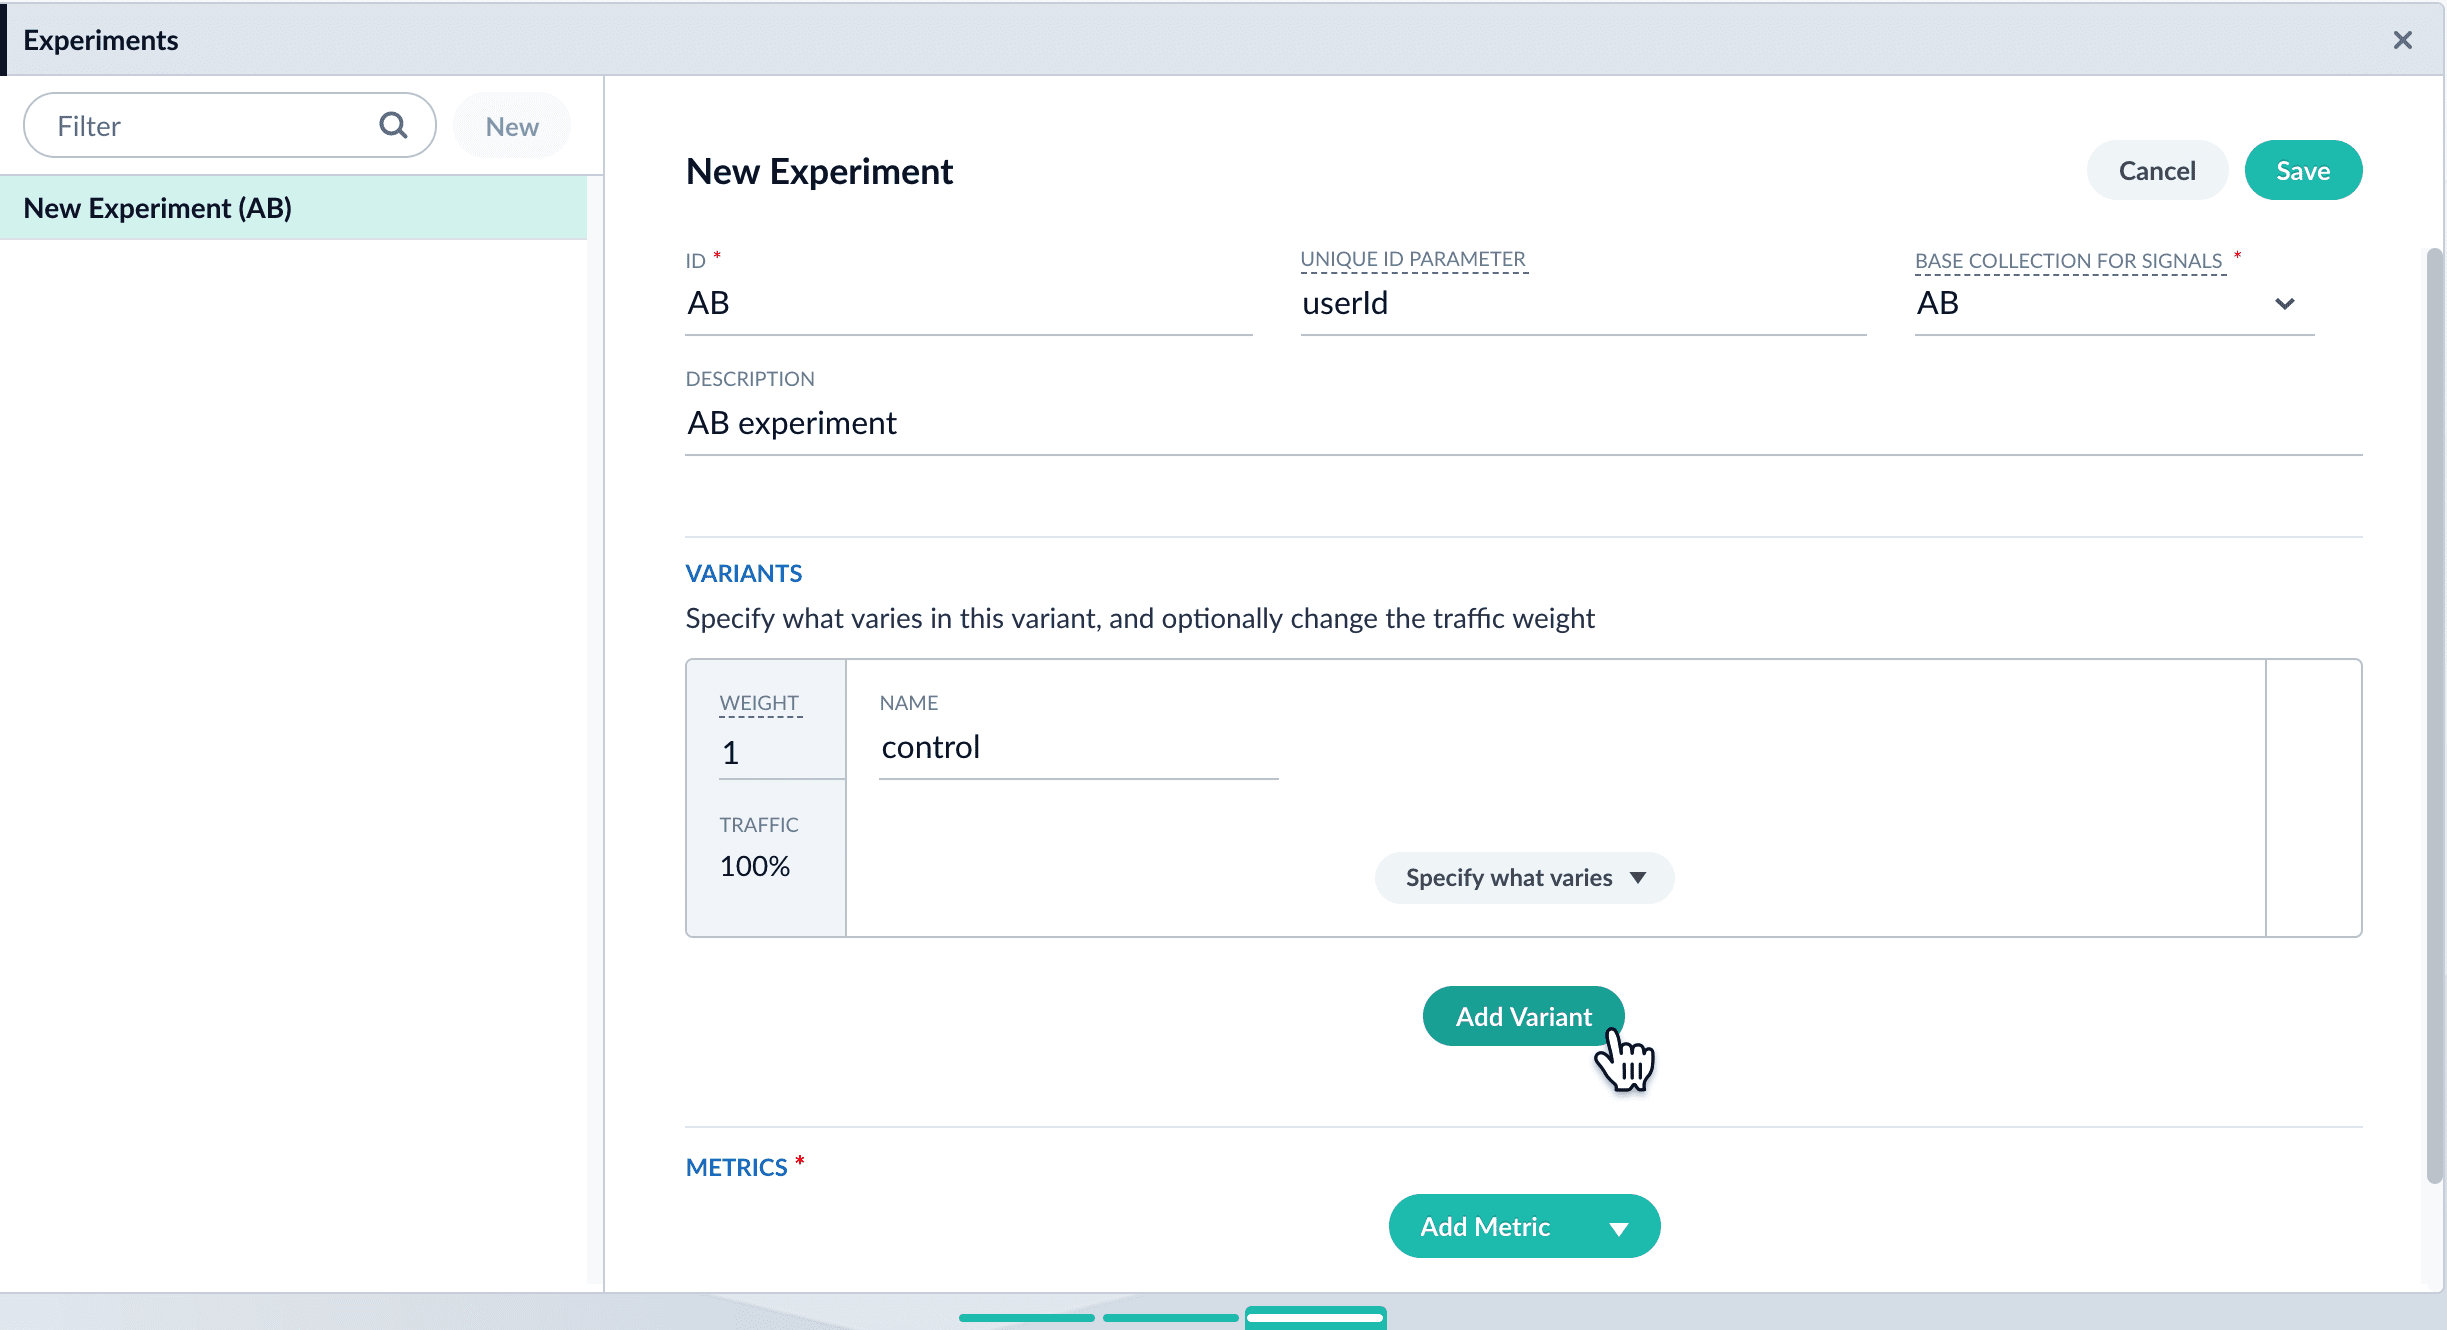
9. Add variants. Click **Add Variant** to add each non-control variant in your experiment.
10. For each variant:
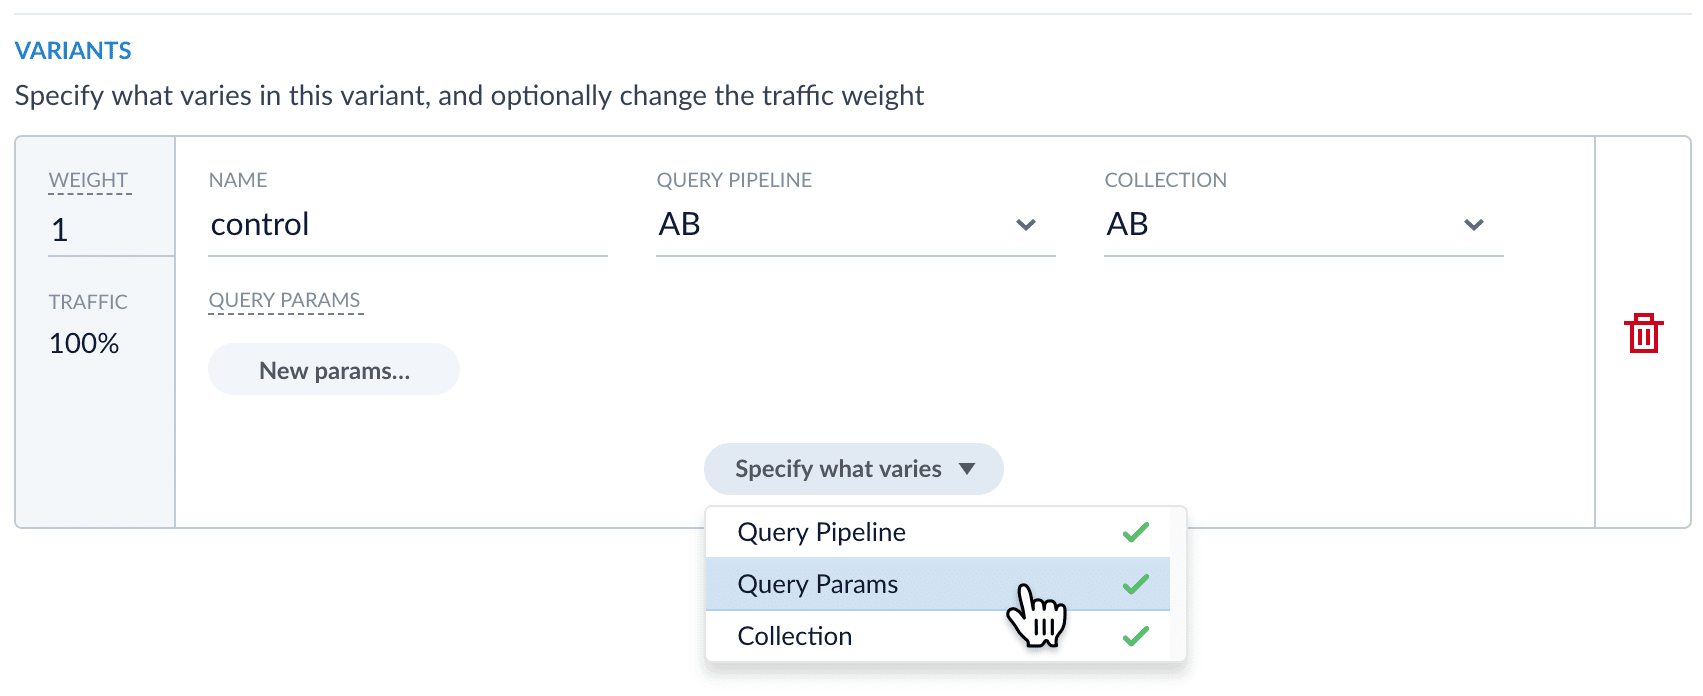
11. Enter an arbitrary name. For the first variant, which is the control, Fusion uses the name `control`. You can change that name if you wish.
12. Click **Specify what varies** and specify what varies. Items you select are visible in the variant UI and have a green check mark in the dropdown menu. You can vary the query pipeline, query parameters (URL parameters to add to the query), and/or the collection.
13. (*For query parameters*) Click **New params**. In the dialog box, specify the **Parameter Name**, **Parameter Value**, and **Update Policy** for each parameter (append, default, remove, or replace).
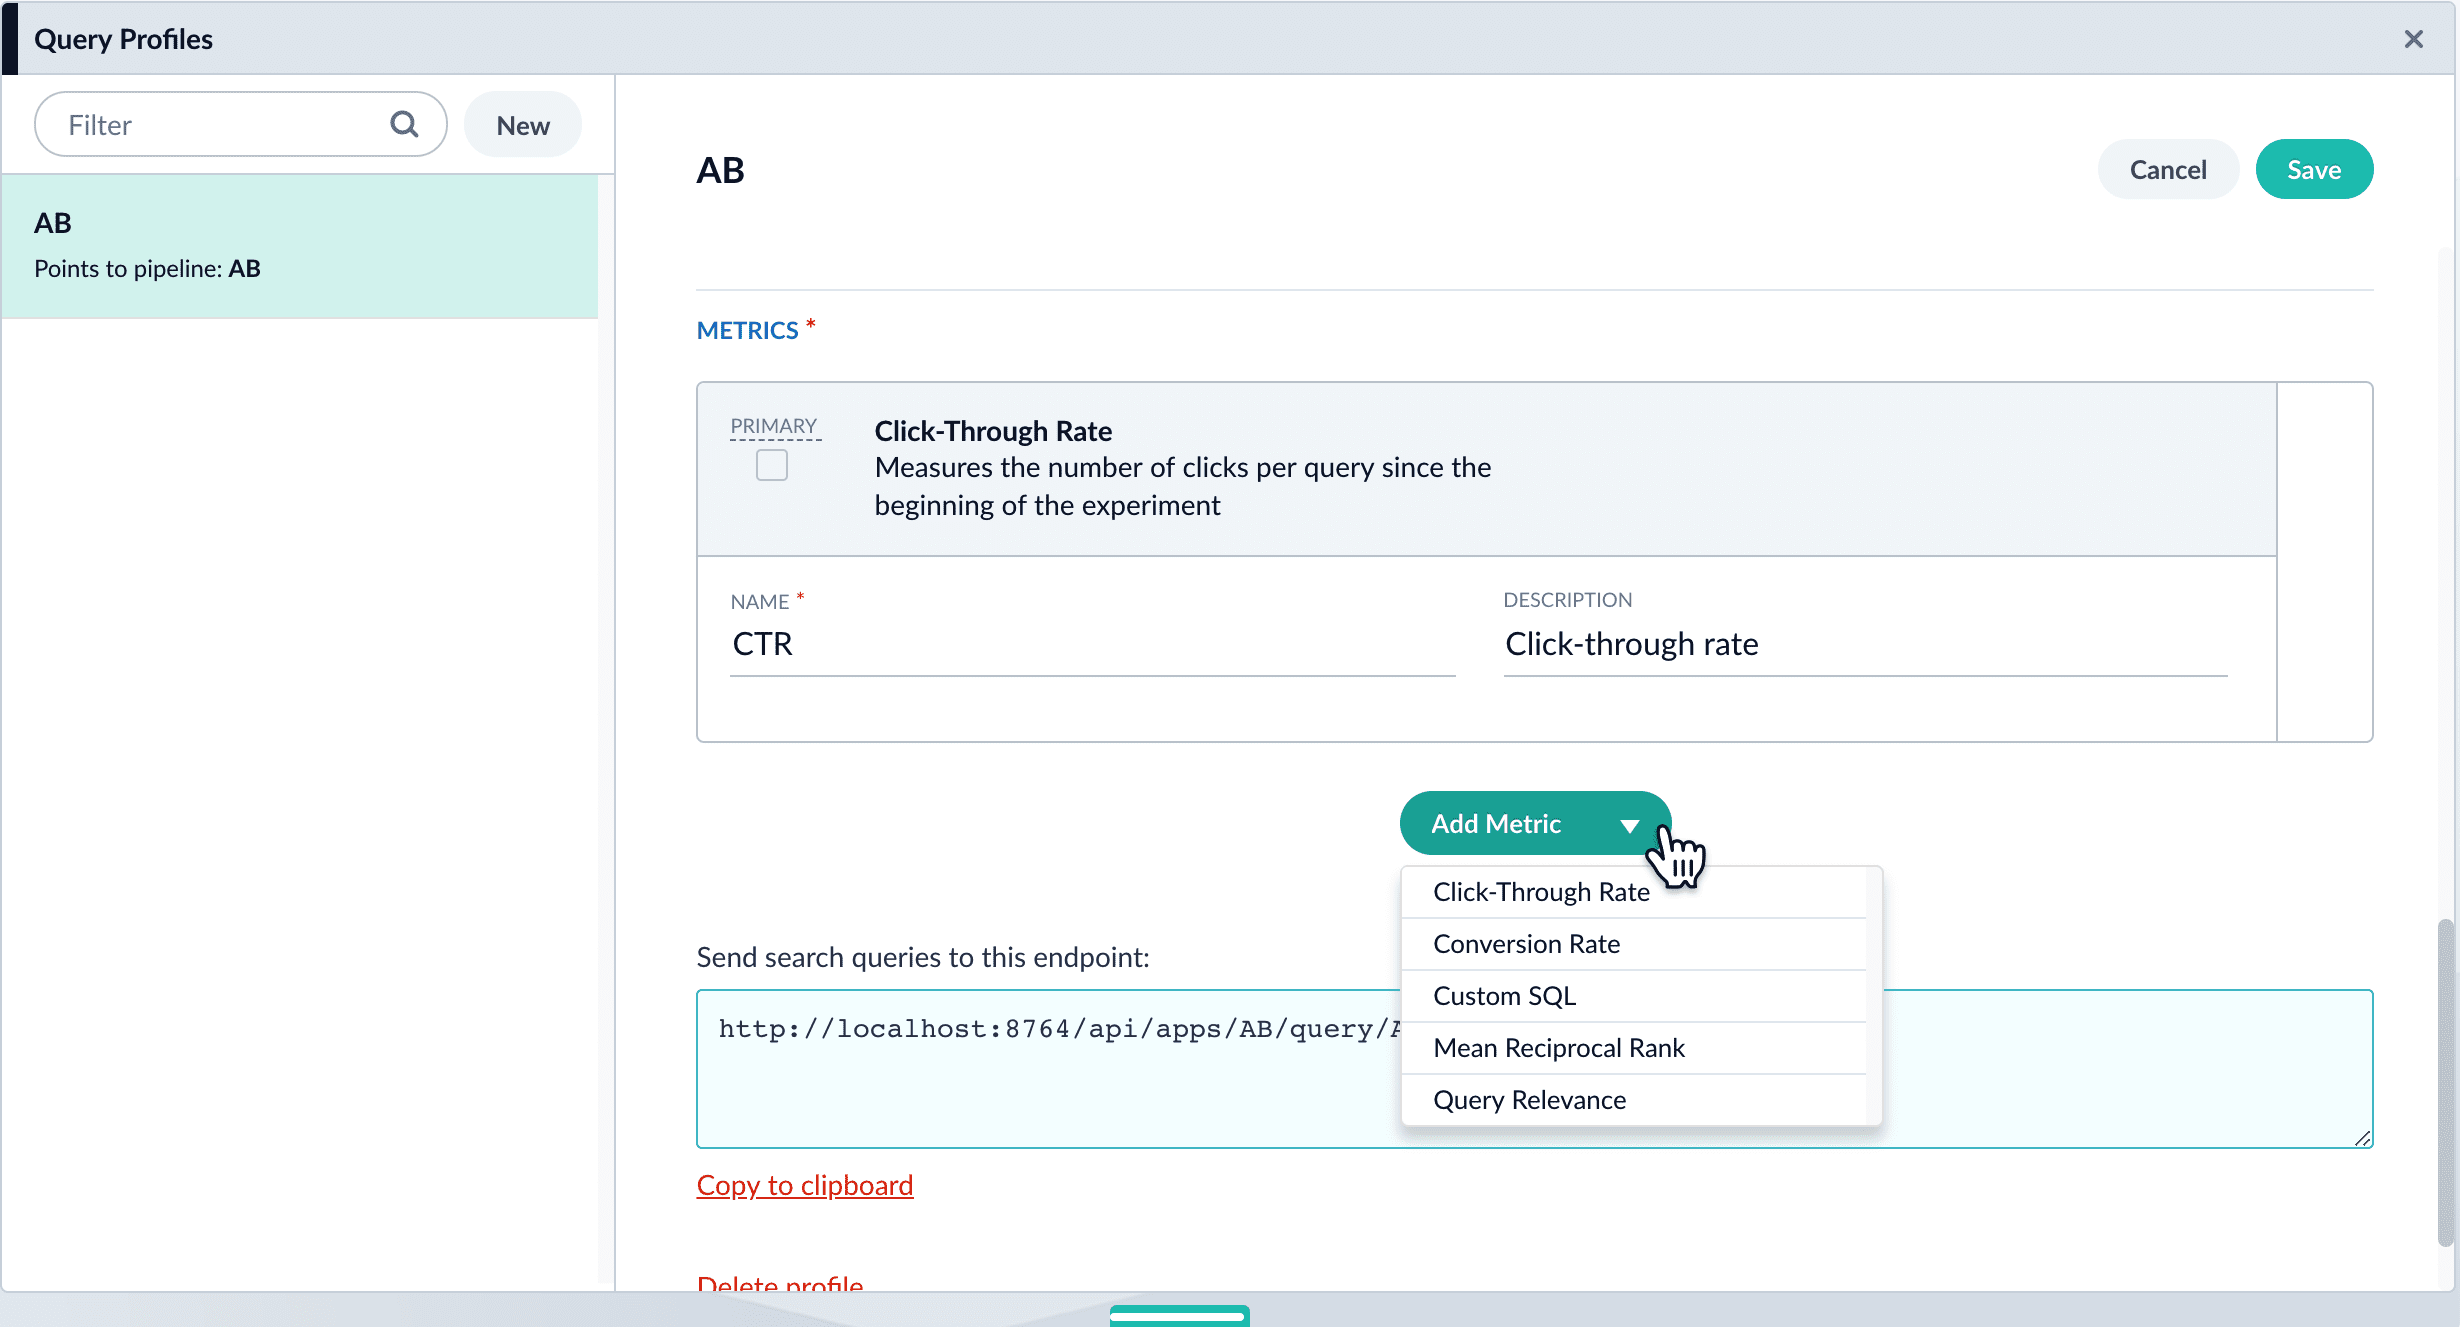
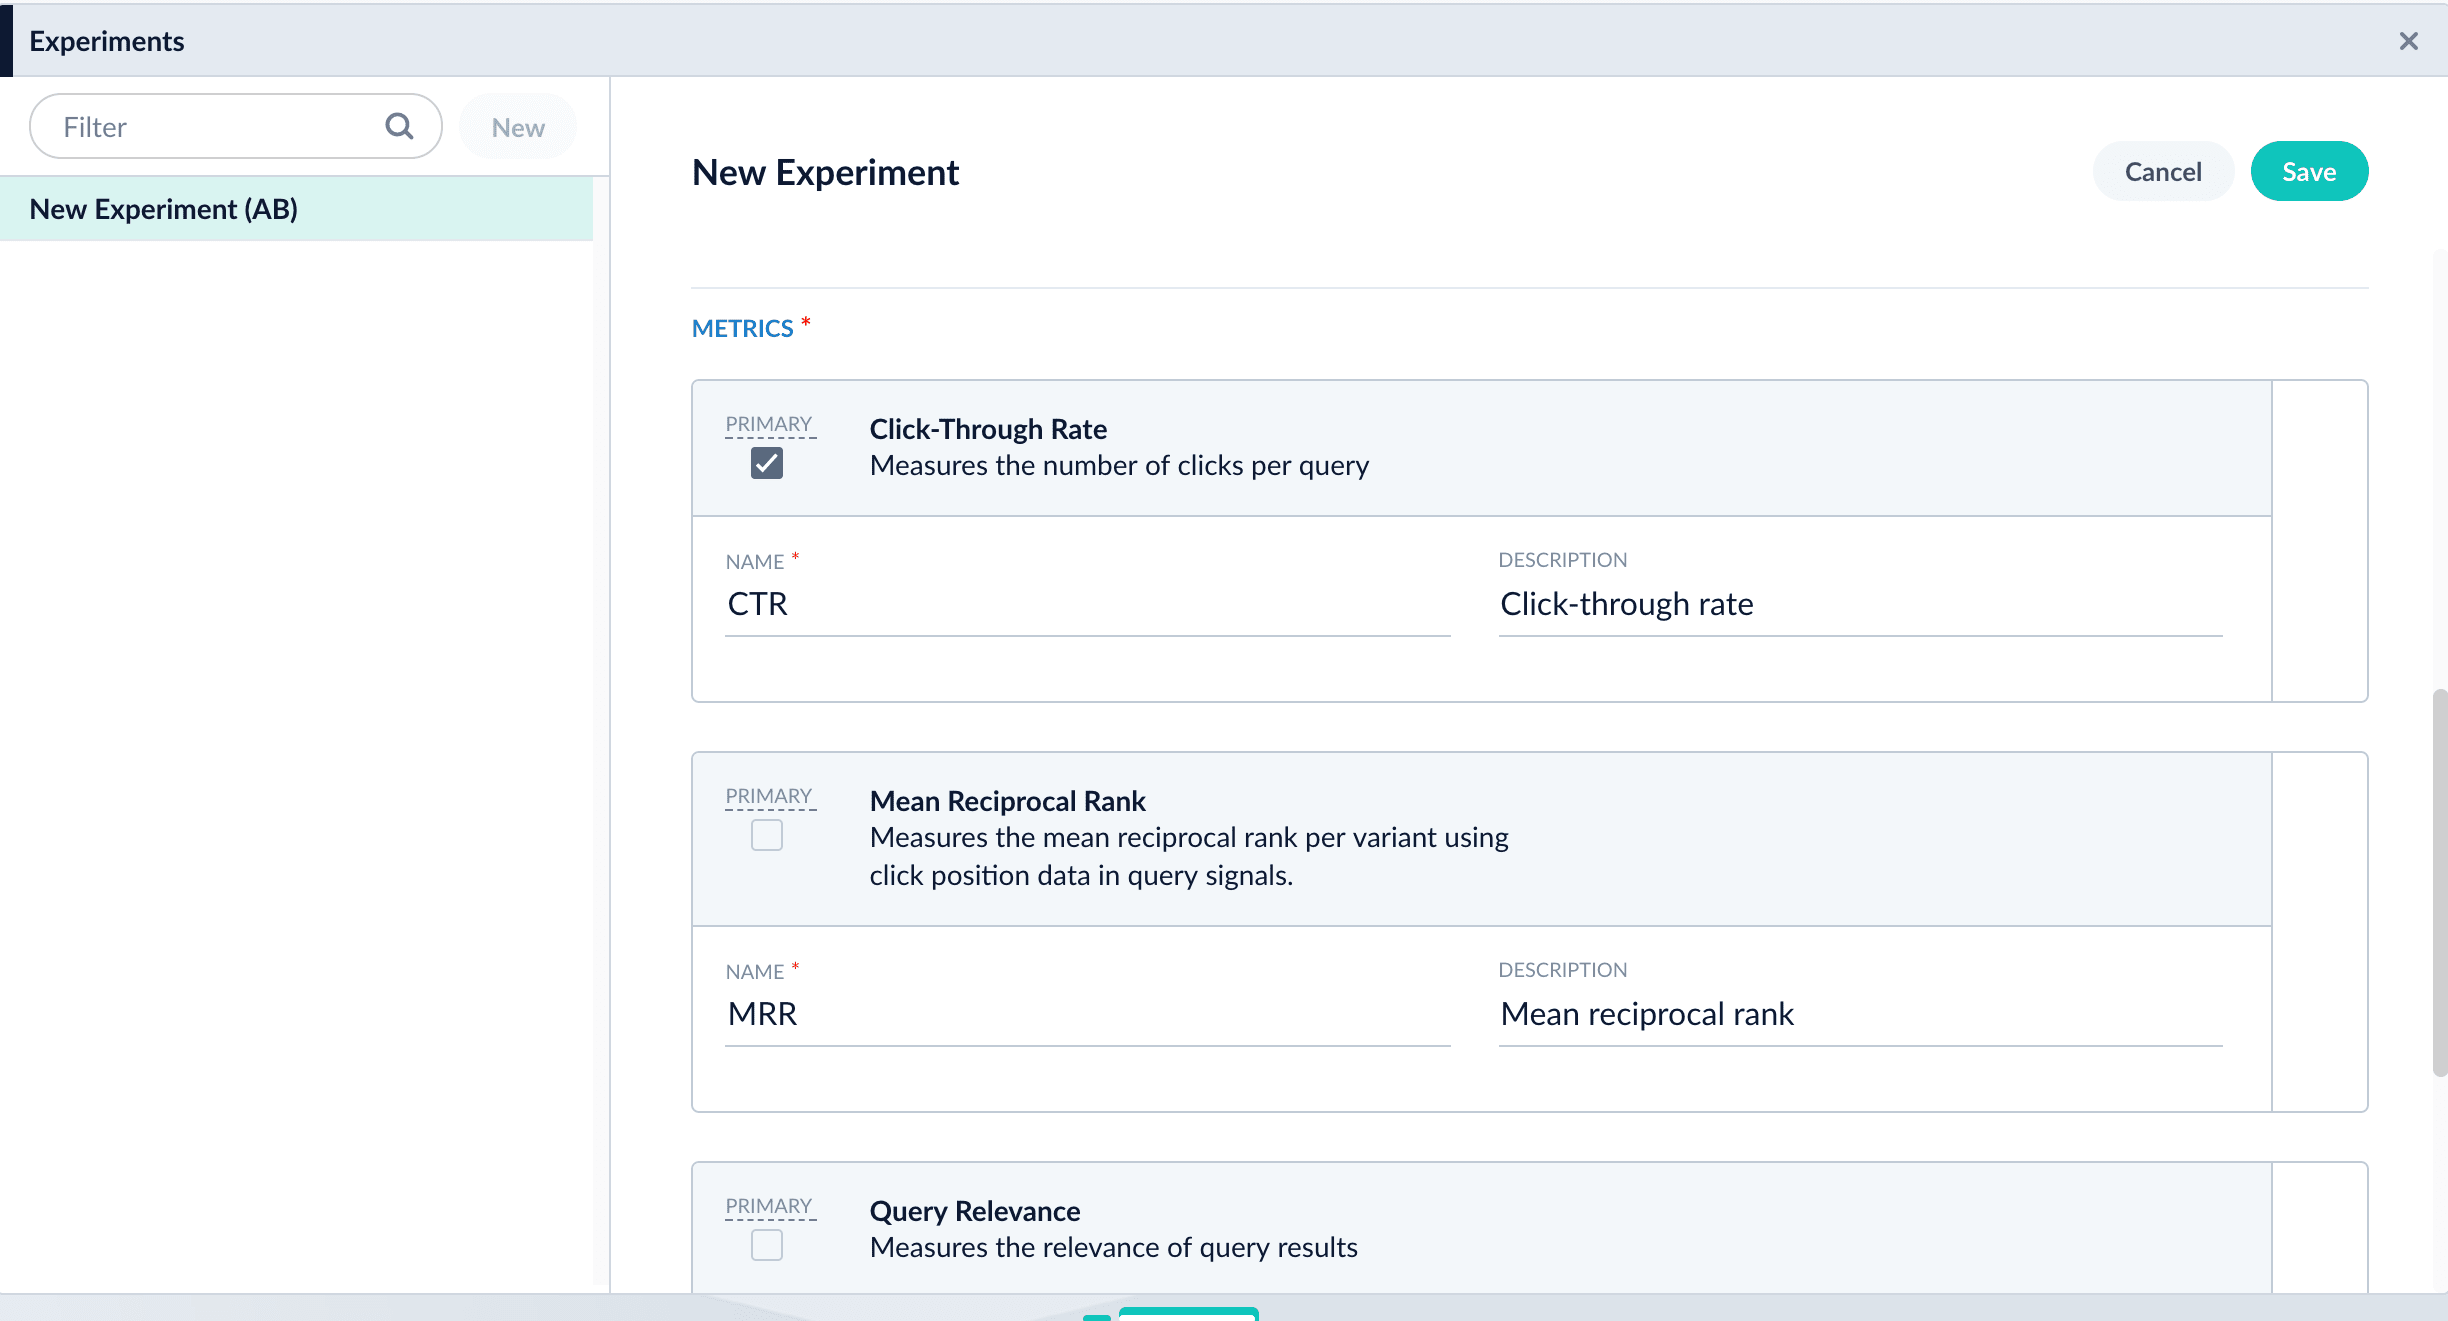
3. Add metrics. For each metric:
4. Click **Add Metric** and select the type of metric.
5. Fill in information for the metric.
6. Click **Save** to save the experiment.
### Option B: Create the experiment in the Experiments UI
You can create the experiment first and reference it from a query profile.
{/* // tag::create-experiment[] */}
1. **Create an experiment.** The experiment defines variants and metrics, as well as the user ID parameter and the base collection for signals:
2. Navigate to Analytics > **Experiments**.
3. Click **New**.
4. Enter an arbitrary **ID** (name) for the experiment.
5. Verify that the **unique ID parameter** is correct. It is the parameter that uniquely identifies each user. The default is `userId`. Correct the parameter if necessary, for example by specifying the session ID field instead.
6. Choose the base collection for signals. Signals resulting from requests that flow through the experiment are stored in the `_signals` collection associated with this collection.
7. (Optional) Enter a description for the experiment.
8. (Optional) To use a multi-armed bandit, select **Automatically Adjust Weights Between Variants**.
9. Add variants. Click **Add Variant** to add each non-control variant in your experiment.
10. For each variant:
11. Enter an arbitrary name. For the first variant, which is the control, Fusion uses the name `control`. You can change that name if you wish.
12. Click **Specify what varies** and specify what varies. Items you select are visible in the variant UI and have a green check mark in the dropdown menu. You can vary the query pipeline, query parameters (URL parameters to add to the query), and/or the collection.
13. (*For query parameters*) Click **New params**. In the dialog box, specify the **Parameter Name**, **Parameter Value**, and **Update Policy** for each parameter (append, default, remove, or replace).
14. Add metrics. For each metric:
15. Click **Add Metric** and select the type of metric.
16. Fill in information for the metric.
17. Click **Save** to save the experiment.
18. **Reference the experiment from the query profile.** Open the query profile you want to use for the experiment.
1. Navigate to Querying > **Query Profiles**.
2. Click the query profile you want to use for the experiment.
3. (Optional) If necessary, modify the query profile ID, default pipeline, and/or the search handler. These modifications are not related to experiments and are probably not required.
4. (Optional) Click **New params** and specify URL parameters to add to all queries for this query profile.
5. Click the checkbox in front of **Enable experimentation**.
6. Specify the percent of traffic to include in the experiment.
7. Click the , and then click the experiment name.
8\. Click **Save** to save the query profile.
## Next step
You have set up the experiment. Alternatively, you will set it up using an Experiment stage. If you chose to use this article for setting up your experiment, you can skip the next article.
Now that you have set up an experiment, you can run it. While an experiment is running:
* Lucidworks Search receives queries from the search app.
* For the queries that identify a user, Lucidworks Search routes the specified percentage of traffic through the experiment. Lucidworks Search apportions the queries from different users among the variants in accordance with traffic weights.
* Lucidworks Search records what users do after receiving search results, for example, what links they click.
We recommend that you only run one experiment at a time.
Running an experiment involves three steps:
1. **Activate the experiment.** Activating an experiment turns on the logic that sends queries through the experiment.
2. **Users submit queries and interact with results.** Queries and signals about interactions with results come from a search app. In this topic, we explain how to verify that data is flowing through the experiment correctly.
3. **Deactivate the experiment.** When enough data have been collected for metrics to be significant, you can deactivate the experiment. To run the experiment again, just activate it again. With each activation, you get new metrics.
Metrics will calculate periodically while an experiment is running. You can also generate metrics for a running experiment manually. Just run the metrics job(s) for the metrics you want to generate.
## Activate an experiment
You can activate an experiment in either of these ways. The outcome is identical.
**From the experiment**
1. With the app open, navigate to Analytics > **Experiments**.
2. In the left pane, click the experiment you want to activate. In the upper right, click **Activate**.
**From the query profile**
1. With the app open, navigate to Querying > **Experiments**. In the left pane, click the experiment you want to activate. In the upper right, click **Activate Experiment**.
If you stop Lucidworks Search while an experiment is running, then Lucidworks Search restarts the experiment automatically the next time you start Lucidworks Search.
## Verify that data is coming into the experiment
Signals resulting from requests that flow through the experiment are stored in the `_signals` collection associated with the primary collection.
You can use the Query Workbench or App Insights (if available) to examine this collection to verify that requests are being distributed among your experiment’s query pipelines.
Do not modify a running experiment. If you need to make a change, stop the experiment, make the modifications, and then start a new experiment that uses the modified object.
## Deactivate an experiment
You can deactivate an experiment in either of these ways. The outcome is identical.
**From the experiment**
1. With the app open, navigate to Analytics > **Experiments**.
2. In the left pane, click the experiment you want to deactivate. In the upper right, click **Deactivate**.
**From the query profile**
1. With the app open, navigate to Querying > **Experiments**. In the left pane, click the experiment you want to deactivate. In the upper right, click **Deactivate Experiment**.
## Next step
You have run the experiment. Next, you will analyze the experimental results.
After you have run an experiment in Lucidworks Search, you can analyze the results. When you stop an experiment, Lucidworks Search runs jobs that calculate metrics for the data collected. Jobs associated with an experiment are prefixed with the name of the experiment in the following format:
```
-
```
There are two jobs for the Query Relevance metric:
* `-groundTruth-`
* `-rankingMetrics-`
If you run metrics jobs manually, Lucidworks Search generates experiment metrics while the experiment is running.
## Default schedules for metrics jobs
When you activate an experiment, Lucidworks Search schedules metrics jobs for the experiment.
### Ground truth metric job
Ground truth is used for the Query Relevance metric.
* **First run.** Must be run manually and cannot be scheduled.
* **Subsequent runs.** By default, the experiment runs every month until the experiment is stopped. You can specify a different schedule.
### Other metrics jobs
The run schedules for all other metrics jobs are:
* **First run.** Occurs 20 minutes after the experiment starts.
* **Subsequent runs.** By default, the experiment runs every 24 hours until the experiment is stopped. You can specify a different schedule.
* **Last run.** Occurs immediately after the experiment is stopped
## Modify metrics jobs schedules
To modify the default schedule for metrics jobs, complete the following:
1. Sign in to Lucidworks Search and click your application.
2. Click **Analytics Hub > Experiments**.
3. In the metric to edit, click **Processing Schedule**. This link is active even if the experiment is running.
4. Edit the schedule as desired.
5. Click **Save**.
Periodic runs of metrics jobs are intended to give you up-to-date metrics. The metrics are always calculated from the beginning of the experiment.
Even with periodically updated metrics, Lucidworks recommends you let an experiment run its course before drawing conclusions and taking action.
{/* // Q: How do we know when an experiment has run its course? */}
{/* // A: This has two parts: */}
{/* // 1: Check to see if the experiment is still running, and stop it when you planned to. */}
{/* // 2: For the next step (metrics), you check to see whether metrics jobs are running. */}
## Check the last run time for metrics jobs
When you view experiment metrics and statistics, that information reflects the experiment’s state the last time the metrics jobs ran. When you stop an experiment, it is especially important that you verify that the end-of-experiment metrics jobs have run.
To check the last run time:
1. Sign in to Lucidworks Search and click your application.
2. Click **Collections > Jobs**.
3. In the **Filter** field, enter the experiment name. The **Last run** value displays for the experiment.
## App Insights metrics
Analytics produced by metrics jobs are described in [App Insights](/docs/lucidworks-search/06-metrics-and-analytics/app-insights/overview).
## Statistical significance
[Statistical significance](https://en.wikipedia.org/wiki/Statistical_significance) calculations inform you whether differences among experiment variants are likely to result from random chance, as opposed to real causal effects.
Lucidworks Search provides two measures of statistical significance:
* **Confidence index.** The [confidence index](#confidence-index) expresses the confidence that the experiment results are statistically significant. It takes into account the current sample size of the experiment, the required sample size to accurately establish statistical significance, and the calculated p-value.
* **Percent chance of beating.** The [percent chance of beating](#percent-chance-of-beating) uses a [Bayesian](https://en.wikipedia.org/wiki/Bayesian_statistics) algorithm to calculate the percent chance that another variant performs better than the control.
### Confidence index
The confidence index expresses the confidence that the experiment results are statistically significant. It gives you a gauge for whether the differences between variants are due to a causal effect as opposed to random chance.
The confidence index combines two concepts: the minimum sample size, and the p-value.
* If the number of samples is lower than the minimum sample size, then the confidence index is based entirely on the percentage of sample size.
* If the number of samples is above the minimum sample size, then the confidence index directly related to the p-value generated using Welch’s t-test [Welch’s t-test](https://en.wikipedia.org/wiki/Welch%27s_t-test), which is a variation of the [Student’s t-test](https://en.wikipedia.org/wiki/Student%27s_t-test). Welch’s t-test is better than the Student’s t-test when samples have unequal variances and/or sample sizes.
The test is a pairwise test, with each comparison being two-tailed (there is no *a priori* assumption that the difference will be in a specific direction). Lucidworks Search compares each variant against the first variant (the control), and generates a p-value for the comparison. The **confidence index** score is based on the *lowest* p-value amongst the variants.
The confidence index is this, rounded to the nearest whole number:
```
CI = 100 * (1-p)
```
You can recover two digits of the p-value from the confidence index as follows:
```
p = 1 - CI/100
```
### Percent chance of beating
The percent chance of beating uses a [Bayesian](https://en.wikipedia.org/wiki/Bayesian_statistics) algorithm to calculate the percent chance that another variant than the control does better than the control.
When calculating the percent chance of beating, Lucidworks Search uses up to 30 days of historical signal data to establish a baseline to compare against. The baseline is useful but not required. If the historical data is available, an experiment can reach higher confidence numbers more quickly.
Lucidworks Search calculates historical metrics one time and stores them, so subsequent runs of the metrics calculation jobs will not need to recalculate them.
Percent chance of beating is only accessible through the Lucidworks Search API, not through App Insights. Use the metrics endpoint `https://EXAMPLE_COMPANY.b.lucidworks.cloud:/api/experiments/_experiment-name_/metrics`, where the API port is `6764`.
### Best practices
Note the following best practices regarding statistical significance:
* **If you peek, do not act.** P-values only reach significant levels when there is enough data. This leads to the problem of *peeking* (when people look at experiment results too early and make incorrect decisions). Wait until an experiment is over before making decisions based on the experiment. The confidence index is intended to encourage this practice.
* **Do not modify running experiments.** To modify an experiment, you have to stop it, and data collection for the experiment stops. This is nice and clean and as it should be. You could, however, modify some object that the experiment uses (for example, you could modify a query pipeline) *while the experiment is running*. But this makes it unclear what you have been testing. We recommend against this practice. Instead, stop the first experiment, make the modifications, and then activate (start) an experiment that uses the modified object.
The course for **Experiments** focuses on understanding and running experiments in Fusion.
## Run an Experiment Tutorial
The **Run an Experiment** tutorial takes you through the steps needed to run an A/B experiment to compare metrics such as click-through rate (CTR) and query relevance for two differently configured query pipelines. You plan the experiment, create a Lucidworks Search app, index a datasource, and create a query profile that includes the configuration data needed for experiments. In Lucidworks Search, you start and stop the experiment. A search app uses the query profile for Lucidworks Search queries. Different users get different search results, but they are blissfully unaware that an experiment is going on.
Now that you have set up an experiment, you can run it. While an experiment is running:
* Lucidworks Search receives queries from the search app.
* For the queries that identify a user, Lucidworks Search routes the specified percentage of traffic through the experiment. Lucidworks Search apportions the queries from different users among the variants in accordance with traffic weights.
* Lucidworks Search records what users do after receiving search results, for example, what links they click.
We recommend that you only run one experiment at a time.
Running an experiment involves three steps:
1. **Activate the experiment.** Activating an experiment turns on the logic that sends queries through the experiment.
2. **Users submit queries and interact with results.** Queries and signals about interactions with results come from a search app. In this topic, we explain how to verify that data is flowing through the experiment correctly.
3. **Deactivate the experiment.** When enough data have been collected for metrics to be significant, you can deactivate the experiment. To run the experiment again, just activate it again. With each activation, you get new metrics.
Metrics will calculate periodically while an experiment is running. You can also generate metrics for a running experiment manually. Just run the metrics job(s) for the metrics you want to generate.
## Activate an experiment
You can activate an experiment in either of these ways. The outcome is identical.
**From the experiment**
1. With the app open, navigate to Analytics > **Experiments**.
2. In the left pane, click the experiment you want to activate. In the upper right, click **Activate**.
**From the query profile**
1. With the app open, navigate to Querying > **Experiments**. In the left pane, click the experiment you want to activate. In the upper right, click **Activate Experiment**.
If you stop Lucidworks Search while an experiment is running, then Lucidworks Search restarts the experiment automatically the next time you start Lucidworks Search.
## Verify that data is coming into the experiment
Signals resulting from requests that flow through the experiment are stored in the `_signals` collection associated with the primary collection.
You can use the Query Workbench or App Insights (if available) to examine this collection to verify that requests are being distributed among your experiment’s query pipelines.
Do not modify a running experiment. If you need to make a change, stop the experiment, make the modifications, and then start a new experiment that uses the modified object.
## Deactivate an experiment
You can deactivate an experiment in either of these ways. The outcome is identical.
**From the experiment**
1. With the app open, navigate to Analytics > **Experiments**.
2. In the left pane, click the experiment you want to deactivate. In the upper right, click **Deactivate**.
**From the query profile**
1. With the app open, navigate to Querying > **Experiments**. In the left pane, click the experiment you want to deactivate. In the upper right, click **Deactivate Experiment**.
## Next step
You have run the experiment. Next, you will analyze the experimental results.
## A/B/n experiments
Lucidworks Search’s experiments feature set implements [A/B/n experiments](https://en.wikipedia.org/wiki/A/B_testing), also called A/B experiments or A/B tests, where A and B are *experiment groups* with one or more *variants*.
Lucidworks Search’s implementation of an A/B experiment uses consistent hashing on a unique ID field (typically `userId`), concatenated with the experiment’s name, to assign each request to one of the experiment groups. Any future requests with that hash are assigned to the same group, guaranteeing user "stickiness".
If you prefer "stickiness" only at the session level, you can send a session ID instead of a user ID.
If you send no ID at all, the request is not assigned to a variant since there is no way to consistently assign it to the same one. In that case, the request uses the "default" configuration of the query profile or experiment stage.
## Example
The following experiment is an example of an A/B/n experiment with three variants:
* **Variant 1 (control).** Use the default query pipeline with no modifications. Each experiment should have a "control" variant as the first variant; the other variants will be compared against this one.
* **Variant 2 (content-based filtering with a Solr MoreLikeThis stage).** Content-based filtering uses data about a user’s search results, browsing history, and/or purchase history to determine which content to serve to the user. The filtering is non-collaborative.
* **Variant 3 (collaborative filtering with a Recommend Items for User stage).** Collaborative filtering takes advantage of knowledge about the behavior of many individuals. It makes serendipitous discovery possible—a user is presented with items that other users deem relevant, for example, socks when buying shoes.
## High-level workflow
In an experiment:
1. A Lucidworks Search administrator defines the experiment. An experiment has *variants* with differences in query pipelines, query pipeline stages, collections, and/or query parameters.
2. The Lucidworks Search administrator assigns the experiment to a query profile.
3. A user searches using that query profile.
4. If the experiment is running, Lucidworks Search assigns the user to one of the experiment variants, in accordance with **Plan an experiment**. Assignment to a variant is persistent. The next time the user searches, Lucidworks Search assigns the same variant.
5. Different experiment variants return different search results to users.
6. Users interact with the search results, for example, viewing them, possibly clicking on specific results, possibly buying things, and so forth.
7. Based on the interactions, the search app backend sends signals to the signals endpoint of the query profile for the experiment.
8. Using signal data, an automatically-created Spark job periodically computes metrics for each experiment variant and writes the metrics to the `job_reports` collection.
9. In the Lucidworks Search UI, an administrator can view reports about the experiment.
10. Once the results of the experiment are conclusive, the Lucidworks Search administrator can stop the experiment and change the query profile to use the winning variant, or start a new experiment.
From a planning standpoint, an experiment has these parts:
* **A baseline control.** One of the experiment variants will be the control. This is "how we are doing things today." If you are experimenting from the start, choose the simplest variant as the control.
* **Experiment variants.** Experiment variants other than the control are attempts to improve the user’s extended search experience. Which relevancy strategy works best for your search app and your users?
* **Metrics.** This is how you know whether the search variants produce differences in user interactions, and whether the differences are statistically significant.
In the remainder of this topic, you will make decisions about these broad areas, as well as about experiment details.
## Plan what you want to vary
Identify different relevancy strategies, where each represents a hypothesis about which user experience will drive more click-throughs, purchases, and so on. Use the [Query Workbench](/docs/lucidworks-search/03-ui-tour/query-workbench) to explore how to produce different search results and recommendations using different query pipelines, and evaluate which ones might engage your users most effectively.
## Plan what you want to measure
Metrics compare the control against other variants pairwise. For example, if the variants are `experiment`, `B`, `C`, and `D`, and you choose `experiment` as the control, then the comparisons for which metrics are generated will be `experiment/B`, `experiment/C`, and `experiment/D`.
For more information, see [experiment metrics](/docs/lucidworks-search/06-metrics-and-analytics/experiment-metrics).
## Design the experiment
When designing an experiment, you must make these decisions:
* How users are identified
* Percentage of total traffic to send through the experiment
* Number of variants and how they differ
* Metrics to generate
In many cases identifying users is straightforward, using an existing user ID or session ID if the application has one. In other cases, you may need to generate an identifier of some sort to send in on queries. It is important to send in some kind of identifier with each query so that the experiment can route the query to a variant, and to send that same identifier with any subsequent signals that resulted from that query. Queries without a user ID will not be routed through the experiment.
The percentage of total traffic to send through the experiment is the one variable that can change over the course of the experiment. It is often a good practice to start out sending only a small percentage of search traffic through a new experiment, in order to verify that each of the variants are functioning properly. Then, once you have established that the behavior is as intended, you can increase the percentage of traffic through the experiment to the desired level.
With modest usage and for a possibly small effect, or when testing multiple variants at the same time, you might want to send 100% of users through the experiment and let it run longer. For high usage and an effect that is expected to be larger, and with only two variants, you might not need to send all users through the experiment and the experiment will not take as long.
## Choose traffic weights
Lucidworks Search uses *traffic weights* to apportion search traffic among the variants. This allows you to send a different percentage of traffic through each variant if desired.
### Automatic traffic weights (multi-armed bandit)
The **Automatically Adjust Weights Between Variants** configuration option enables multi-armed bandits and eliminates the need to specify a traffic weight for each variant.
You must schedule metrics jobs manually. Lucidworks recommends you schedule metrics jobs to run on an hourly basis. The weights between variants only change after the metrics jobs run.
Lucidworks Search’s multi-arm bandit implementation uses a variation of [Thompson Sampling](https://en.wikipedia.org/wiki/Thompson_sampling) (sometimes called Bayesian Bandits). This algorithm uses the current count of successes versus failures to build a beta distribution that represents the level of confidence in the primary metric value for each variant. It then samples a random number from each variant’s distribution, and picks the highest number.
This type of implementation has three effects:
* It weights better-performing variants higher.
Since the beta distribution of each variant is centered around the primary metric value for that variant, a random number selected from a higher-performing variant is likely to be higher than a random number picked from a lower-performing variant.
* Lower-performing variants remain in play
Picking a random number from each distribution preserves the chance that Fusion will try a lower-performing variant, as long as there is still a chance that it is better.
* The more confident the measurements, the narrower the beta distributions become.
The more uncertain the measurements, the wider the distributions will be, and thus the more likely that Lucidworks Search will choose variants that appear to be performing more poorly.
Since Lucidworks Search adjusts the weights between variants each time the metrics jobs run, users can still get different results on subsequent visits. For example, if variant A is getting 80% of traffic, but after recalculating metrics it is only getting 50% of traffic, then some users who were previously assigned to variant A will be assigned to variant B. However, only the bare minimum of users will be reassigned to a new variant. Most users will see no changes. Once the experiment has been running for some time, the changes between the variants should be fairly small, so relatively few users should be affected.
### Manually specifying traffic weights
The formula for variant A is:
{/* // This has the `subs=...` already, but I wanted to make sure this block showed up during a search for Eliza. Blend the two as required! */}
```
Proportion~A~ = (Traffic weight~A~)/(Sum of traffic weights for all variants)
```
For example:
| Variant traffic weights | Sum of traffic weights | Variant proportions |
| ----------------------- | ---------------------- | ------------------- |
| 1.0 1.0 | 2 | 0.5 0.5 |
| 1.0 1.0 2.0 | 4 | 0.25 0.25 0.5 |
| 0.5 1.0 1.0 2.5 | 5 | 0.1 0.2 0.2 0.5 |
## Calculate sample sizes
Lucidworks Search calculates the required sample size to detect a statistically significant result based on the results at runtime. The "confidence level" metric has this minimum sample size factored in, so that confidence is always low for experiments that have not yet reached their required sample size.
However, if you would like to use different power or significance level in evaluating your experiment (Lucidworks Search uses 0.08 and 0.05), or if you would like to establish your own sample size based on a desired minimum detectable effect, you may do so.
## Choose an implementation approach
You can construct an experiment in either of two ways:
* **Experiment and query profile.** (recommended) For most cases, you will want to create additional query pipelines that return different search results. A query profile directs traffic through the query pipelines in accordance with the traffic weights of experiment variants.
* **Experiment stage in a query pipeline.** If you want to use parts of a single query pipeline in all experiment variants, you can add an Experiment stage to that pipeline (the pipeline that receives search queries). The app can direct queries to the endpoint of a query profile that references the pipeline (recommended) or to the endpoint of the query pipeline. If used, the query profile *does not* reference an experiment.
## Next step
You have planned the experiment. Next, you will set it up using either a query profile or an Experiment stage. This guide includes both options.
## Information flow
This diagram illustrates information flow through an experiment. Numbers correspond to explanations below the diagram.
1. A user searches in a search app. For example, the user might search for `shirt`.
2. The search app backend appends a `userId` or other unique ID that identifies the user, for example, `userId=123`, to the query and sends the query to the query profile endpoint for the experiment.
3. Using information in the query profile and the value of the unique ID, Lucidworks Search routes the query through one of the experiment’s variants. In this example, Lucidworks Search routes the query through query pipeline 1.
4. A query pipeline adds a `x-fusion-query-id` to the response header, for example, `x-fusion-query-id=abc`.
5. Based on the query, Lucidworks Search obtains a search result from the index, which is stored in the primary collection. Lucidworks Search sends the search result back to the search app.
6. Lucidworks Search sends a response signal to the signals collection.
7. A different user might be routed through the other experiment variant shown here, and through query pipeline 2. This query pipeline has an enabled Boost with Signals stage, unlike query pipeline 1.
8. The search user interacts with the search results, viewing them, possibly clicking on specific results, possibly buying things, and so forth. For example, the user might click the document with `docId=757`.
9. Based on the interactions, the search app backend sends click signals to the signals endpoint for the query profile. Signals include the same query ID so Lucidworks Search can associate the signals with the experiment. Specifically, the click signal *must* include a field named `fusion_query_id` in the `params` object of the raw click signal whose value was returned in the response object in a header named `x-fusion-query-id`. If you are tracking queries and responses with App Studio, the `fusion_query_id` parameter will be passed with the click signal as long as you specify the appropriate response attribute in your `track:clicks` tag.
10. Using information in the query profile, Lucidworks Search routes the signals to the `_signals_ingest` pipeline.
11. The `_signals_ingest` pipeline stores signals in the `_signals` collection. Signals include the collection ID of the primary collection and experiment tracking information.
## Metrics generation
This diagram illustrates metrics generation:
1. A Lucidworks Search administrator can configure which metrics are relevant for a given experiment and the frequency with which experiment metrics are generated. They can also generate metrics on demand.
2. Using signal data, an automatically-created Spark job periodically runs in the background. It obtains signal data from the `COLLECTION_NAME_signals` collection, computes metrics for each experiment variant, and writes the metrics to the collection used for aggregated signals (`_signals_aggr`).
3. In the Lucidworks Search UI, an administrator can view experiment metrics.
4. These calculated metrics are used to display reports about the experiment.
## Learn more
When making changes to a query pipeline or query parameters that will affect users' search experience, it is often a good idea to run an experiment in order to verify that the results are what you intended. Lucidworks Search lets you create and run experiments that take care of dividing traffic between variants and calculating the results of each variant with respect to configurable objectives such as purchases, click-through rate or search relevance.
There are two ways that a search application might interact with an experiment:
* Preferred: Using a query profile
* Alternative: Using an Experiment query pipeline stage
This guide takes you through the process of planning, setting up, running, and analyzing an experiment.
Here we describe how to set up an experiment that uses an Experiment query pipeline stage. Using an Experiment query pipeline stage is a bit more complicated.
This approach is an alternative to setting up an experiment and a query profile that references it. If you have used the query profile method, you can skip this article.
## How an Experiment stage works
An Experiment stage applies the experiment actions in-line in the query pipeline (wherever it is located in the pipeline), instead of performing the actions before passing queries to a query pipeline or pipelines.
An Experiment stage that apportions traffic among query pipelines is similar to a Call Pipeline stage, but the processing is *conditional*. Queries that lack a user ID parameter are not sent processed by the stage and are not sent to other pipelines (if that is what the stage does).
For the primary pipeline to process queries that do not include a user identifier, it *must* contain a Solr Query stage as the last stage. If the Experiment query stage references other pipelines, then there are two options:
* **Solr Query stage as the last stage in the variant pipelines.** The variant pipelines send queries to Solr. Control does not return to the primary pipeline. In the primary pipeline, the Experiment stage must be the second-to-last stage. The last stage must be the Solr Query stage.
* **No Solr Query stage in the variant pipelines.** The variant pipelines do not send queries to Solr. Control returns from the variant pipelines to the primary pipeline. In the primary pipeline, the Experiment stage can be in any position except the last.
## Before you begin
Before you set up an experiment, you must already have:
* **A search app.** The key aspect of the search app for experiments is that the search app identifies users in some way. A user ID might be associated with users persistently (this is best) or only for the current session. Searches and subsequent actions by anonymous users are not sent through an experiment.
* **A Fusion app.** The Fusion app provides the search functionality you want to provide. Below, you will modify the app to include an experiment.
* **Data for users to search.** The app should have data that users can search and search results that users can interact with. Typically, users will search a single dataset in the sense that different users are not given search results from different datasets. But in an experiment, different experiment variants *can* use data in different collections.
* **Results for users to interact with.** Experiment metrics depend on users interacting with search results, for example, clicking on them. A search app uses signals to report the interactions to Fusion.
* **A plan for the experiment.** This plan includes which control and variants to compare, the projected traffic, sample sizes, experiment duration, metrics, and decision criteria.
Basically, you need a working system in some environment on which you want to perform experiments, and a plan for experiment variants and for deciding which results are best.
## Create an experiment
Create an experiment. The experiment defines variants and metrics, as well as the user ID parameter and the base collection for signals:
1. Navigate to **Analytics** > **Experiments**.
2. Click **New**.
3. Enter an arbitrary **ID** (name) for the experiment.
4. Verify that the **unique ID parameter** is correct. It is the parameter that uniquely identifies each user. The default is `userId`. Correct the parameter if necessary, for example by specifying the session ID field instead.
5. Choose the base collection for signals. Signals resulting from requests that flow through the experiment are stored in the `_signals` collection associated with this collection.
6. (Optional) Enter a description for the experiment.
7. (Optional) To use a multi-armed bandit, select **Automatically Adjust Weights Between Variants**.
8. Add variants. Click **Add Variant** to add each non-control variant in your experiment.
9. For each variant:
1. Enter an arbitrary name. For the first variant, which is the control, Lucidworks Search uses the name `control`. You can change that name if you wish.
2. Click **Specify what varies** and specify what varies. Items you select are visible in the variant UI and have a green check mark in the dropdown menu. You can vary the query pipeline, query parameters (URL parameters to add to the query), and/or the collection.
3. (*For query parameters*) Click **New params**. In the dialog box, specify the **Parameter Name**, **Parameter Value**, and **Update Policy** for each parameter (append, default, remove, or replace).
10. Add metrics. For each metric:
1. Click **Add Metric** and select the type of metric.
2. Fill in information for the metric.
11. Click **Save** to save the experiment.
## Set up an Experiment stage
If part or all of what you will vary in the experiment is encompassed by differences in query pipelines, create additional pipelines for experiment variants. You *cannot* use the default query pipeline (the pipeline to which you are adding the Experiment stage) as one of the variants. That pipeline will be a part of all variants. Lucidworks Search directs traffic that does not identify users through the default pipeline but not through the experiment.
**How to set up an experiment stage**
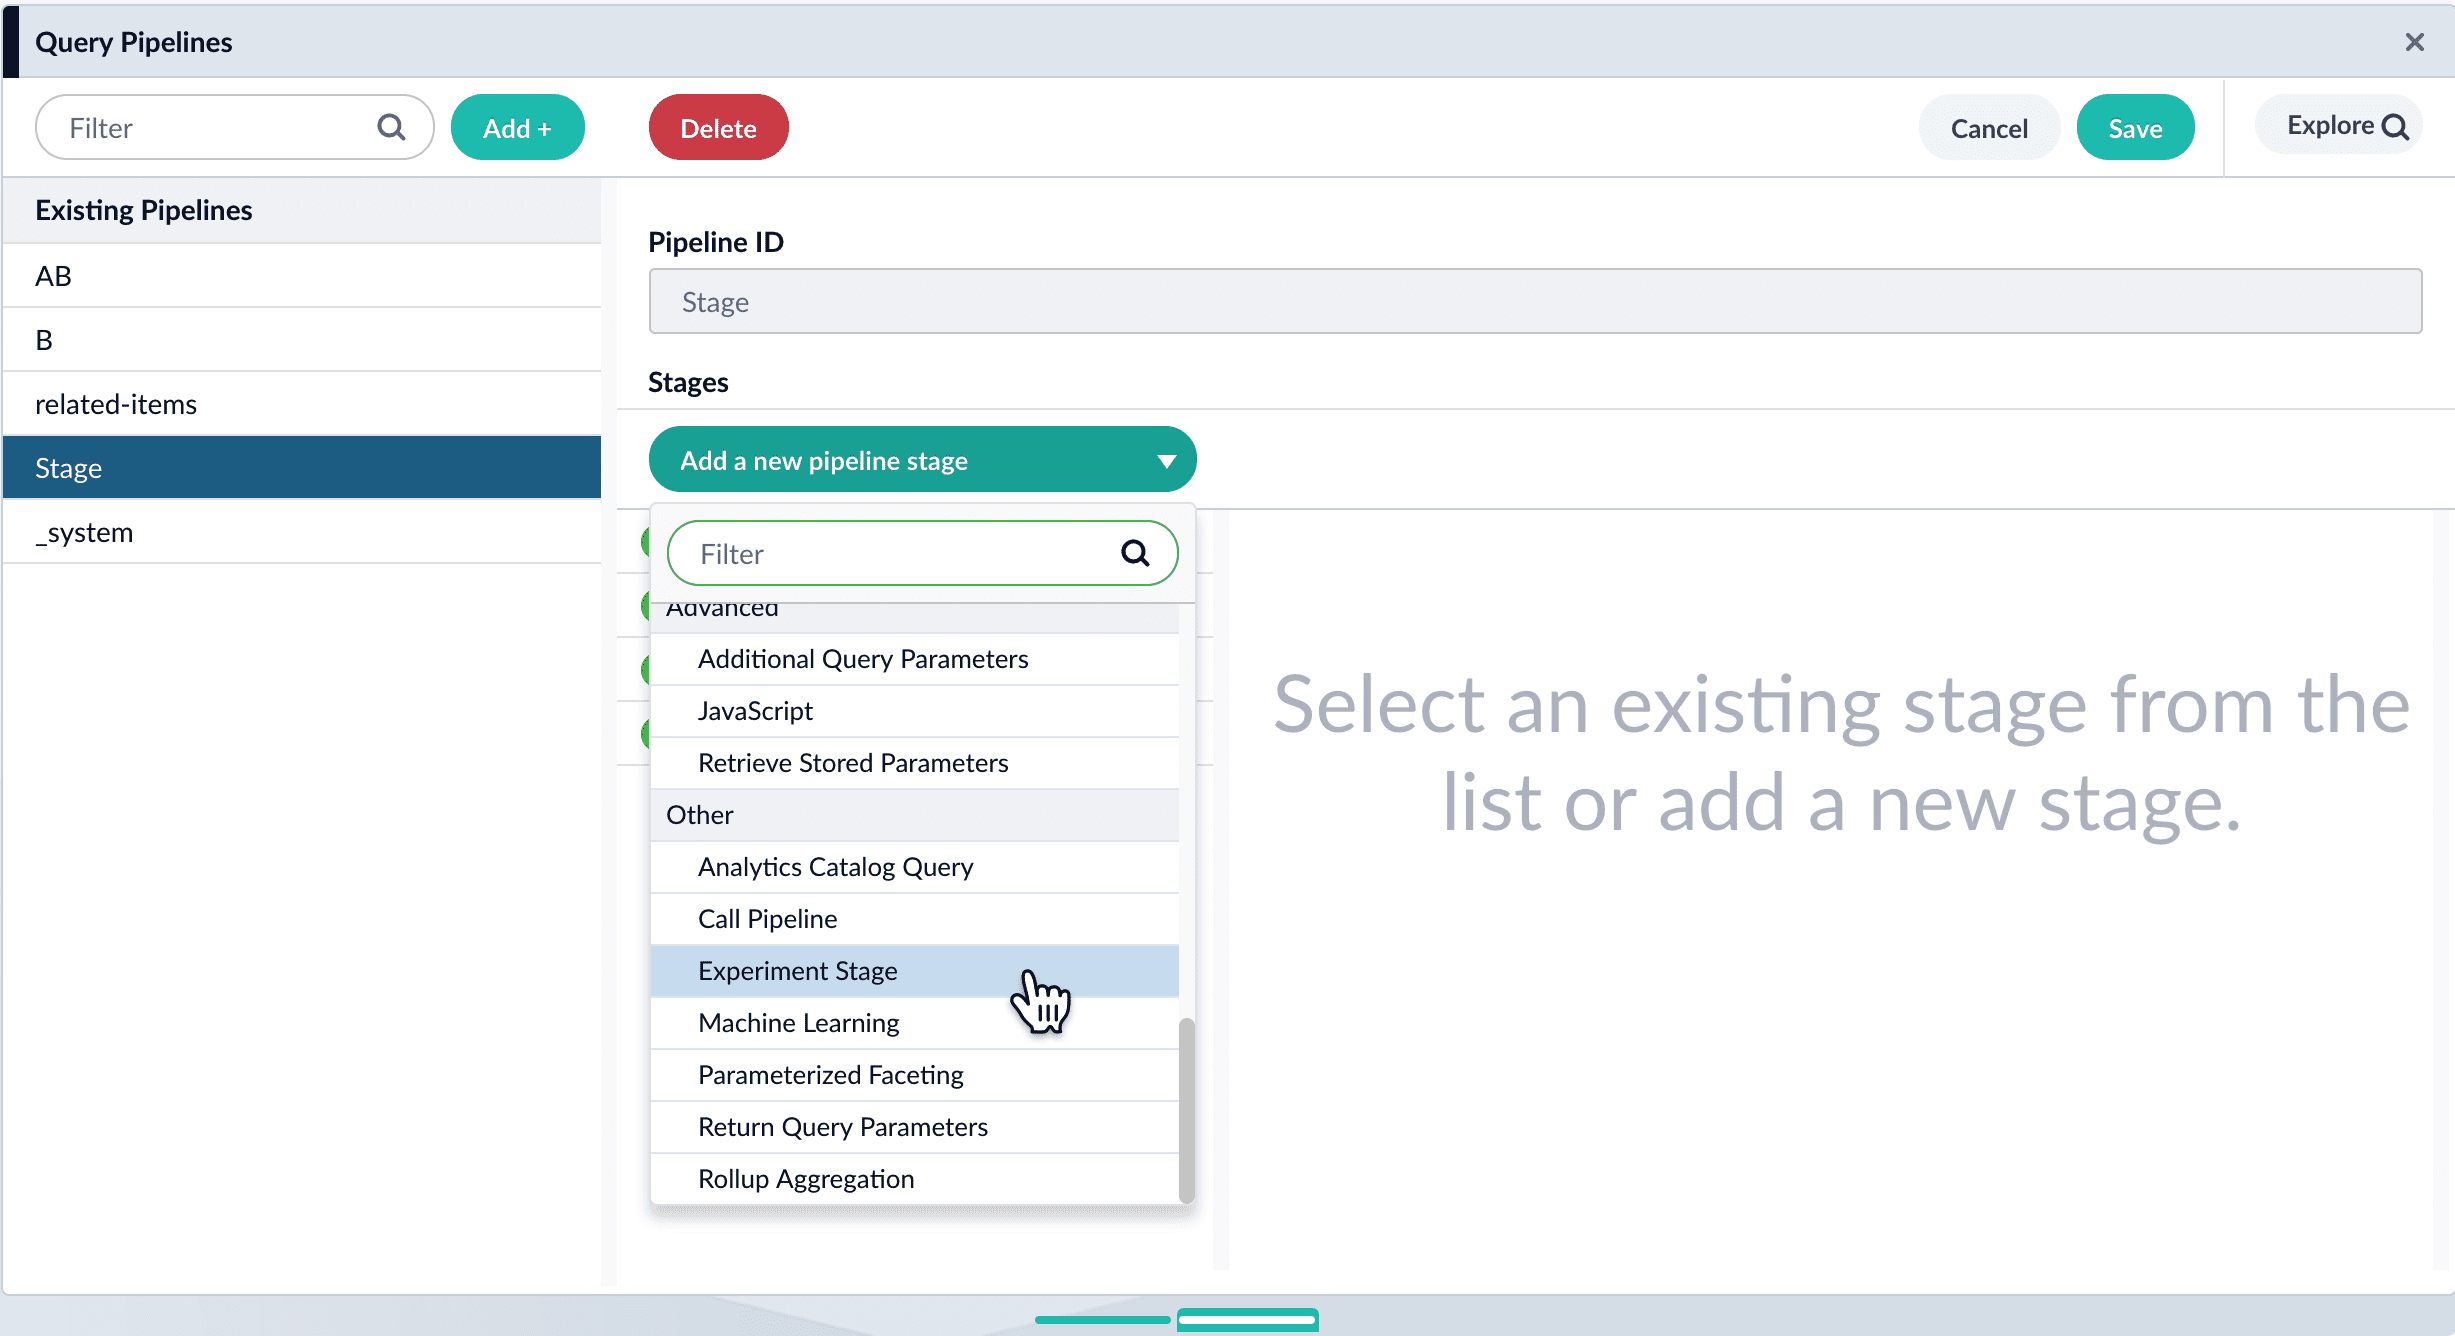
1. Navigate to Querying > **Query Pipelines**.
2. Click the name of the pipeline to which you want to add the Experiment stage.
3. Click **Add a new pipeline stage** and select **Experiment stage**.
4. (Optional) Specify a label for the stage.
5. (Optional) Specify a condition that must be satisfied for queries to pass through the experiment.
6. Under **Experiment ID**, choose the experiment.
7. (Optional) Specify the percent of traffic to include in the experiment.
8. Click **Save**.
9. Drag the stage to where you want it in the pipeline.
10. Click **Save**.
You control the experiment in **Analytics** > **Experiments**.
 4. Modify the pipeline as desired, for example, by adding, configuring, and reordering stages.
5. Click **Save**.
{/* // end::create-pipelines[] */}
## Create the query profile and the experiment
In the Fusion UI, you can use either of these equivalent approaches to set up an experiment:
* **[Create the experiment in the Query Profiles UI](#option-a-create-the-experiment-in-the-query-profiles-ui).** Choose an existing query profile or create a new one. Then create the experiment in the **Querying** > **Query Profiles** UI.
* **[Create the experiment in the Experiments UI](#option-b-create-the-experiment-in-the-experiments-ui).** Create an experiment in the **Analytics** > **Experiments** UI, and then reference the experiment in the **Querying** > **Query Profiles** UI.
### Option A: Create the experiment in the Query Profiles UI
1. **Choose or create a query profile.** Choose an existing query profile (for example, the default query profile) or create a new query profile for the experiment.
**How to choose an existing query profile:**
1. Navigate to Querying
4. Modify the pipeline as desired, for example, by adding, configuring, and reordering stages.
5. Click **Save**.
{/* // end::create-pipelines[] */}
## Create the query profile and the experiment
In the Fusion UI, you can use either of these equivalent approaches to set up an experiment:
* **[Create the experiment in the Query Profiles UI](#option-a-create-the-experiment-in-the-query-profiles-ui).** Choose an existing query profile or create a new one. Then create the experiment in the **Querying** > **Query Profiles** UI.
* **[Create the experiment in the Experiments UI](#option-b-create-the-experiment-in-the-experiments-ui).** Create an experiment in the **Analytics** > **Experiments** UI, and then reference the experiment in the **Querying** > **Query Profiles** UI.
### Option A: Create the experiment in the Query Profiles UI
1. **Choose or create a query profile.** Choose an existing query profile (for example, the default query profile) or create a new query profile for the experiment.
**How to choose an existing query profile:**
1. Navigate to Querying 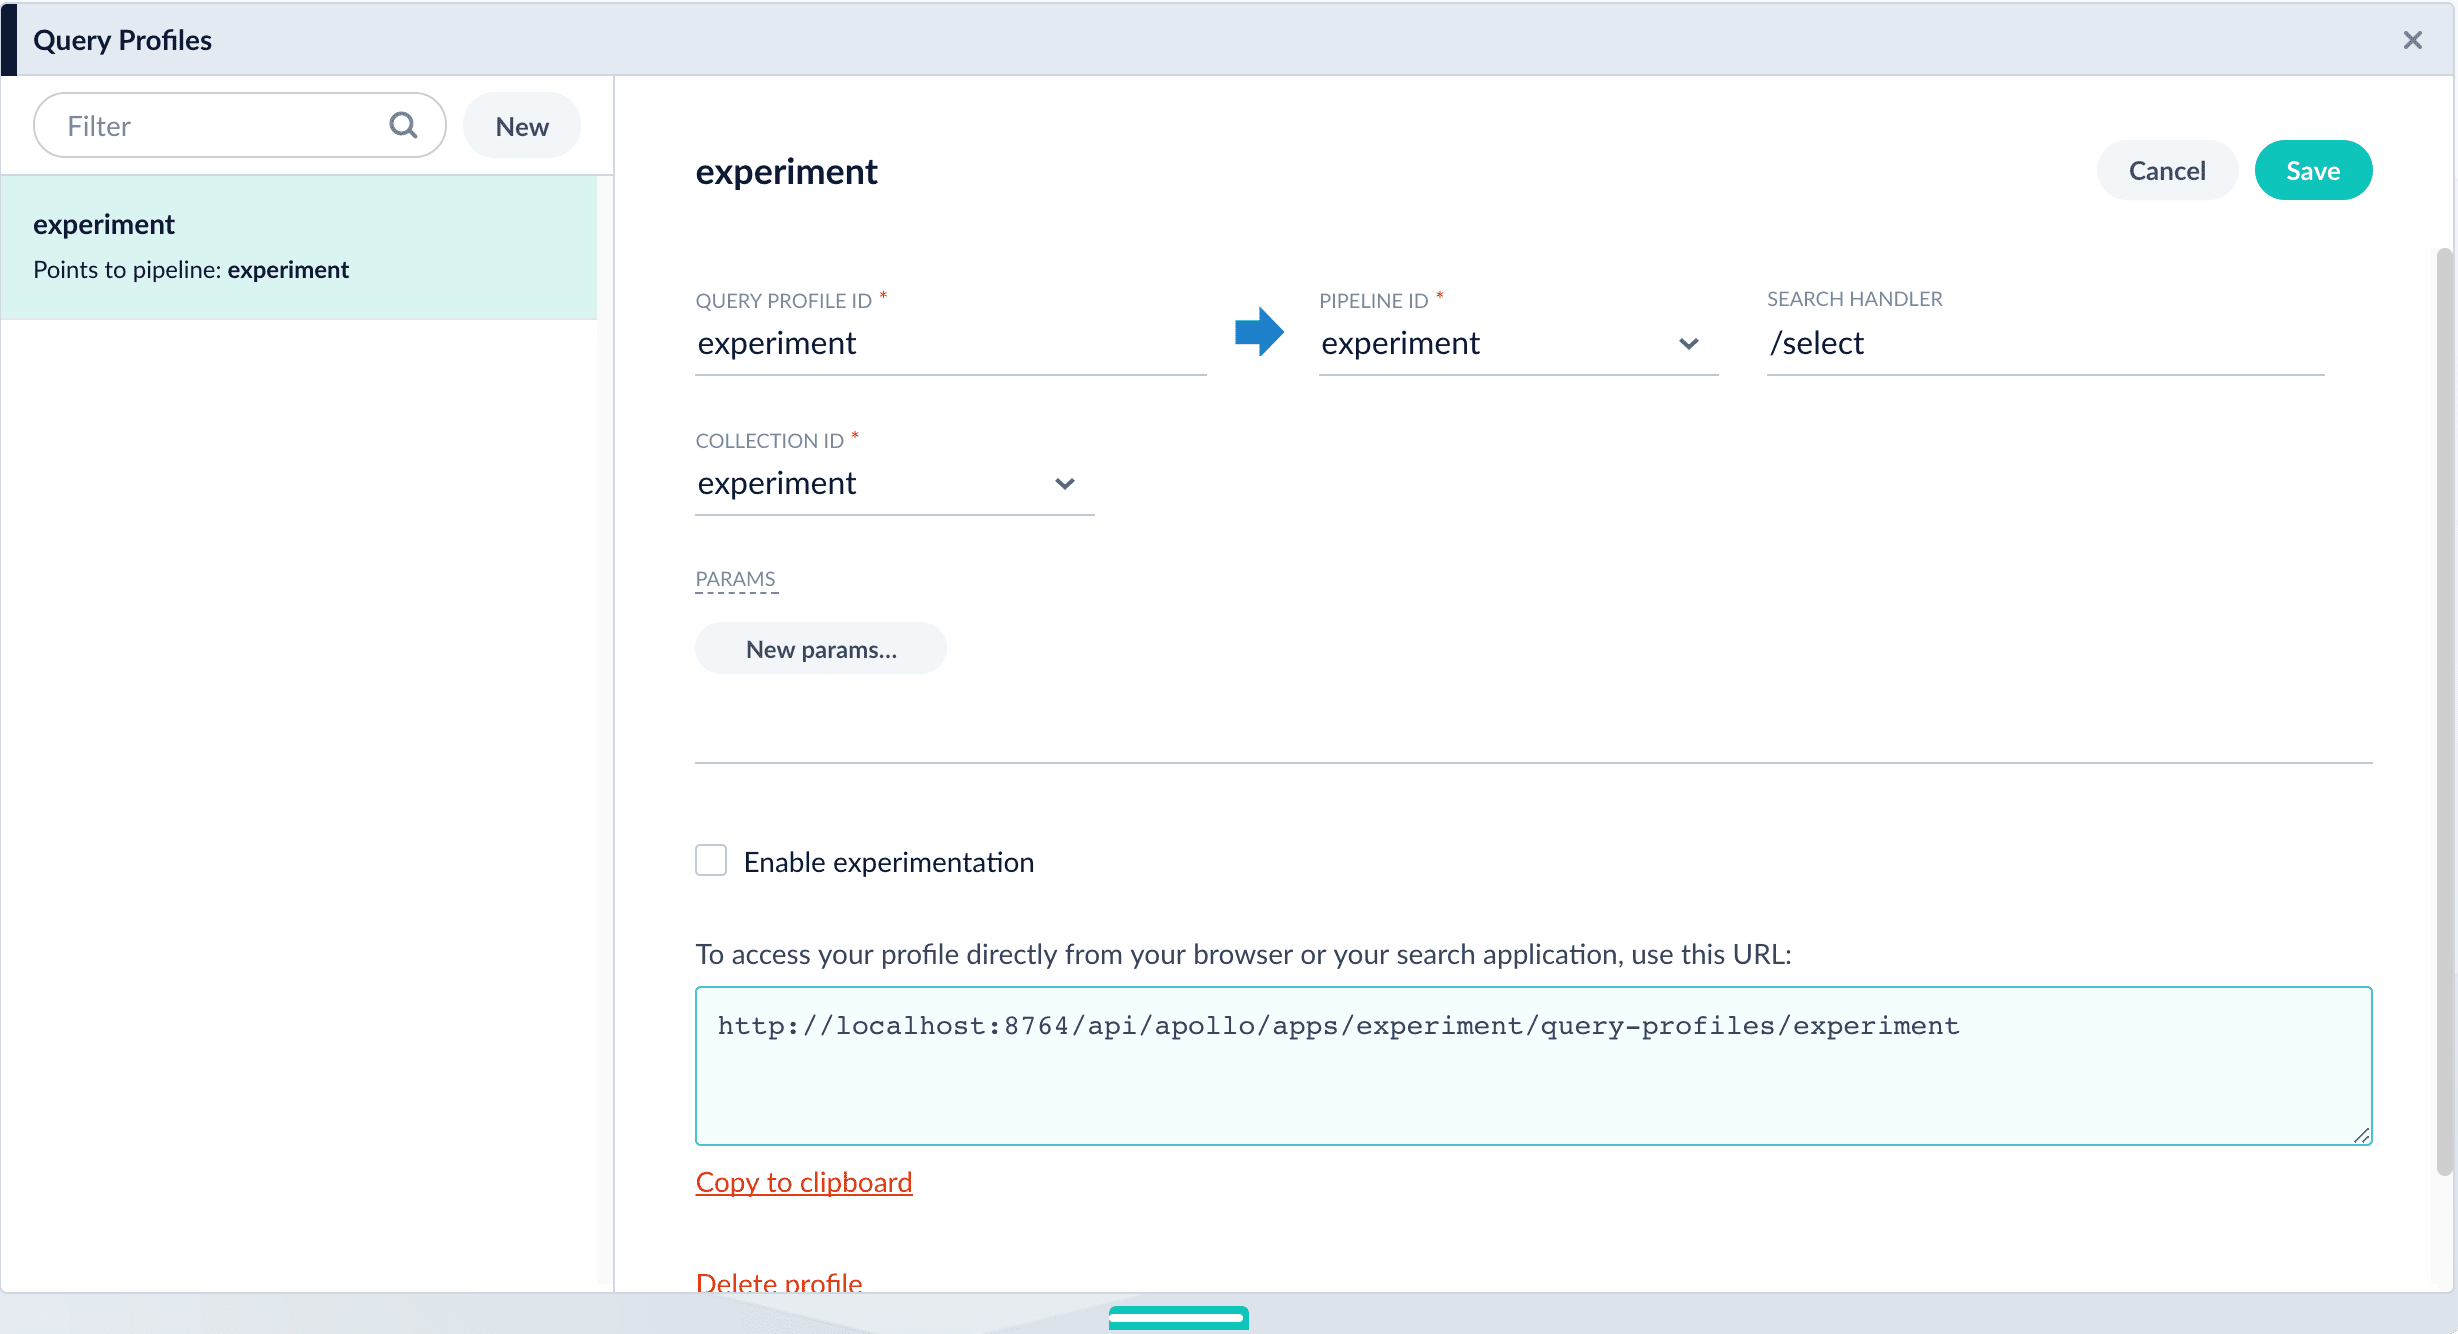 **How to create a new query profile:**
1. Navigate to Querying
**How to create a new query profile:**
1. Navigate to Querying 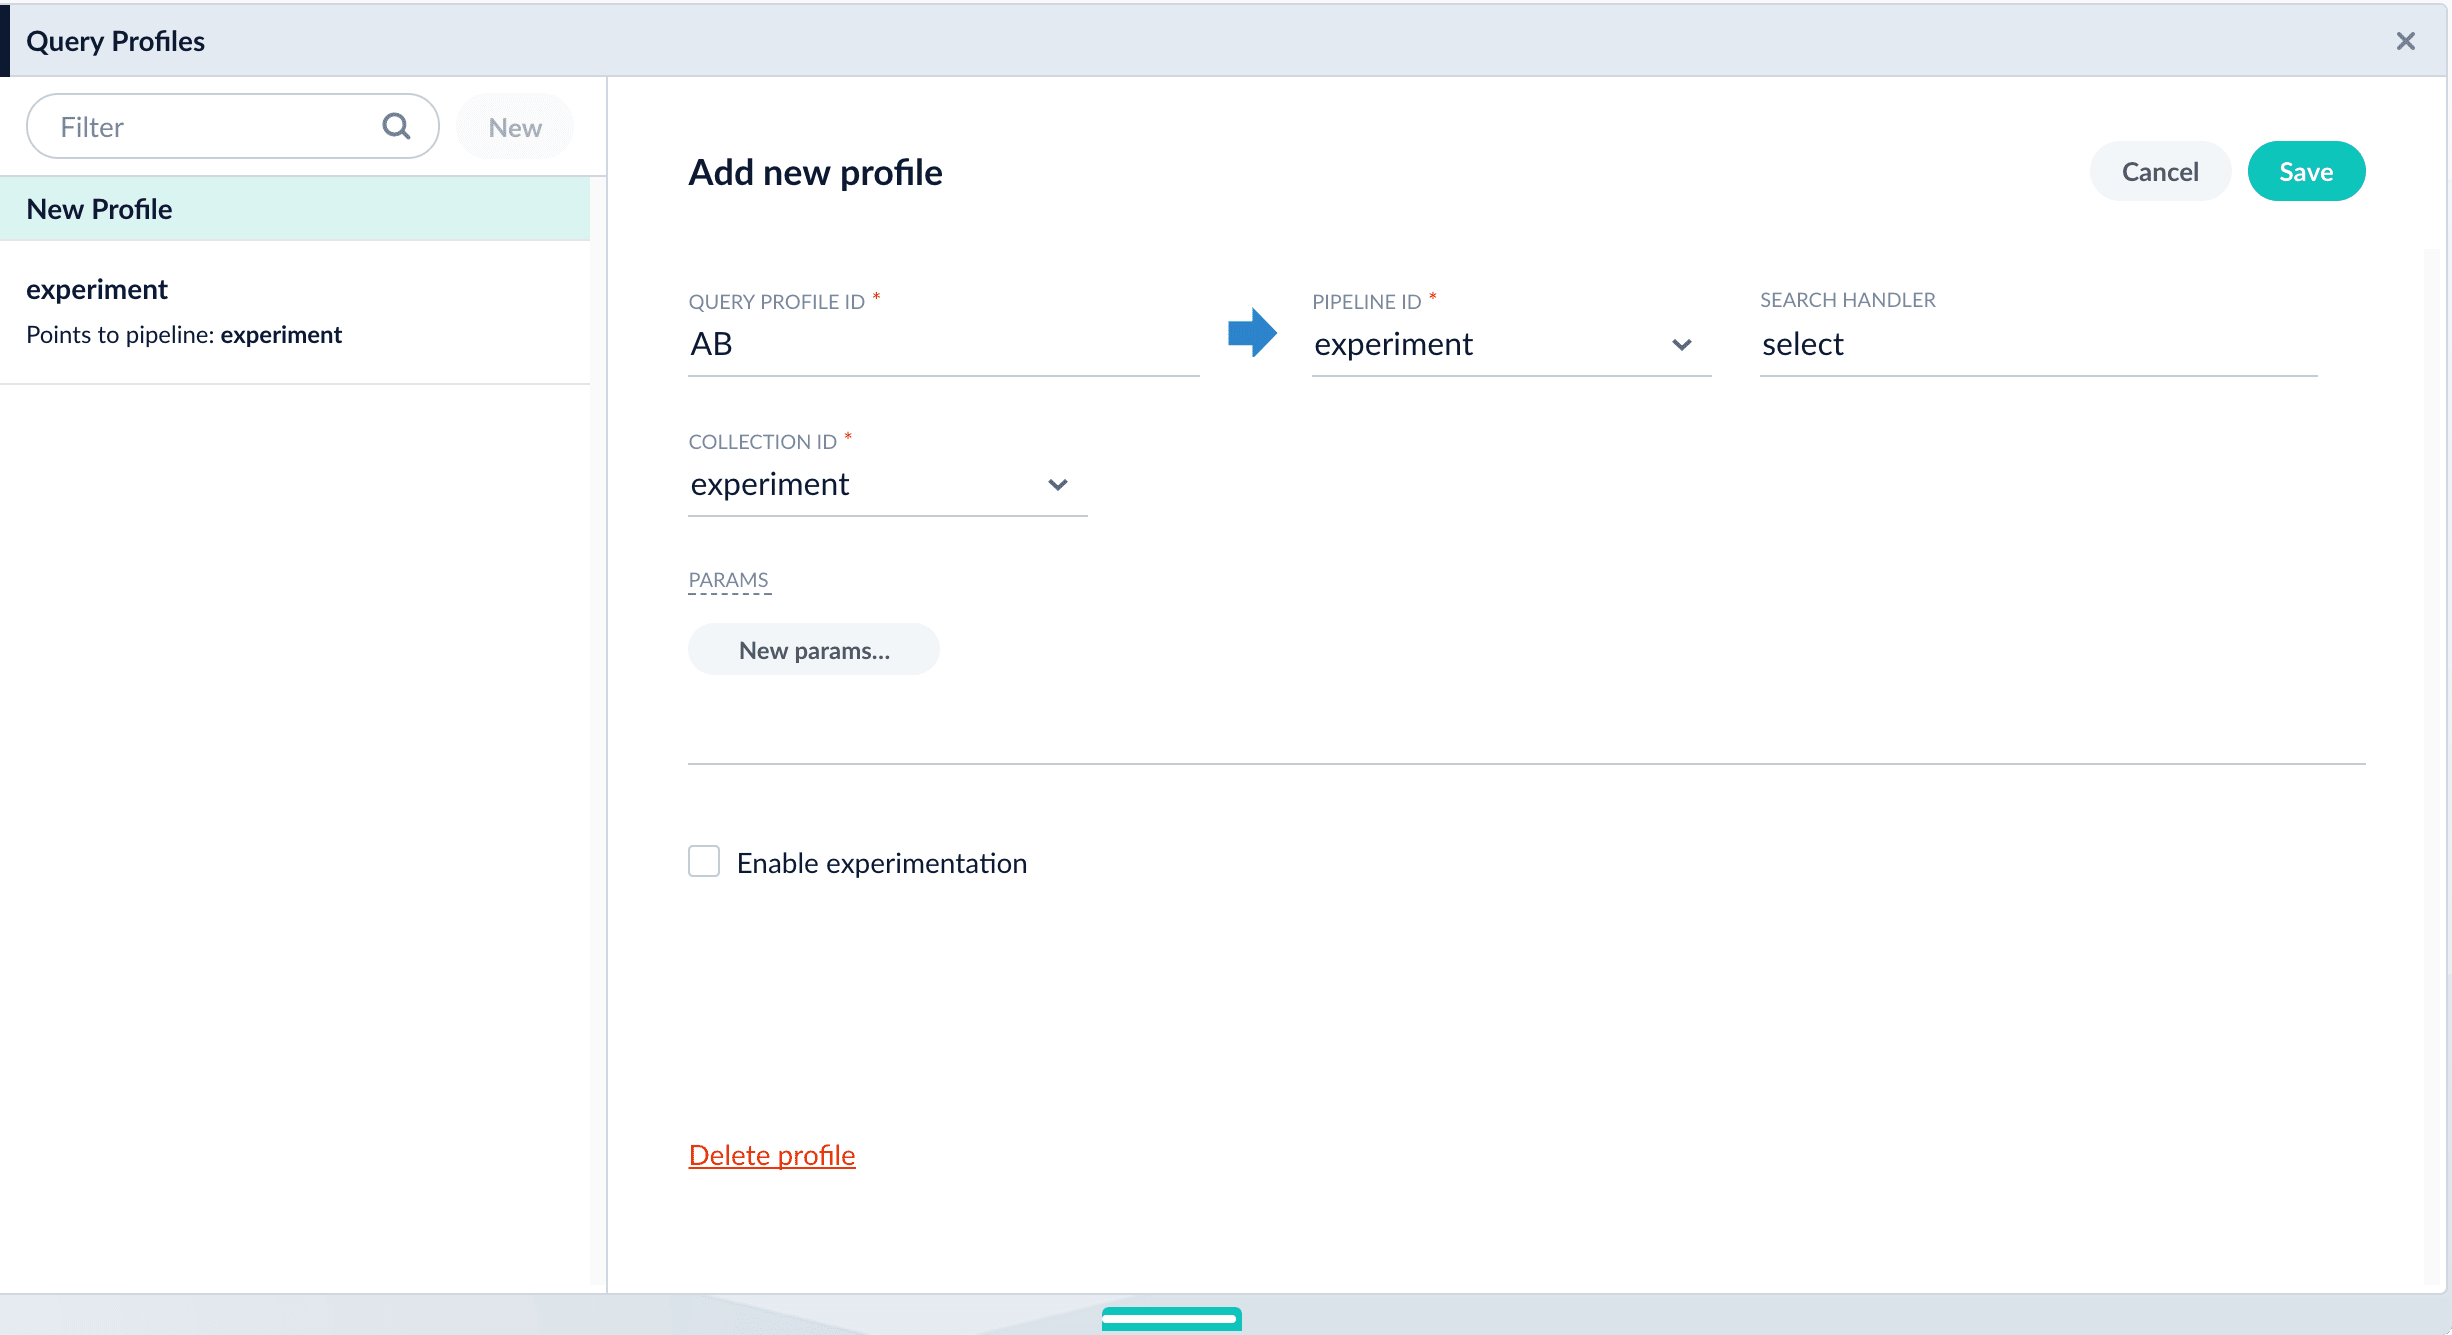 2. **Enable experimentation and specify experiment details in the query profile**:
1. Click the checkbox in front of **Enable experimentation**.
2. Specify the percent of traffic to include in the experiment.
3. Click the
2. **Enable experimentation and specify experiment details in the query profile**:
1. Click the checkbox in front of **Enable experimentation**.
2. Specify the percent of traffic to include in the experiment.
3. Click the 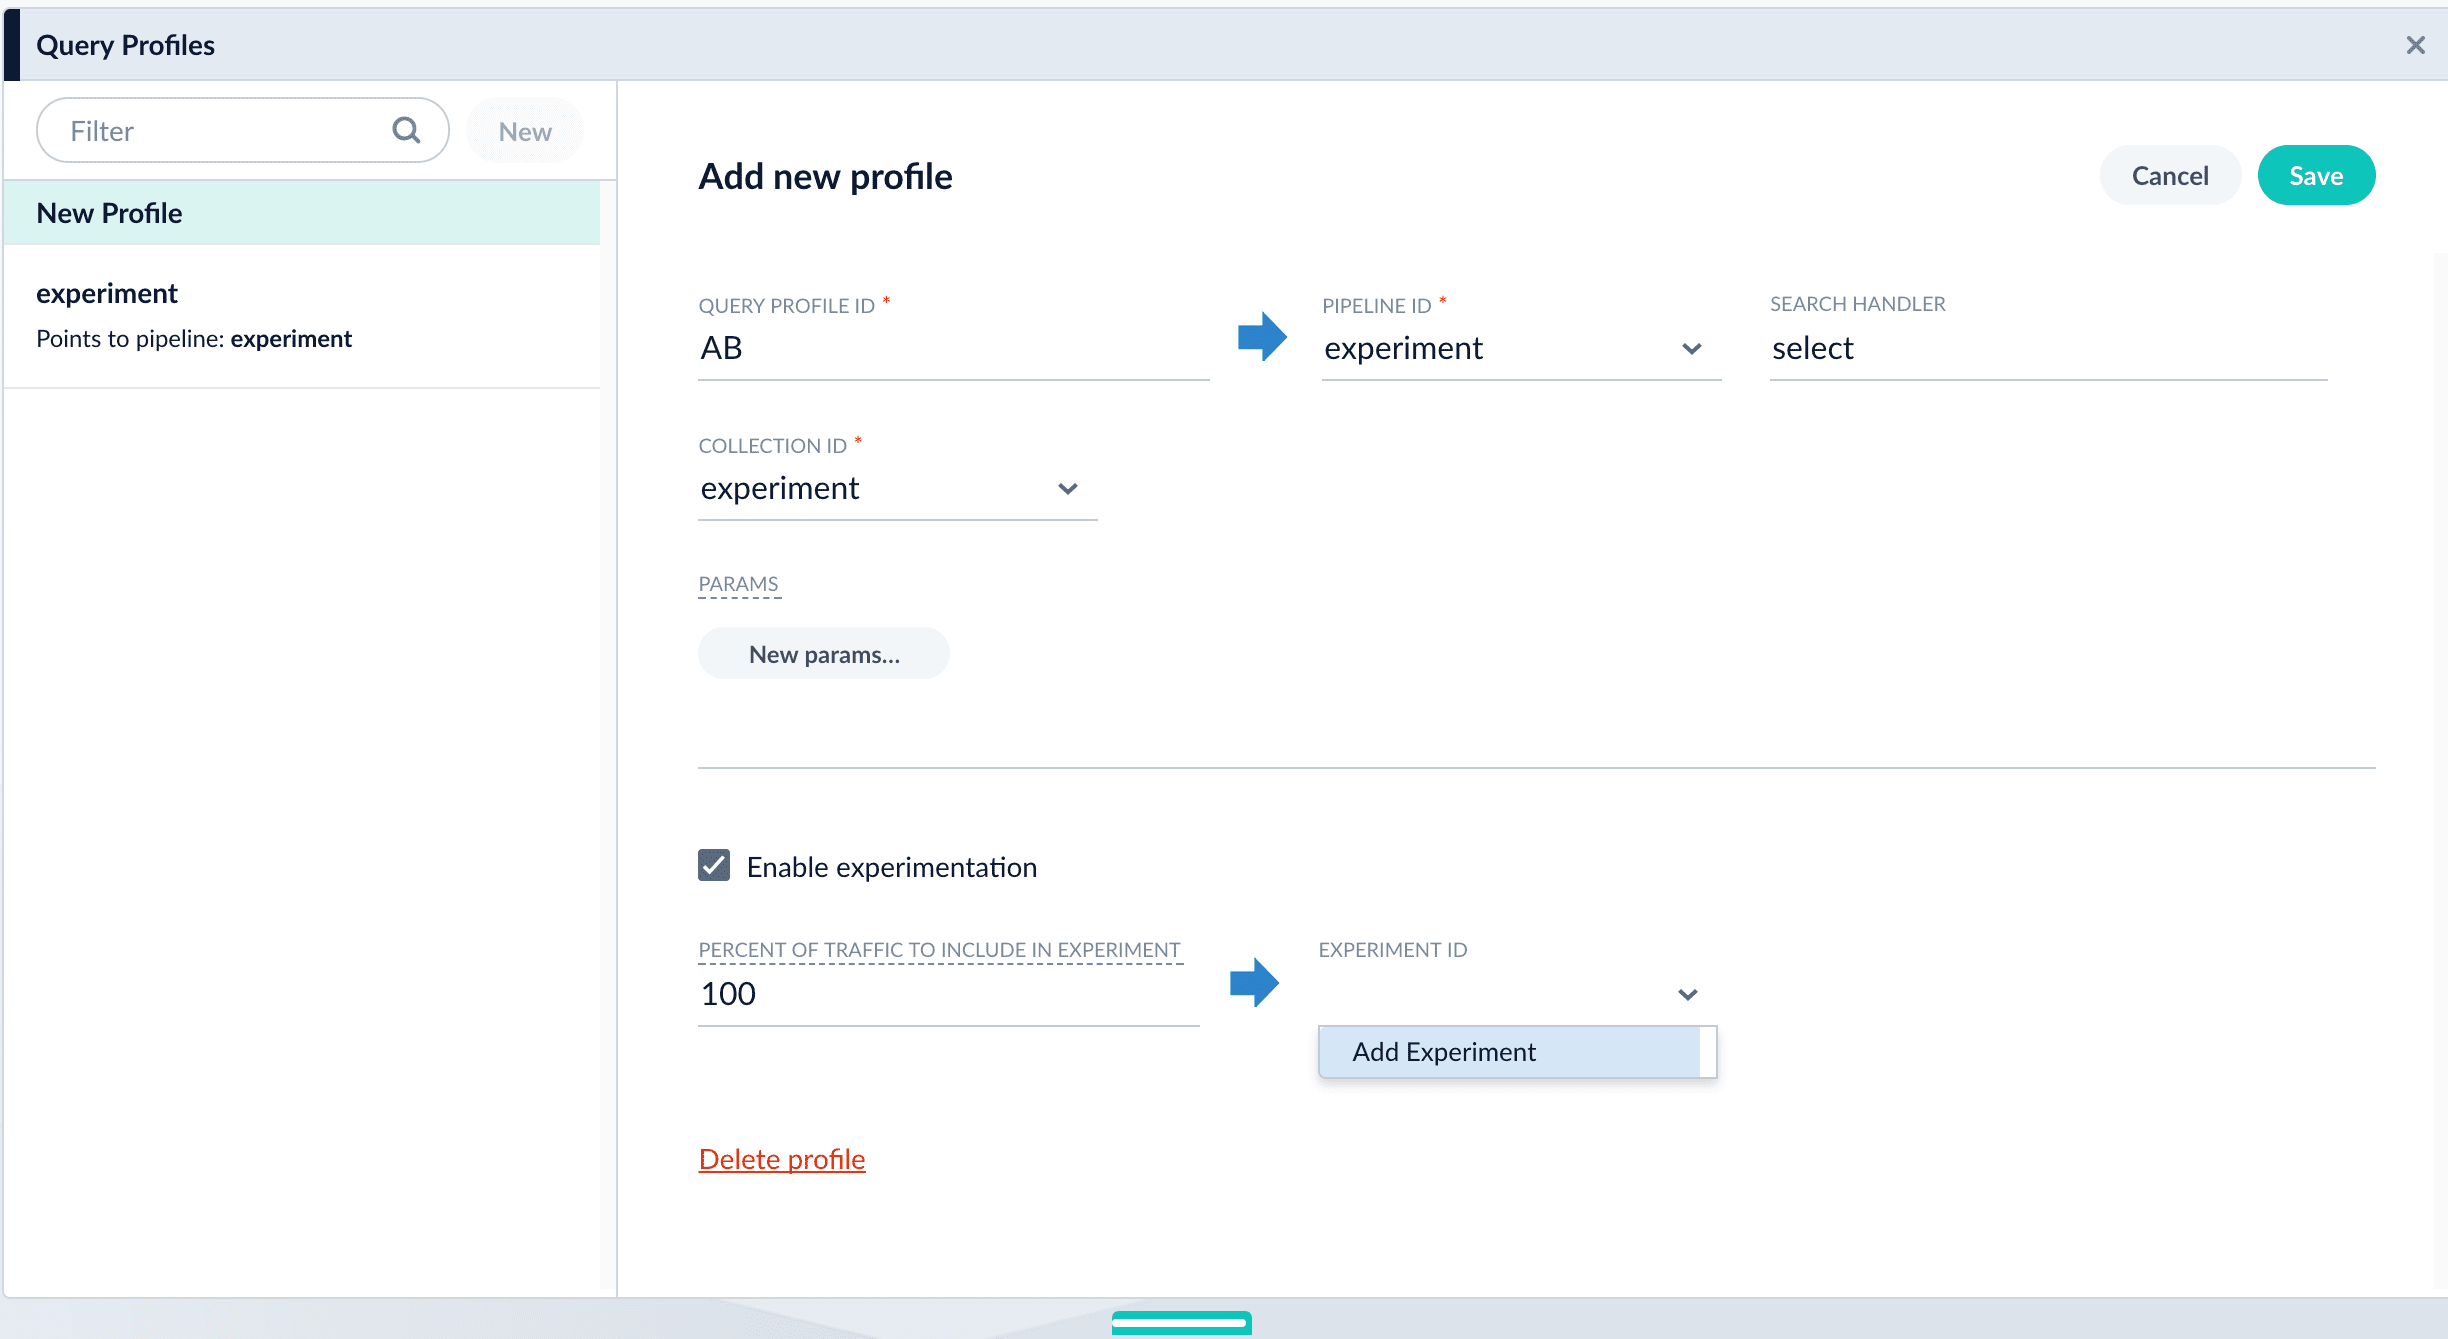 4. Enter an arbitrary **ID** (name) for the experiment.
5. Verify that the **unique ID parameter** is correct. It is the parameter that uniquely identifies each user. The default is `userId`. Correct the parameter if necessary, for example by specifying the session ID field instead.
6. Choose the base collection for signals. Signals resulting from requests that flow through the experiment are stored in the `_signals` collection associated with this collection.
7. (Optional) Enter a description for the experiment.
8. (Optional) To use a multi-armed bandit, select **Automatically Adjust Weights Between Variants**.
9. Add variants. Click **Add Variant** to add each non-control variant in your experiment.
4. Enter an arbitrary **ID** (name) for the experiment.
5. Verify that the **unique ID parameter** is correct. It is the parameter that uniquely identifies each user. The default is `userId`. Correct the parameter if necessary, for example by specifying the session ID field instead.
6. Choose the base collection for signals. Signals resulting from requests that flow through the experiment are stored in the `_signals` collection associated with this collection.
7. (Optional) Enter a description for the experiment.
8. (Optional) To use a multi-armed bandit, select **Automatically Adjust Weights Between Variants**.
9. Add variants. Click **Add Variant** to add each non-control variant in your experiment.
 10. For each variant:
11. Enter an arbitrary name. For the first variant, which is the control, Fusion uses the name `control`. You can change that name if you wish.
12. Click **Specify what varies** and specify what varies. Items you select are visible in the variant UI and have a green check mark in the dropdown menu. You can vary the query pipeline, query parameters (URL parameters to add to the query), and/or the collection.
10. For each variant:
11. Enter an arbitrary name. For the first variant, which is the control, Fusion uses the name `control`. You can change that name if you wish.
12. Click **Specify what varies** and specify what varies. Items you select are visible in the variant UI and have a green check mark in the dropdown menu. You can vary the query pipeline, query parameters (URL parameters to add to the query), and/or the collection.
 13. (*For query parameters*) Click **New params**. In the dialog box, specify the **Parameter Name**, **Parameter Value**, and **Update Policy** for each parameter (append, default, remove, or replace).
3. Add metrics. For each metric:
4. Click **Add Metric** and select the type of metric.
5. Fill in information for the metric.
13. (*For query parameters*) Click **New params**. In the dialog box, specify the **Parameter Name**, **Parameter Value**, and **Update Policy** for each parameter (append, default, remove, or replace).
3. Add metrics. For each metric:
4. Click **Add Metric** and select the type of metric.
5. Fill in information for the metric.
 6. Click **Save** to save the experiment.
### Option B: Create the experiment in the Experiments UI
You can create the experiment first and reference it from a query profile.
{/* // tag::create-experiment[] */}
1. **Create an experiment.** The experiment defines variants and metrics, as well as the user ID parameter and the base collection for signals:
2. Navigate to Analytics
6. Click **Save** to save the experiment.
### Option B: Create the experiment in the Experiments UI
You can create the experiment first and reference it from a query profile.
{/* // tag::create-experiment[] */}
1. **Create an experiment.** The experiment defines variants and metrics, as well as the user ID parameter and the base collection for signals:
2. Navigate to Analytics 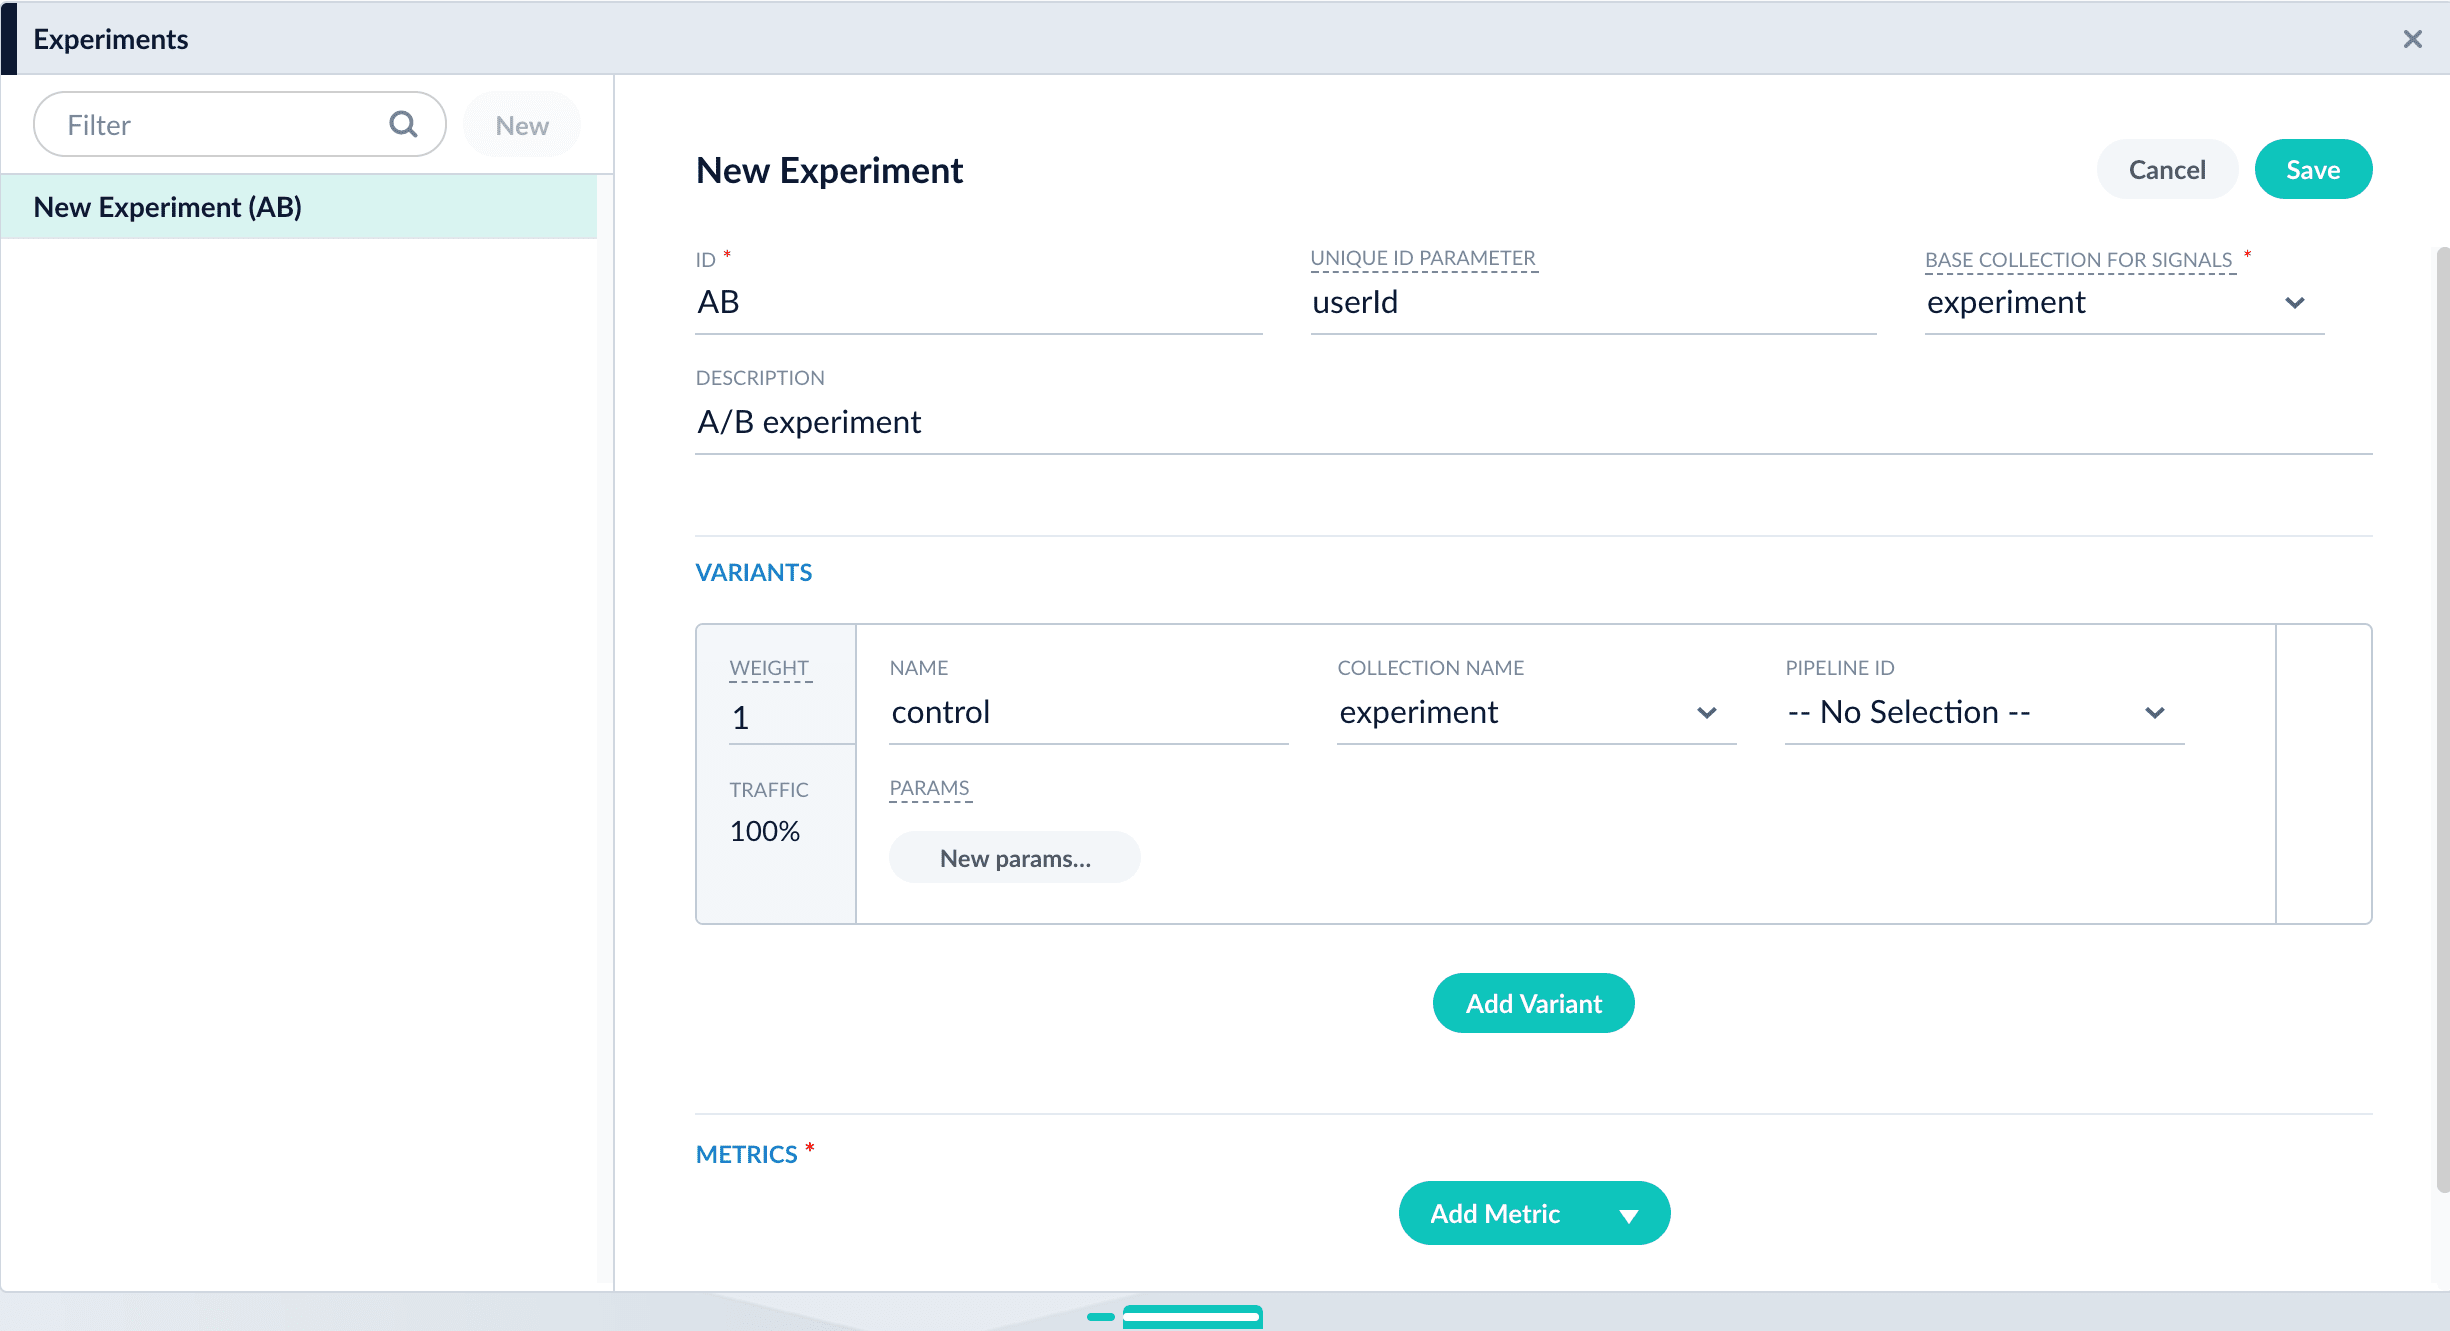 8. (Optional) To use a multi-armed bandit, select **Automatically Adjust Weights Between Variants**.
9. Add variants. Click **Add Variant** to add each non-control variant in your experiment.
8. (Optional) To use a multi-armed bandit, select **Automatically Adjust Weights Between Variants**.
9. Add variants. Click **Add Variant** to add each non-control variant in your experiment.
 10. For each variant:
11. Enter an arbitrary name. For the first variant, which is the control, Fusion uses the name `control`. You can change that name if you wish.
12. Click **Specify what varies** and specify what varies. Items you select are visible in the variant UI and have a green check mark in the dropdown menu. You can vary the query pipeline, query parameters (URL parameters to add to the query), and/or the collection.
10. For each variant:
11. Enter an arbitrary name. For the first variant, which is the control, Fusion uses the name `control`. You can change that name if you wish.
12. Click **Specify what varies** and specify what varies. Items you select are visible in the variant UI and have a green check mark in the dropdown menu. You can vary the query pipeline, query parameters (URL parameters to add to the query), and/or the collection.
 17. Click **Save** to save the experiment.
18. **Reference the experiment from the query profile.** Open the query profile you want to use for the experiment.
1. Navigate to Querying
17. Click **Save** to save the experiment.
18. **Reference the experiment from the query profile.** Open the query profile you want to use for the experiment.
1. Navigate to Querying 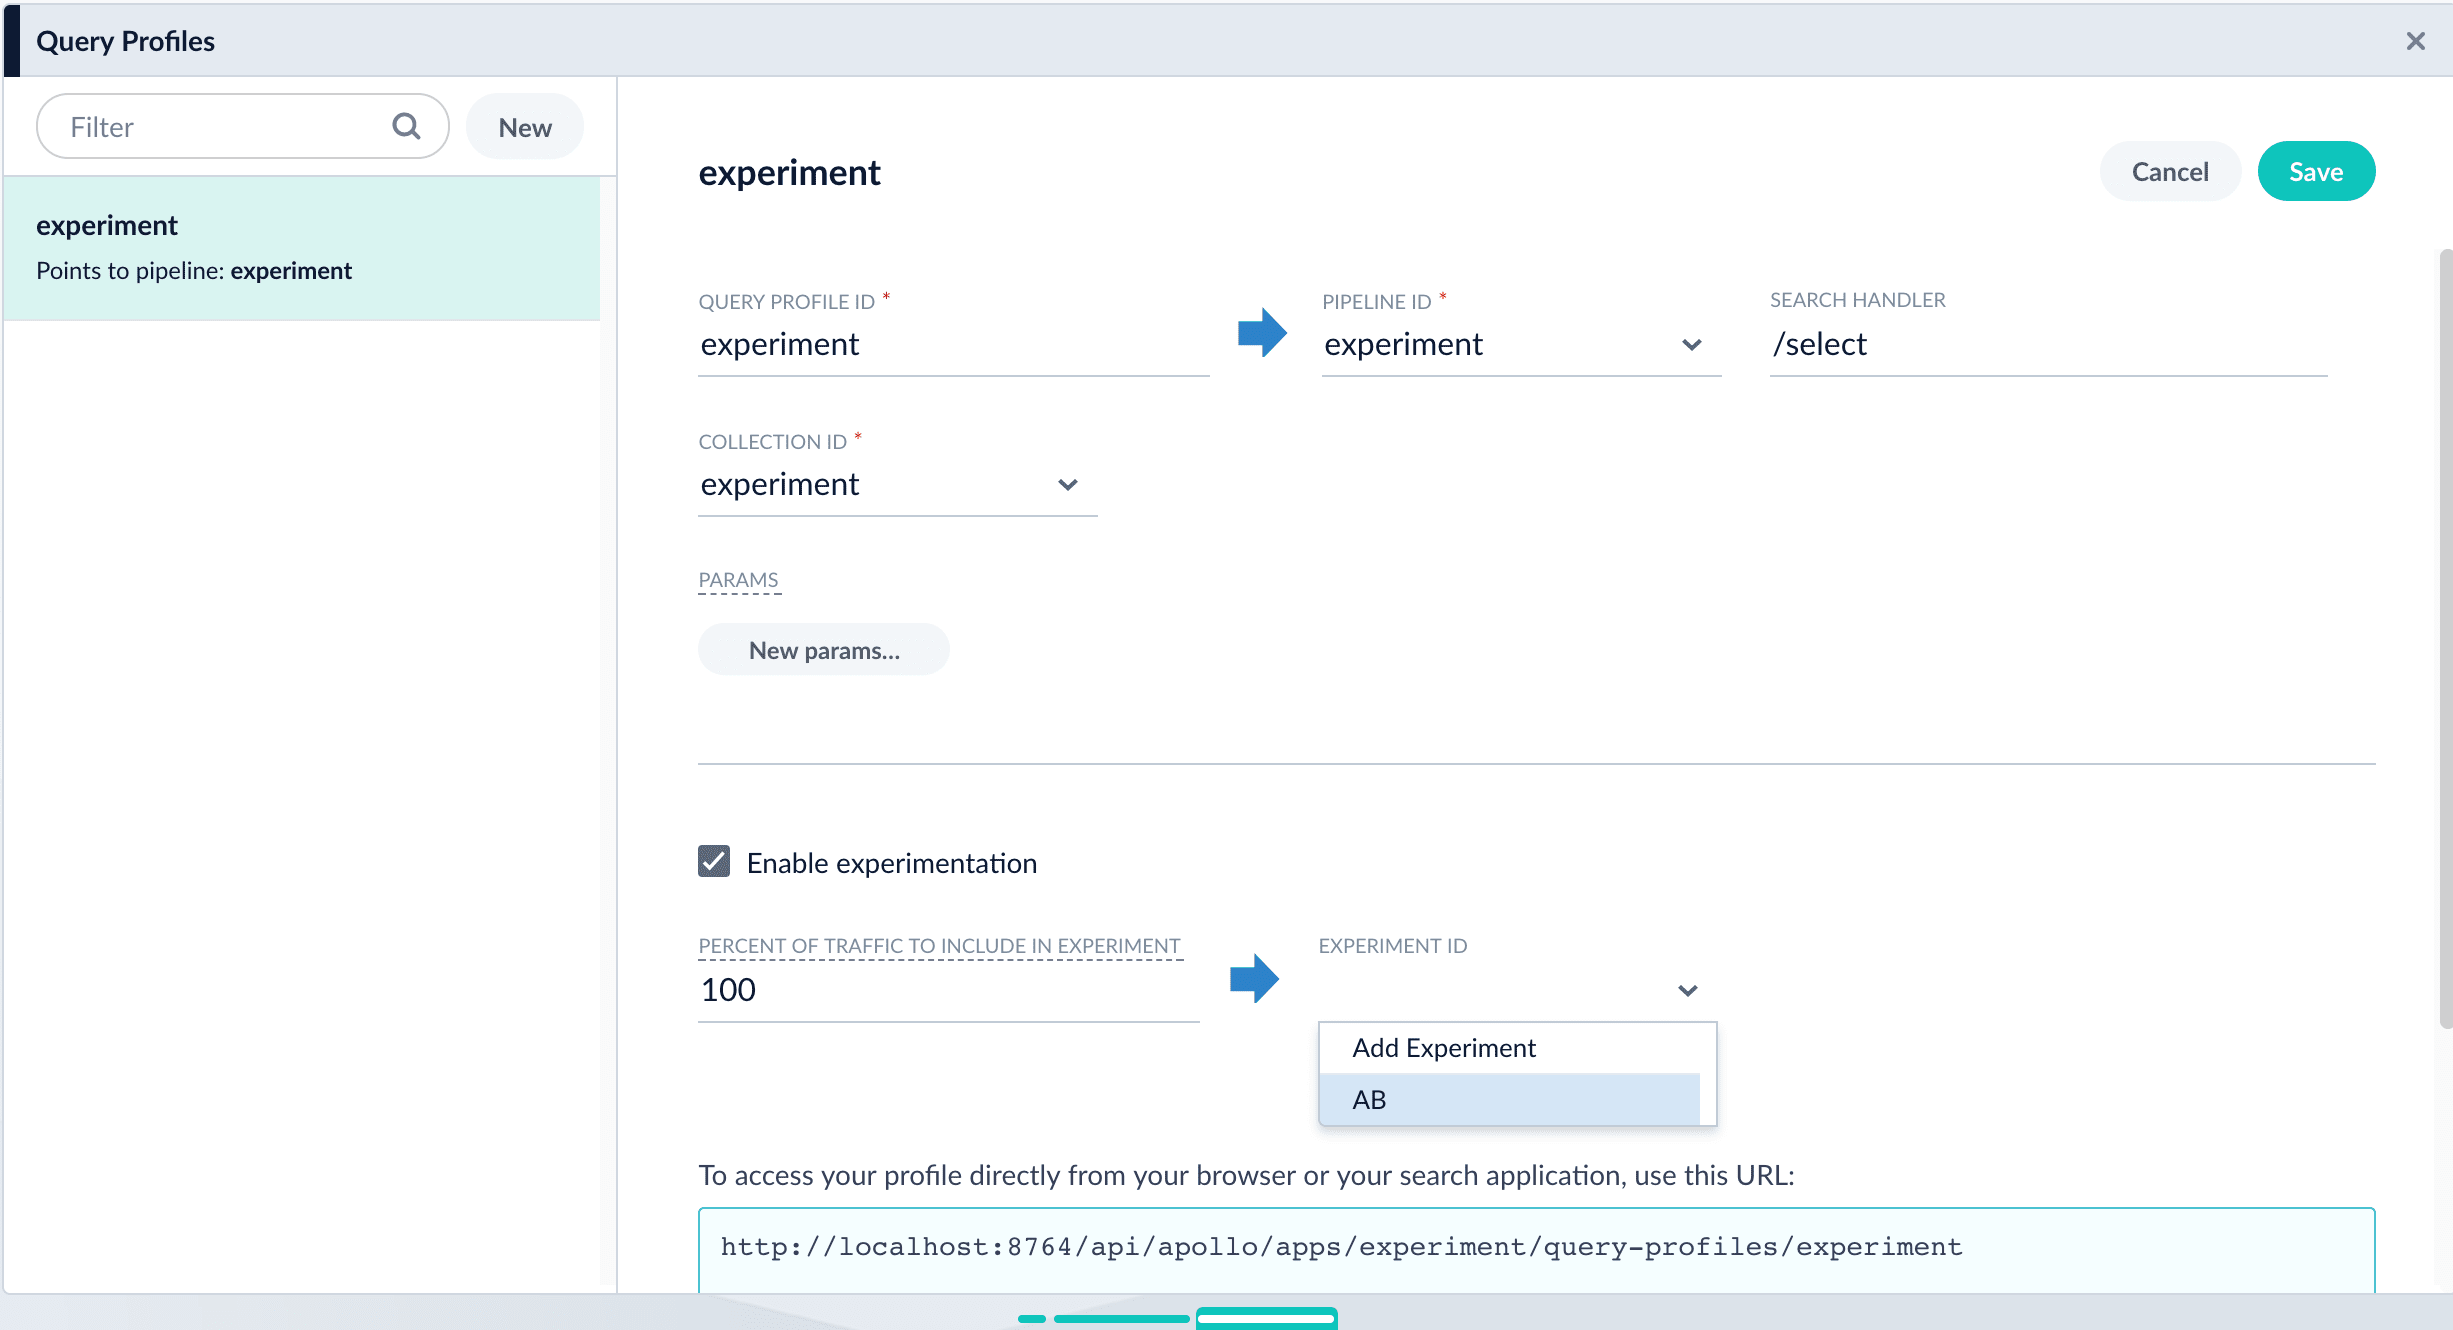 8\. Click **Save** to save the query profile.
## Next step
You have set up the experiment. Alternatively, you will set it up using an Experiment stage. If you chose to use this article for setting up your experiment, you can skip the next article.
8\. Click **Save** to save the query profile.
## Next step
You have set up the experiment. Alternatively, you will set it up using an Experiment stage. If you chose to use this article for setting up your experiment, you can skip the next article.
 1. A user searches in a search app. For example, the user might search for `shirt`.
2. The search app backend appends a `userId` or other unique ID that identifies the user, for example, `userId=123`, to the query and sends the query to the query profile endpoint for the experiment.
3. Using information in the query profile and the value of the unique ID, Lucidworks Search routes the query through one of the experiment’s variants. In this example, Lucidworks Search routes the query through query pipeline 1.
4. A query pipeline adds a `x-fusion-query-id` to the response header, for example, `x-fusion-query-id=abc`.
5. Based on the query, Lucidworks Search obtains a search result from the index, which is stored in the primary collection. Lucidworks Search sends the search result back to the search app.
6. Lucidworks Search sends a response signal to the signals collection.
7. A different user might be routed through the other experiment variant shown here, and through query pipeline 2. This query pipeline has an enabled Boost with Signals stage, unlike query pipeline 1.
8. The search user interacts with the search results, viewing them, possibly clicking on specific results, possibly buying things, and so forth. For example, the user might click the document with `docId=757`.
9. Based on the interactions, the search app backend sends click signals to the signals endpoint for the query profile. Signals include the same query ID so Lucidworks Search can associate the signals with the experiment. Specifically, the click signal *must* include a field named `fusion_query_id` in the `params` object of the raw click signal whose value was returned in the response object in a header named `x-fusion-query-id`. If you are tracking queries and responses with App Studio, the `fusion_query_id` parameter will be passed with the click signal as long as you specify the appropriate response attribute in your `track:clicks` tag.
10. Using information in the query profile, Lucidworks Search routes the signals to the `_signals_ingest` pipeline.
11. The `_signals_ingest` pipeline stores signals in the `_signals` collection. Signals include the collection ID of the primary collection and experiment tracking information.
## Metrics generation
This diagram illustrates metrics generation:
1. A user searches in a search app. For example, the user might search for `shirt`.
2. The search app backend appends a `userId` or other unique ID that identifies the user, for example, `userId=123`, to the query and sends the query to the query profile endpoint for the experiment.
3. Using information in the query profile and the value of the unique ID, Lucidworks Search routes the query through one of the experiment’s variants. In this example, Lucidworks Search routes the query through query pipeline 1.
4. A query pipeline adds a `x-fusion-query-id` to the response header, for example, `x-fusion-query-id=abc`.
5. Based on the query, Lucidworks Search obtains a search result from the index, which is stored in the primary collection. Lucidworks Search sends the search result back to the search app.
6. Lucidworks Search sends a response signal to the signals collection.
7. A different user might be routed through the other experiment variant shown here, and through query pipeline 2. This query pipeline has an enabled Boost with Signals stage, unlike query pipeline 1.
8. The search user interacts with the search results, viewing them, possibly clicking on specific results, possibly buying things, and so forth. For example, the user might click the document with `docId=757`.
9. Based on the interactions, the search app backend sends click signals to the signals endpoint for the query profile. Signals include the same query ID so Lucidworks Search can associate the signals with the experiment. Specifically, the click signal *must* include a field named `fusion_query_id` in the `params` object of the raw click signal whose value was returned in the response object in a header named `x-fusion-query-id`. If you are tracking queries and responses with App Studio, the `fusion_query_id` parameter will be passed with the click signal as long as you specify the appropriate response attribute in your `track:clicks` tag.
10. Using information in the query profile, Lucidworks Search routes the signals to the `_signals_ingest` pipeline.
11. The `_signals_ingest` pipeline stores signals in the `_signals` collection. Signals include the collection ID of the primary collection and experiment tracking information.
## Metrics generation
This diagram illustrates metrics generation:
 1. A Lucidworks Search administrator can configure which metrics are relevant for a given experiment and the frequency with which experiment metrics are generated. They can also generate metrics on demand.
2. Using signal data, an automatically-created Spark job periodically runs in the background. It obtains signal data from the `COLLECTION_NAME_signals` collection, computes metrics for each experiment variant, and writes the metrics to the collection used for aggregated signals (`_signals_aggr`).
3. In the Lucidworks Search UI, an administrator can view experiment metrics.
4. These calculated metrics are used to display reports about the experiment.
## Learn more
1. A Lucidworks Search administrator can configure which metrics are relevant for a given experiment and the frequency with which experiment metrics are generated. They can also generate metrics on demand.
2. Using signal data, an automatically-created Spark job periodically runs in the background. It obtains signal data from the `COLLECTION_NAME_signals` collection, computes metrics for each experiment variant, and writes the metrics to the collection used for aggregated signals (`_signals_aggr`).
3. In the Lucidworks Search UI, an administrator can view experiment metrics.
4. These calculated metrics are used to display reports about the experiment.
## Learn more
 4. (Optional) Specify a label for the stage.
5. (Optional) Specify a condition that must be satisfied for queries to pass through the experiment.
6. Under **Experiment ID**, choose the experiment.
7. (Optional) Specify the percent of traffic to include in the experiment.
8. Click **Save**.
9. Drag the stage to where you want it in the pipeline.
10. Click **Save**.
You control the experiment in **Analytics**
4. (Optional) Specify a label for the stage.
5. (Optional) Specify a condition that must be satisfied for queries to pass through the experiment.
6. Under **Experiment ID**, choose the experiment.
7. (Optional) Specify the percent of traffic to include in the experiment.
8. Click **Save**.
9. Drag the stage to where you want it in the pipeline.
10. Click **Save**.
You control the experiment in **Analytics**