> ## Documentation Index
> Fetch the complete documentation index at: https://doc.lucidworks.com/llms.txt
> Use this file to discover all available pages before exploring further.
# MCP Server Monitoring
> Scrape the Fusion API gateway's per-route metrics and import a ready-made Grafana dashboard to visualize Lucidworks MCP Server usage and latency.
You can track MCP server usage using metrics exposed by the Fusion API gateway.
You only need to scrape a metrics endpoint and import the provided dashboard.
New to Lucidworks MCP?
See the [MCP Server overview](/docs/5/fusion/getting-data-out/mcp) for setup instructions and configuration details.
## How MCP usage is measured
All MCP traffic enters Fusion through the API gateway at the `/mcp` route.
The gateway records a per-route latency histogram, `gateway_request_time_secs`, on every request.
The label `routeId="mcp-server"` isolates MCP traffic from all other gateway routes, providing a clean MCP-only view without touching the MCP server itself.
The histogram carries these labels:
| Label | Meaning |
| ---------------- | --------------------------------------------- |
| `routeId` | Gateway route; `mcp-server` = MCP traffic |
| `httpMethod` | HTTP method (the MCP server uses `POST`) |
| `httpStatusCode` | Response status code (`200`, `202`, `404`, …) |
| `outcome` | `SUCCESSFUL`, `CLIENT_ERROR`, `SERVER_ERROR` |
| `status` | Spring HTTP status enum (`OK`, `ACCEPTED`, …) |
The histogram exposes three series families:
* `gateway_request_time_secs_count` — total number of requests
* `gateway_request_time_secs_sum` — sum of all request durations in seconds
* `gateway_request_time_secs_bucket` — histogram buckets that power the latency percentiles
## Prerequisites
* **Fusion 5.17 or later** with Lucidworks MCP Server deployed and serving traffic
* **Prometheus** (or any Prometheus-compatible TSDB) able to scrape your Fusion cluster
* **Grafana** with your Prometheus configured as a data source
The API gateway exposes Prometheus metrics at port **6764**, path **/actuator/prometheus**.
## Set up MCP monitoring
Configure Prometheus to scrape the gateway's `/actuator/prometheus` endpoint on port `6764`.
Use whichever method matches your setup:
Create a `ServiceMonitor` resource:
```yaml theme={"dark"}
apiVersion: monitoring.coreos.com/v1
kind: ServiceMonitor
metadata:
name: fusion-api-gateway
namespace:
labels:
release: prometheus # match your Prometheus Operator's serviceMonitorSelector
spec:
namespaceSelector:
matchNames:
-
selector:
matchLabels:
app.kubernetes.io/component: api-gateway
endpoints:
- targetPort: 6764
path: /actuator/prometheus
interval: 30s
```
If your Prometheus Operator selects `PodMonitor` resources instead of services, use a `PodMonitor` with the same selector and a `podMetricsEndpoints` entry on port `6764`.
If your Prometheus discovers targets via pod annotations, add these to the api-gateway pods (Helm `values.yaml` of the gateway):
```yaml theme={"dark"}
prometheus.io/scrape: "true"
prometheus.io/port: "6764"
prometheus.io/path: "/actuator/prometheus"
```
```yaml theme={"dark"}
scrape_configs:
- job_name: fusion-api-gateway
metrics_path: /actuator/prometheus
kubernetes_sd_configs:
- role: pod
relabel_configs:
- source_labels: [__meta_kubernetes_pod_label_app_kubernetes_io_component]
action: keep
regex: api-gateway
- source_labels: [__address__]
action: replace
regex: ([^:]+)(?::\d+)?
replacement: $1:6764
target_label: __address__
```
**Cardinality note**: `gateway_request_time_secs` is a histogram across all gateway routes.
If you only want MCP metrics and wish to limit series, add a `metric_relabel_configs` `keep` rule for `gateway_request_time_secs.*` where `routeId="mcp-server"`.
Otherwise you will also collect percentiles for every other gateway route.
In Prometheus (or Grafana **Explore**), run:
```promql theme={"dark"}
sum by (routeId) (gateway_request_time_secs_count)
```
You should see a series with `routeId="mcp-server"` once the MCP server has received traffic.
If it's absent, confirm the scrape target is `UP` and that MCP requests have actually been made.
1. Download [mcp-usage-dashboard-portable.json](/assets/downloads/mcp-usage-dashboard-portable.json).
2. In Grafana, go to **Dashboards** → **New** → **Import**.
3. Upload the JSON file.
4. When prompted, select your **Prometheus data source**.
5. Click **Save**.
The dashboard has a **data source** dropdown and a **Namespace** filter at the top so you can scope it to your environment.
Alternatively, build your own dashboard using the reference PromQL queries below.
## Dashboard panels
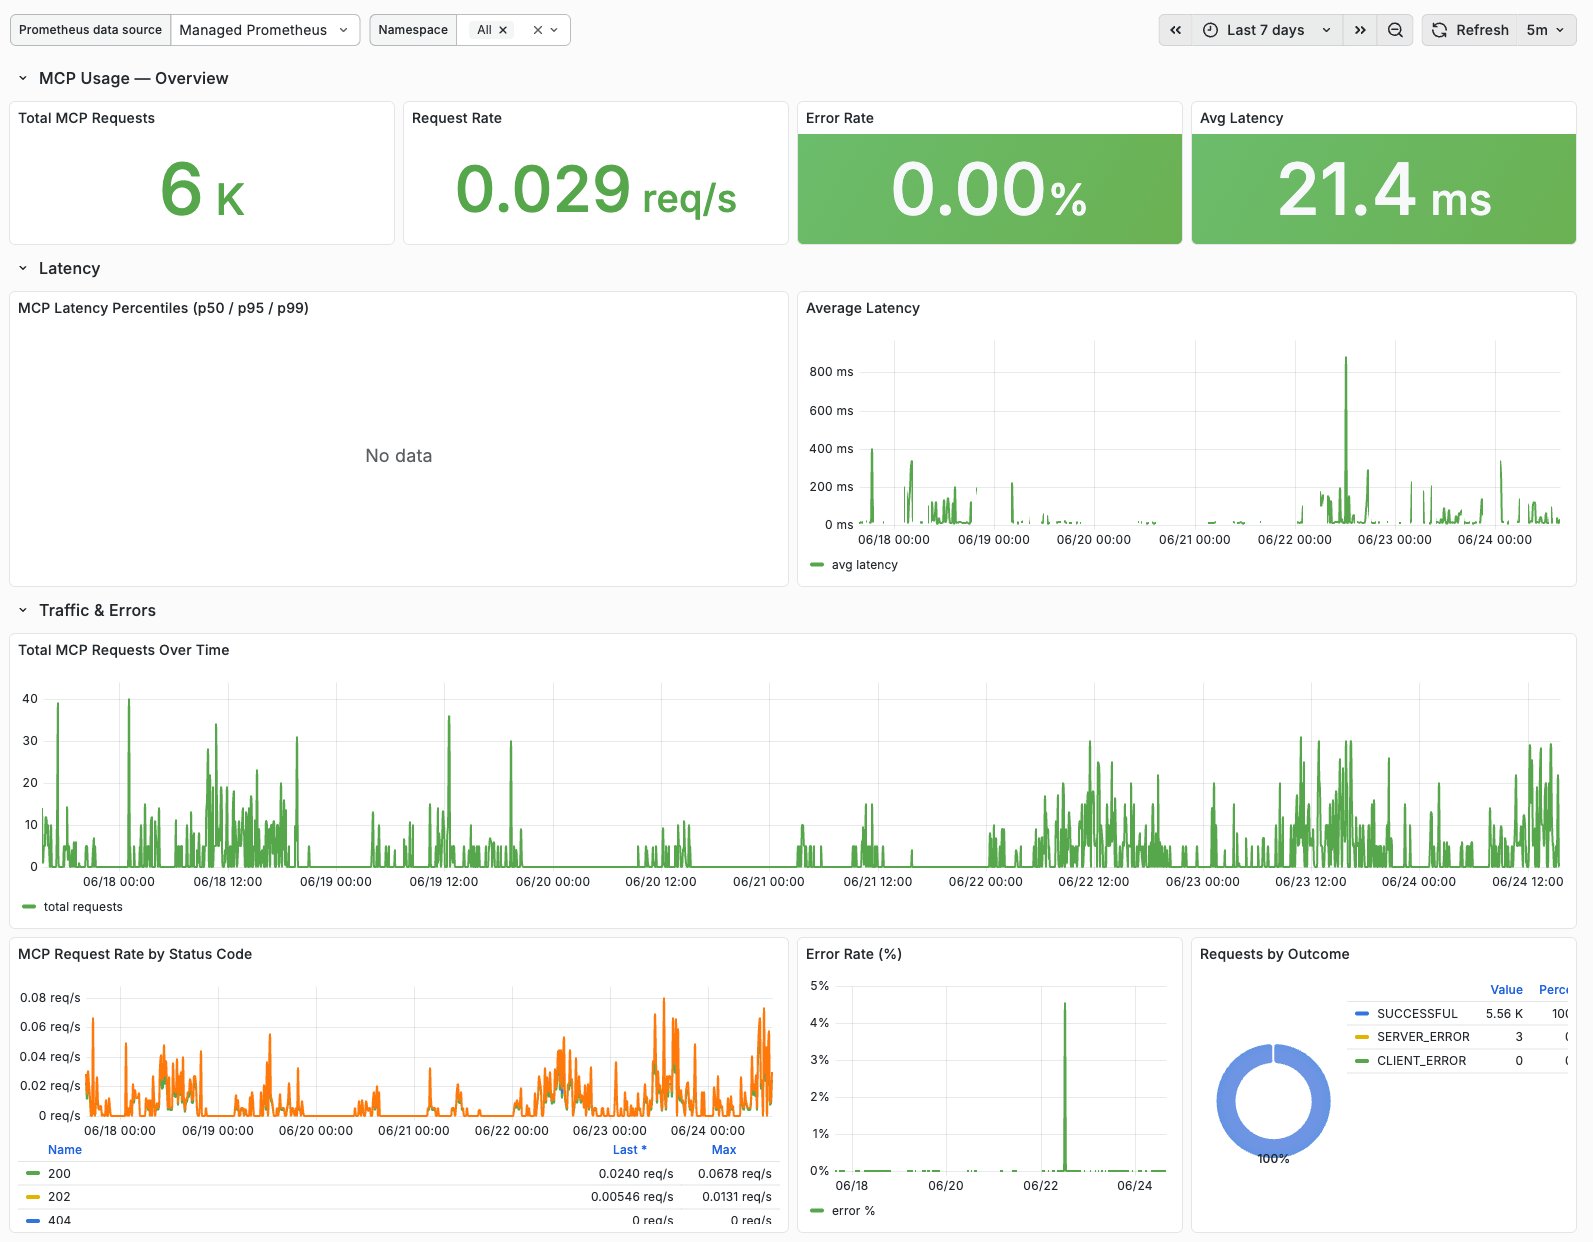
The imported dashboard includes panels organized into three sections: overview metrics, latency analysis, and traffic breakdown.
 ### Overview metrics
| Panel | Description |
| ---------------------- | ---------------------------------------------------------------------------------------------------------------------------- |
| **Total MCP Requests** | Total MCP calls over the selected range |
| **Request Rate** | Current throughput in requests per second |
| **Error Rate** | Percent of MCP requests that failed with 4xx or 5xx status codes; green (less than 1%), yellow (1-5%), red (greater than 5%) |
| **Avg Latency** | Average MCP response time in milliseconds |
### Latency metrics
| Panel | Description |
| --------------------------- | --------------------------------------------------------- |
| **MCP Latency Percentiles** | p50, p95, and p99 latency distribution from the histogram |
| **Average Latency** | Average response time over time |
### Traffic metrics and errors
| Panel | Description |
| ----------------------------------- | ---------------------------------------------------- |
| **MCP Request Rate by Status Code** | Throughput split by HTTP status code |
| **Error Rate** | Failure percentage over time |
| **Requests by Outcome** | Success versus client and server error breakdown |
| **Total MCP Requests Over Time** | Single-line graph showing total request volume trend |
## PromQL query examples
Use these queries to build custom dashboard panels or understand what powers each panel in the imported dashboard.
Replace `$namespace` with your Kubernetes namespace or use `.*` to match all namespaces.
```promql theme={"dark"}
sum(increase(gateway_request_time_secs_count{
routeId="mcp-server",
namespace=~"$namespace"
}[$__range]))
```
```promql theme={"dark"}
sum(increase(gateway_request_time_secs_count{
routeId="mcp-server",
namespace=~"$namespace"
}[$__interval]))
```
```promql theme={"dark"}
sum(rate(gateway_request_time_secs_count{
routeId="mcp-server",
namespace=~"$namespace"
}[$__rate_interval]))
```
```promql theme={"dark"}
100 * (
sum(rate(gateway_request_time_secs_count{
routeId="mcp-server",
namespace=~"$namespace",
outcome=~"CLIENT_ERROR|SERVER_ERROR"
}[$__rate_interval])) or vector(0)
) / sum(rate(gateway_request_time_secs_count{
routeId="mcp-server",
namespace=~"$namespace"
}[$__rate_interval]))
```
```promql theme={"dark"}
1000 * sum(rate(gateway_request_time_secs_sum{
routeId="mcp-server",
namespace=~"$namespace"
}[$__rate_interval])) / sum(rate(gateway_request_time_secs_count{
routeId="mcp-server",
namespace=~"$namespace"
}[$__rate_interval]))
```
```promql theme={"dark"}
1000 * histogram_quantile(0.50, sum by (le) (
rate(gateway_request_time_secs_bucket{
routeId="mcp-server",
namespace=~"$namespace"
}[$__rate_interval])
))
```
```promql theme={"dark"}
1000 * histogram_quantile(0.95, sum by (le) (
rate(gateway_request_time_secs_bucket{
routeId="mcp-server",
namespace=~"$namespace"
}[$__rate_interval])
))
```
```promql theme={"dark"}
1000 * histogram_quantile(0.99, sum by (le) (
rate(gateway_request_time_secs_bucket{
routeId="mcp-server",
namespace=~"$namespace"
}[$__rate_interval])
))
```
```promql theme={"dark"}
sum by (httpStatusCode) (
rate(gateway_request_time_secs_count{
routeId="mcp-server",
namespace=~"$namespace"
}[$__rate_interval])
)
```
## Troubleshooting
The scrape target may not be up, or no MCP traffic has occurred yet.
Verify with `up{job="fusion-api-gateway"}` and check that the `/mcp` endpoint is in use.
Confirm `gateway_request_time_secs_bucket` series exist.
Some scrape pipelines drop histogram buckets via a `keep`/`drop` relabel rule — make sure `_bucket` series are retained.
`gateway_request_time_secs` is measured in **seconds**; the dashboard multiplies by 1000 to display milliseconds.
If you have locked down the actuator endpoint, ensure your Prometheus scrape provides the necessary credentials.
## Notes
* This dashboard measures MCP usage at the **gateway**, which is the cleanest signal for request volume, status, and latency.
It does **not** break usage down per MCP **tool** (such as `search_documents`, `get_document`) — that would require additional instrumentation in the MCP server.
* The same metric (`spring_cloud_gateway_requests_seconds`) is also emitted by the gateway as a Micrometer summary; this guide uses the `gateway_request_time_secs` histogram because it supports latency percentiles.
## Related topics
* [Lucidworks MCP Server overview](/docs/5/fusion/getting-data-out/mcp)
### Overview metrics
| Panel | Description |
| ---------------------- | ---------------------------------------------------------------------------------------------------------------------------- |
| **Total MCP Requests** | Total MCP calls over the selected range |
| **Request Rate** | Current throughput in requests per second |
| **Error Rate** | Percent of MCP requests that failed with 4xx or 5xx status codes; green (less than 1%), yellow (1-5%), red (greater than 5%) |
| **Avg Latency** | Average MCP response time in milliseconds |
### Latency metrics
| Panel | Description |
| --------------------------- | --------------------------------------------------------- |
| **MCP Latency Percentiles** | p50, p95, and p99 latency distribution from the histogram |
| **Average Latency** | Average response time over time |
### Traffic metrics and errors
| Panel | Description |
| ----------------------------------- | ---------------------------------------------------- |
| **MCP Request Rate by Status Code** | Throughput split by HTTP status code |
| **Error Rate** | Failure percentage over time |
| **Requests by Outcome** | Success versus client and server error breakdown |
| **Total MCP Requests Over Time** | Single-line graph showing total request volume trend |
## PromQL query examples
Use these queries to build custom dashboard panels or understand what powers each panel in the imported dashboard.
Replace `$namespace` with your Kubernetes namespace or use `.*` to match all namespaces.
```promql theme={"dark"}
sum(increase(gateway_request_time_secs_count{
routeId="mcp-server",
namespace=~"$namespace"
}[$__range]))
```
```promql theme={"dark"}
sum(increase(gateway_request_time_secs_count{
routeId="mcp-server",
namespace=~"$namespace"
}[$__interval]))
```
```promql theme={"dark"}
sum(rate(gateway_request_time_secs_count{
routeId="mcp-server",
namespace=~"$namespace"
}[$__rate_interval]))
```
```promql theme={"dark"}
100 * (
sum(rate(gateway_request_time_secs_count{
routeId="mcp-server",
namespace=~"$namespace",
outcome=~"CLIENT_ERROR|SERVER_ERROR"
}[$__rate_interval])) or vector(0)
) / sum(rate(gateway_request_time_secs_count{
routeId="mcp-server",
namespace=~"$namespace"
}[$__rate_interval]))
```
```promql theme={"dark"}
1000 * sum(rate(gateway_request_time_secs_sum{
routeId="mcp-server",
namespace=~"$namespace"
}[$__rate_interval])) / sum(rate(gateway_request_time_secs_count{
routeId="mcp-server",
namespace=~"$namespace"
}[$__rate_interval]))
```
```promql theme={"dark"}
1000 * histogram_quantile(0.50, sum by (le) (
rate(gateway_request_time_secs_bucket{
routeId="mcp-server",
namespace=~"$namespace"
}[$__rate_interval])
))
```
```promql theme={"dark"}
1000 * histogram_quantile(0.95, sum by (le) (
rate(gateway_request_time_secs_bucket{
routeId="mcp-server",
namespace=~"$namespace"
}[$__rate_interval])
))
```
```promql theme={"dark"}
1000 * histogram_quantile(0.99, sum by (le) (
rate(gateway_request_time_secs_bucket{
routeId="mcp-server",
namespace=~"$namespace"
}[$__rate_interval])
))
```
```promql theme={"dark"}
sum by (httpStatusCode) (
rate(gateway_request_time_secs_count{
routeId="mcp-server",
namespace=~"$namespace"
}[$__rate_interval])
)
```
## Troubleshooting
The scrape target may not be up, or no MCP traffic has occurred yet.
Verify with `up{job="fusion-api-gateway"}` and check that the `/mcp` endpoint is in use.
Confirm `gateway_request_time_secs_bucket` series exist.
Some scrape pipelines drop histogram buckets via a `keep`/`drop` relabel rule — make sure `_bucket` series are retained.
`gateway_request_time_secs` is measured in **seconds**; the dashboard multiplies by 1000 to display milliseconds.
If you have locked down the actuator endpoint, ensure your Prometheus scrape provides the necessary credentials.
## Notes
* This dashboard measures MCP usage at the **gateway**, which is the cleanest signal for request volume, status, and latency.
It does **not** break usage down per MCP **tool** (such as `search_documents`, `get_document`) — that would require additional instrumentation in the MCP server.
* The same metric (`spring_cloud_gateway_requests_seconds`) is also emitted by the gateway as a Micrometer summary; this guide uses the `gateway_request_time_secs` histogram because it supports latency percentiles.
## Related topics
* [Lucidworks MCP Server overview](/docs/5/fusion/getting-data-out/mcp)