> ## Documentation Index
> Fetch the complete documentation index at: https://doc.lucidworks.com/llms.txt
> Use this file to discover all available pages before exploring further.
# Built-in Dashboards
export const LwTemplate = ({title = "Key questions to get you started", icon = "sparkles", cta = "Powered by Agent Studio", linkHref = "https://lucidworks.com/demo/?utm_source=docs&utm_medium=referral&utm_campaign=docs_cta_ai"}) => {
const [isLoaded, setIsLoaded] = useState(false);
useEffect(() => {
const timer = setTimeout(() => {
setIsLoaded(true);
}, 500);
return () => clearTimeout(timer);
}, []);
return
{isLoaded && `
}} />}
Powered by Lucidworks Agent Studio
;
};
export const InlineImage = ({src, alt = '', height = '2em'}) => {
return ;
};
[localhost link]: http://localhost:3000/docs/5/fusion/operations/monitoring-and-reporting/banana-dashboards/built-in-dashboards
[mintlify link]: https://doc.lucidworks.com/docs/5/fusion/operations/monitoring-and-reporting/banana-dashboards/built-in-dashboards
[old doc.lw link]: https://doc.lucidworks.com/fusion/5.9/140
Fusion ships with built-in dashboards. To access these dashboards from the Fusion UI, click **Analytics > Dashboards**.
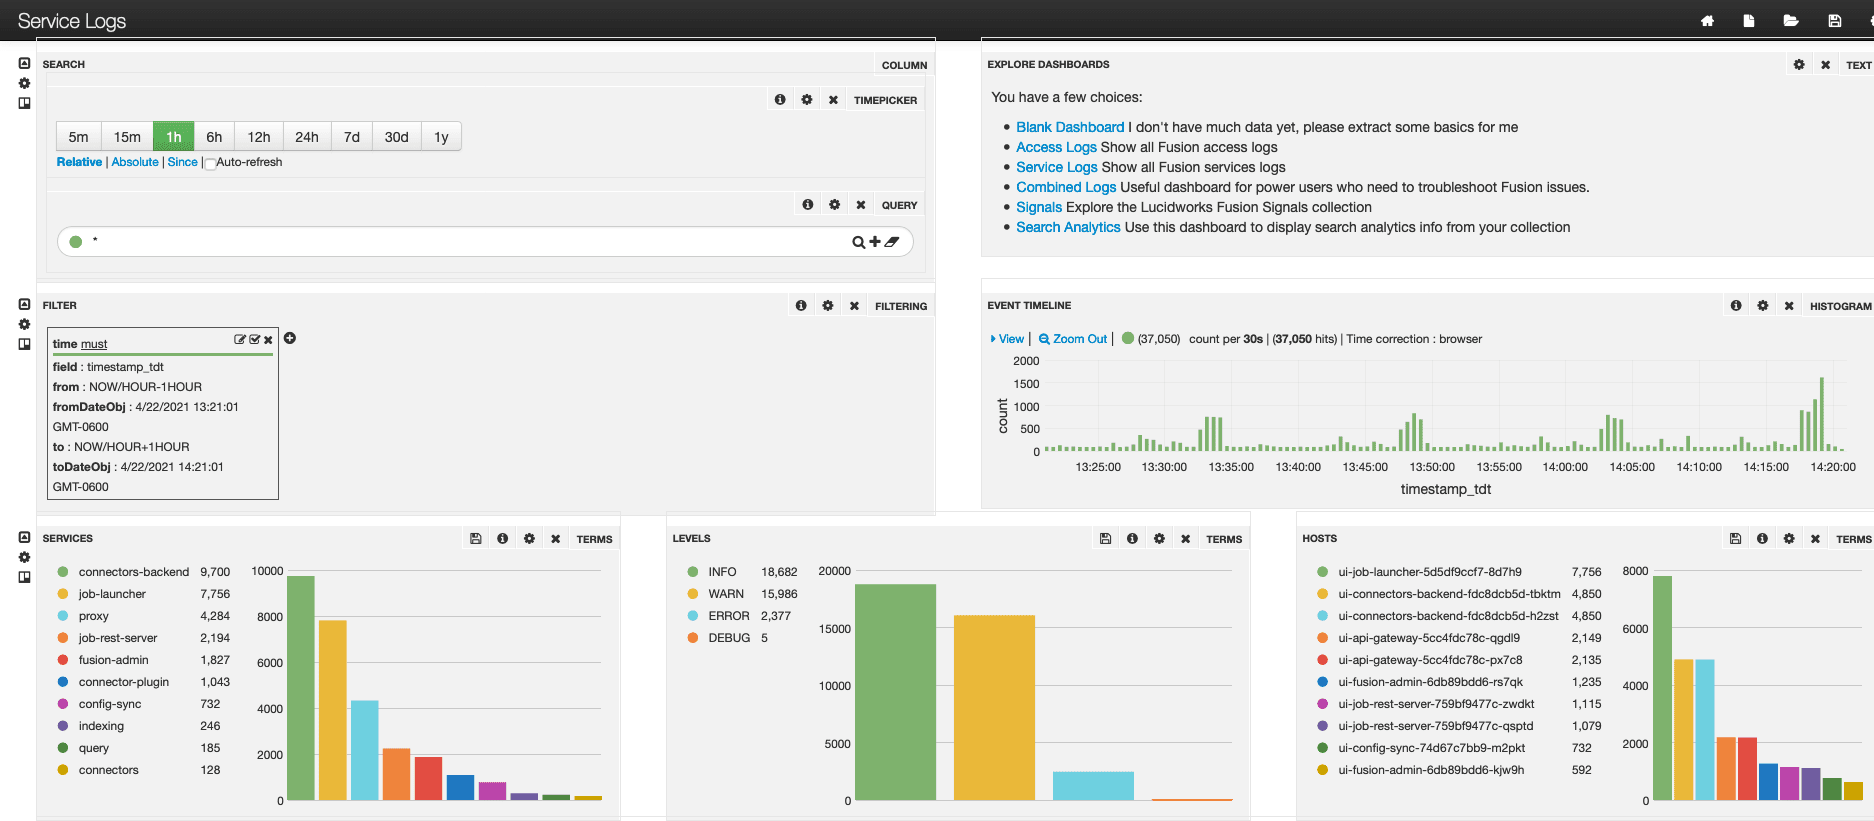
## Service Logs dashboard
The Service Logs dashboard (`lucidworks-service-logs.json`) is also the **default** dashboard (`default.json`).
You can modify the default dashboard to suit your needs. To set a different dashboard as the browser default, click the dashboard you want to set as the default, then click **Save > Set as Browser Default**.
To open the default dashboard from the Fusion workspace, click Analytics > **Dashboards** or System > **Log Viewer**. Alternatively, on any dashboard, click **Goto saved default** .
## Combined Logs dashboard
The Combined Logs dashboard (`lucidworks-combined-logs.json`) lets you analyze all logs from the `system_logs` collection.
## Blank dashboard
An entirely blank dashboard (`blank.json`) is available. To open this dashboard from the default dashboard, click **Blank Dashboard** at the top right.
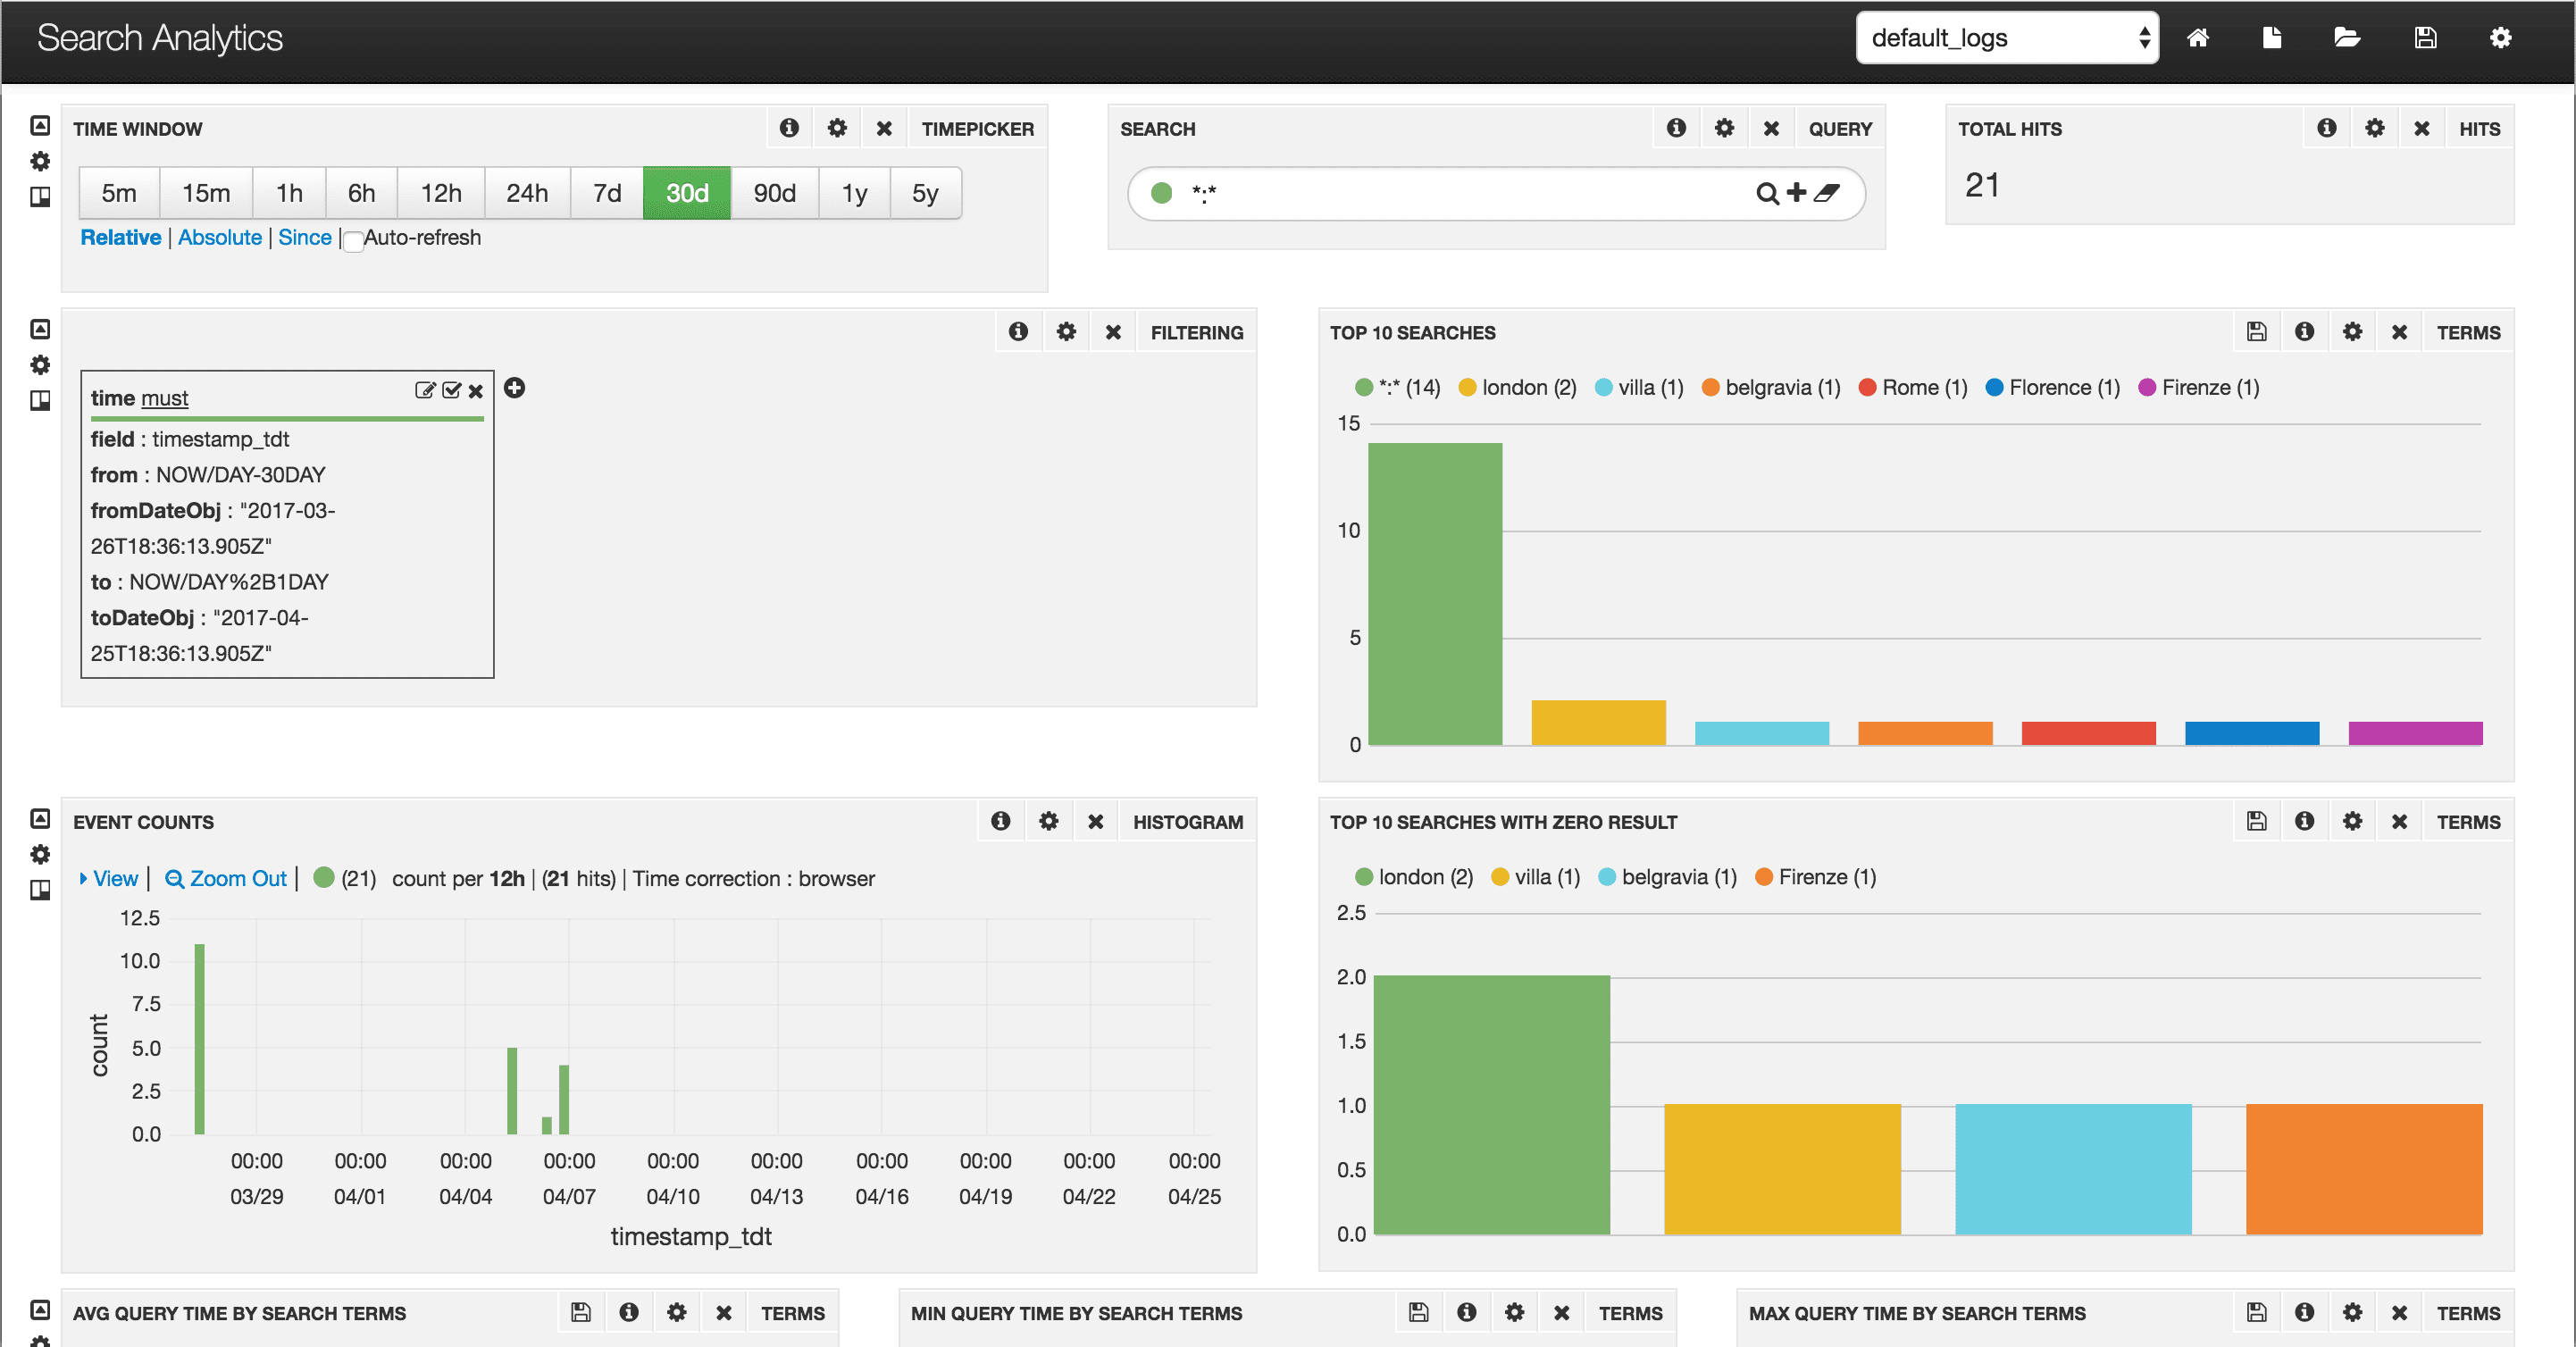
## Search Analytics dashboard
The Fusion Search Analytics dashboard (`lucidworks-searchanalytics.json`) displays search analytics derived from collection logs and from queries to Solr (`/api/solr`).
To open the Search Analytics dashboard from the default dashboard, click **Search Analytics** at the top right.
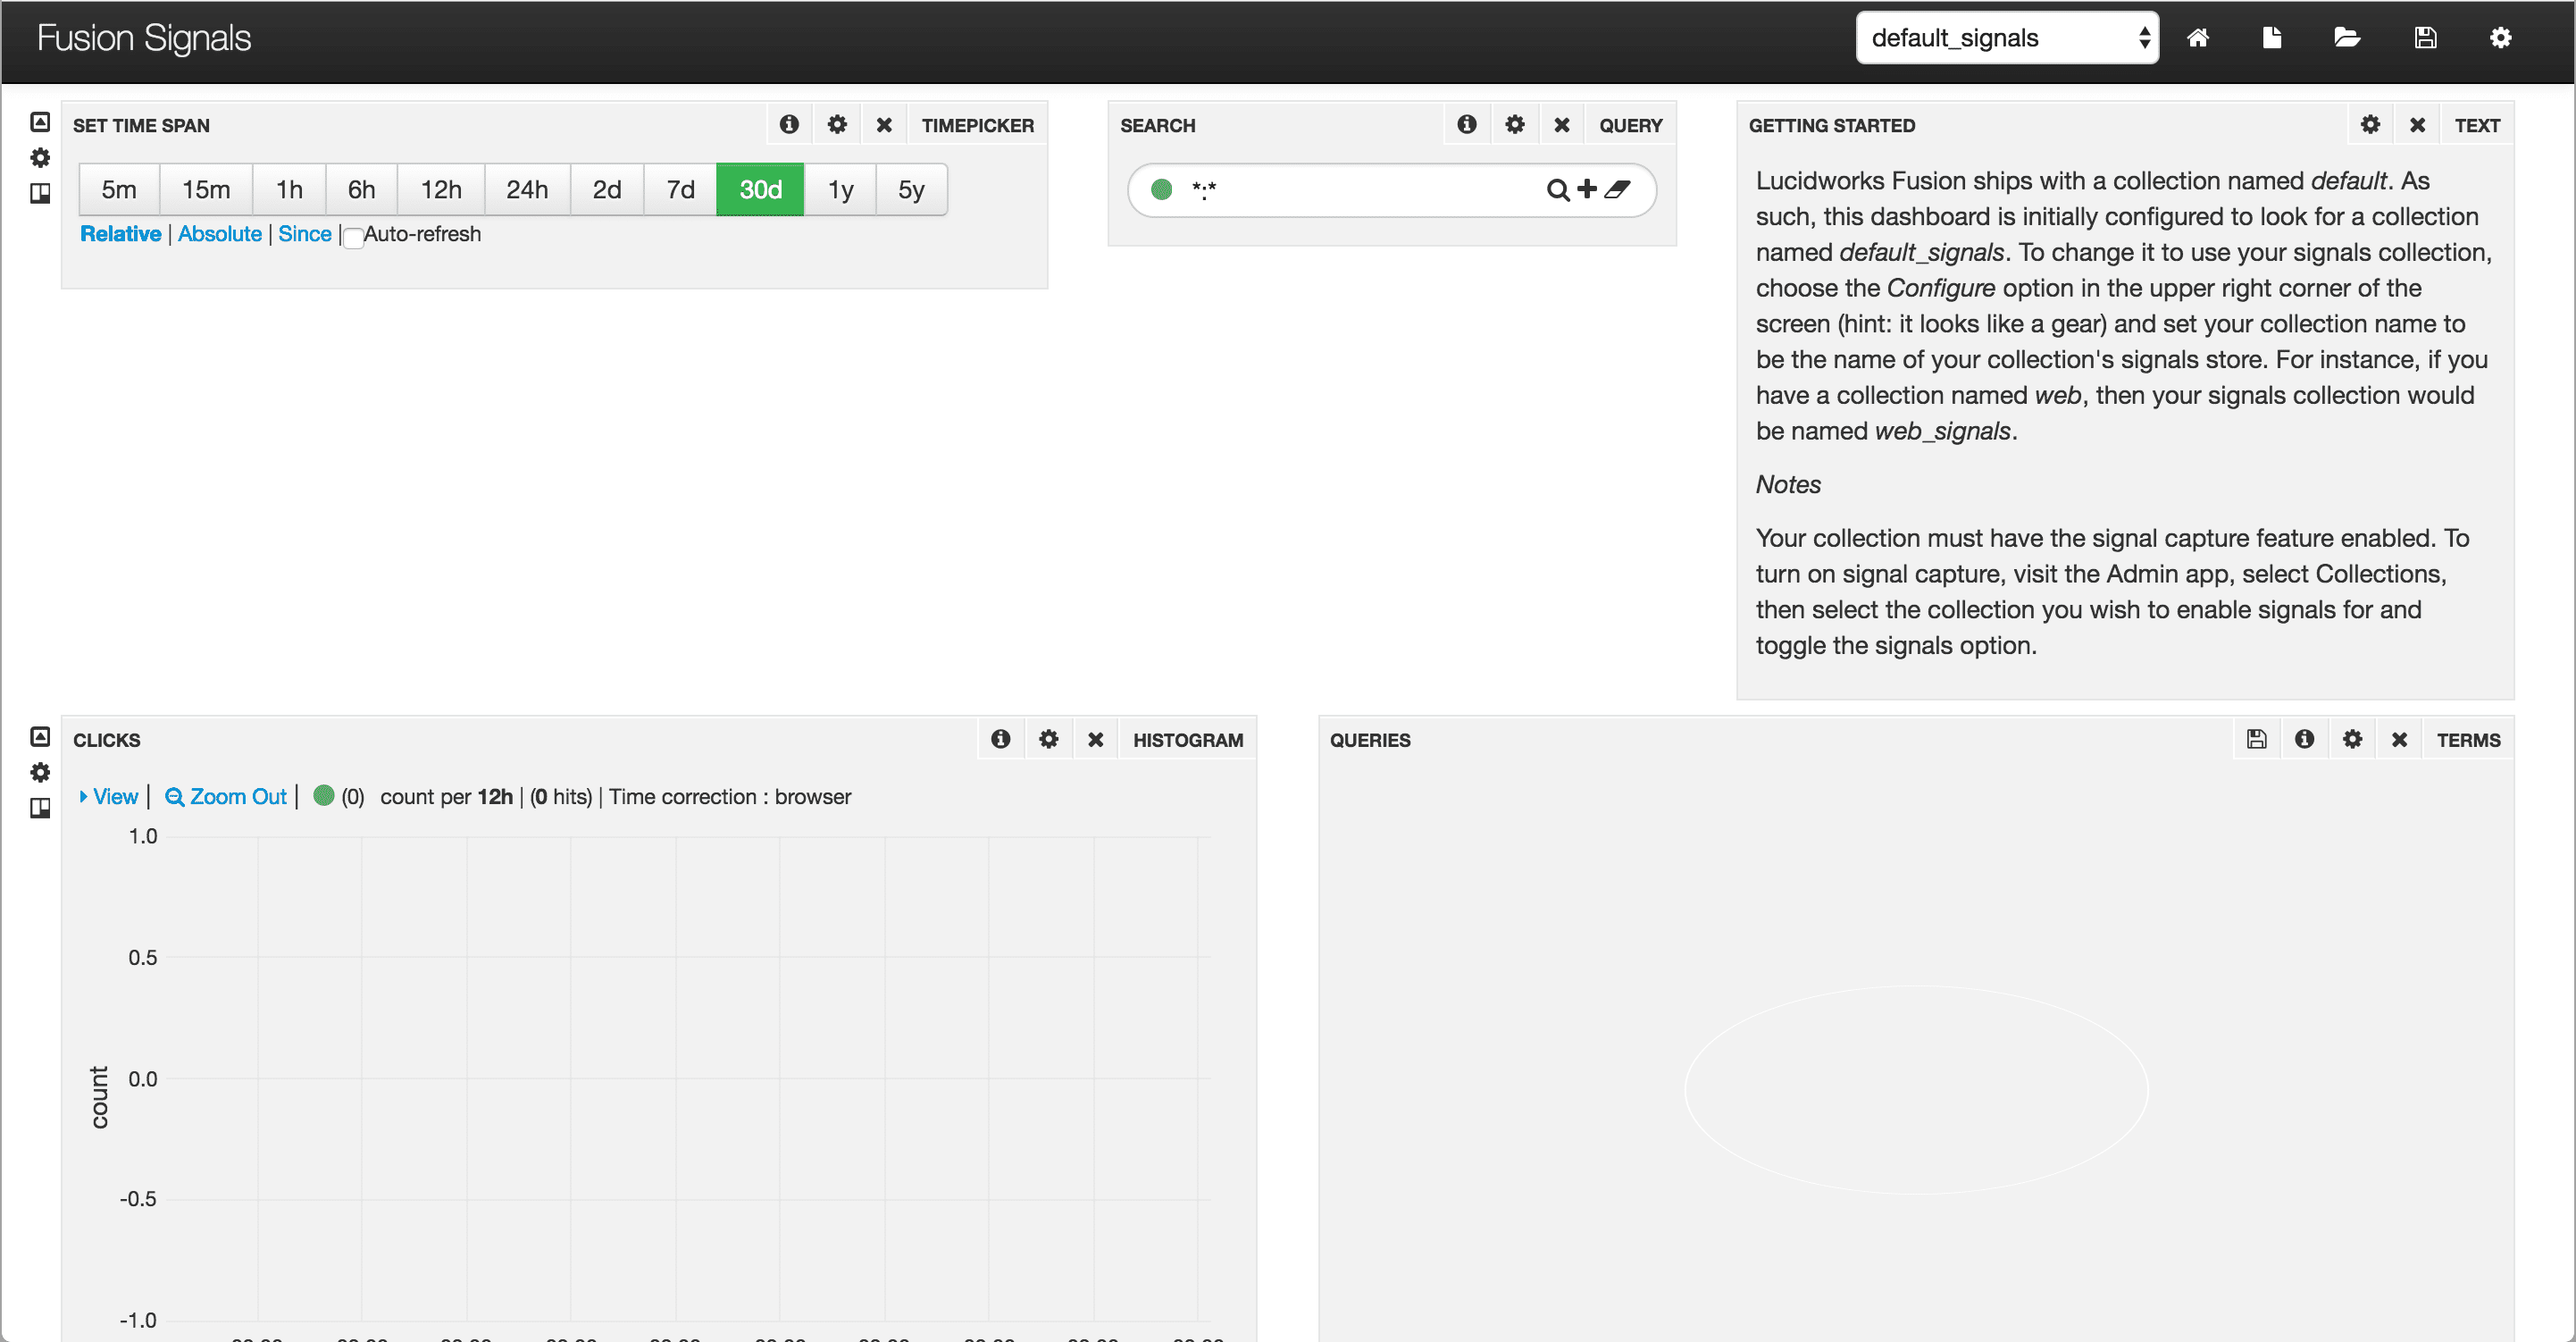
## Fusion Signals dashboard
The Fusion Signals dashboard (`lucidworks-signals.json`) is a time-series dashboard that you can use to monitor signals collections. It uses the signal timestamp as the time field.
To open the Fusion Signals dashboard from the default dashboard, click **Lucidworks Fusion Signals** at the top right.
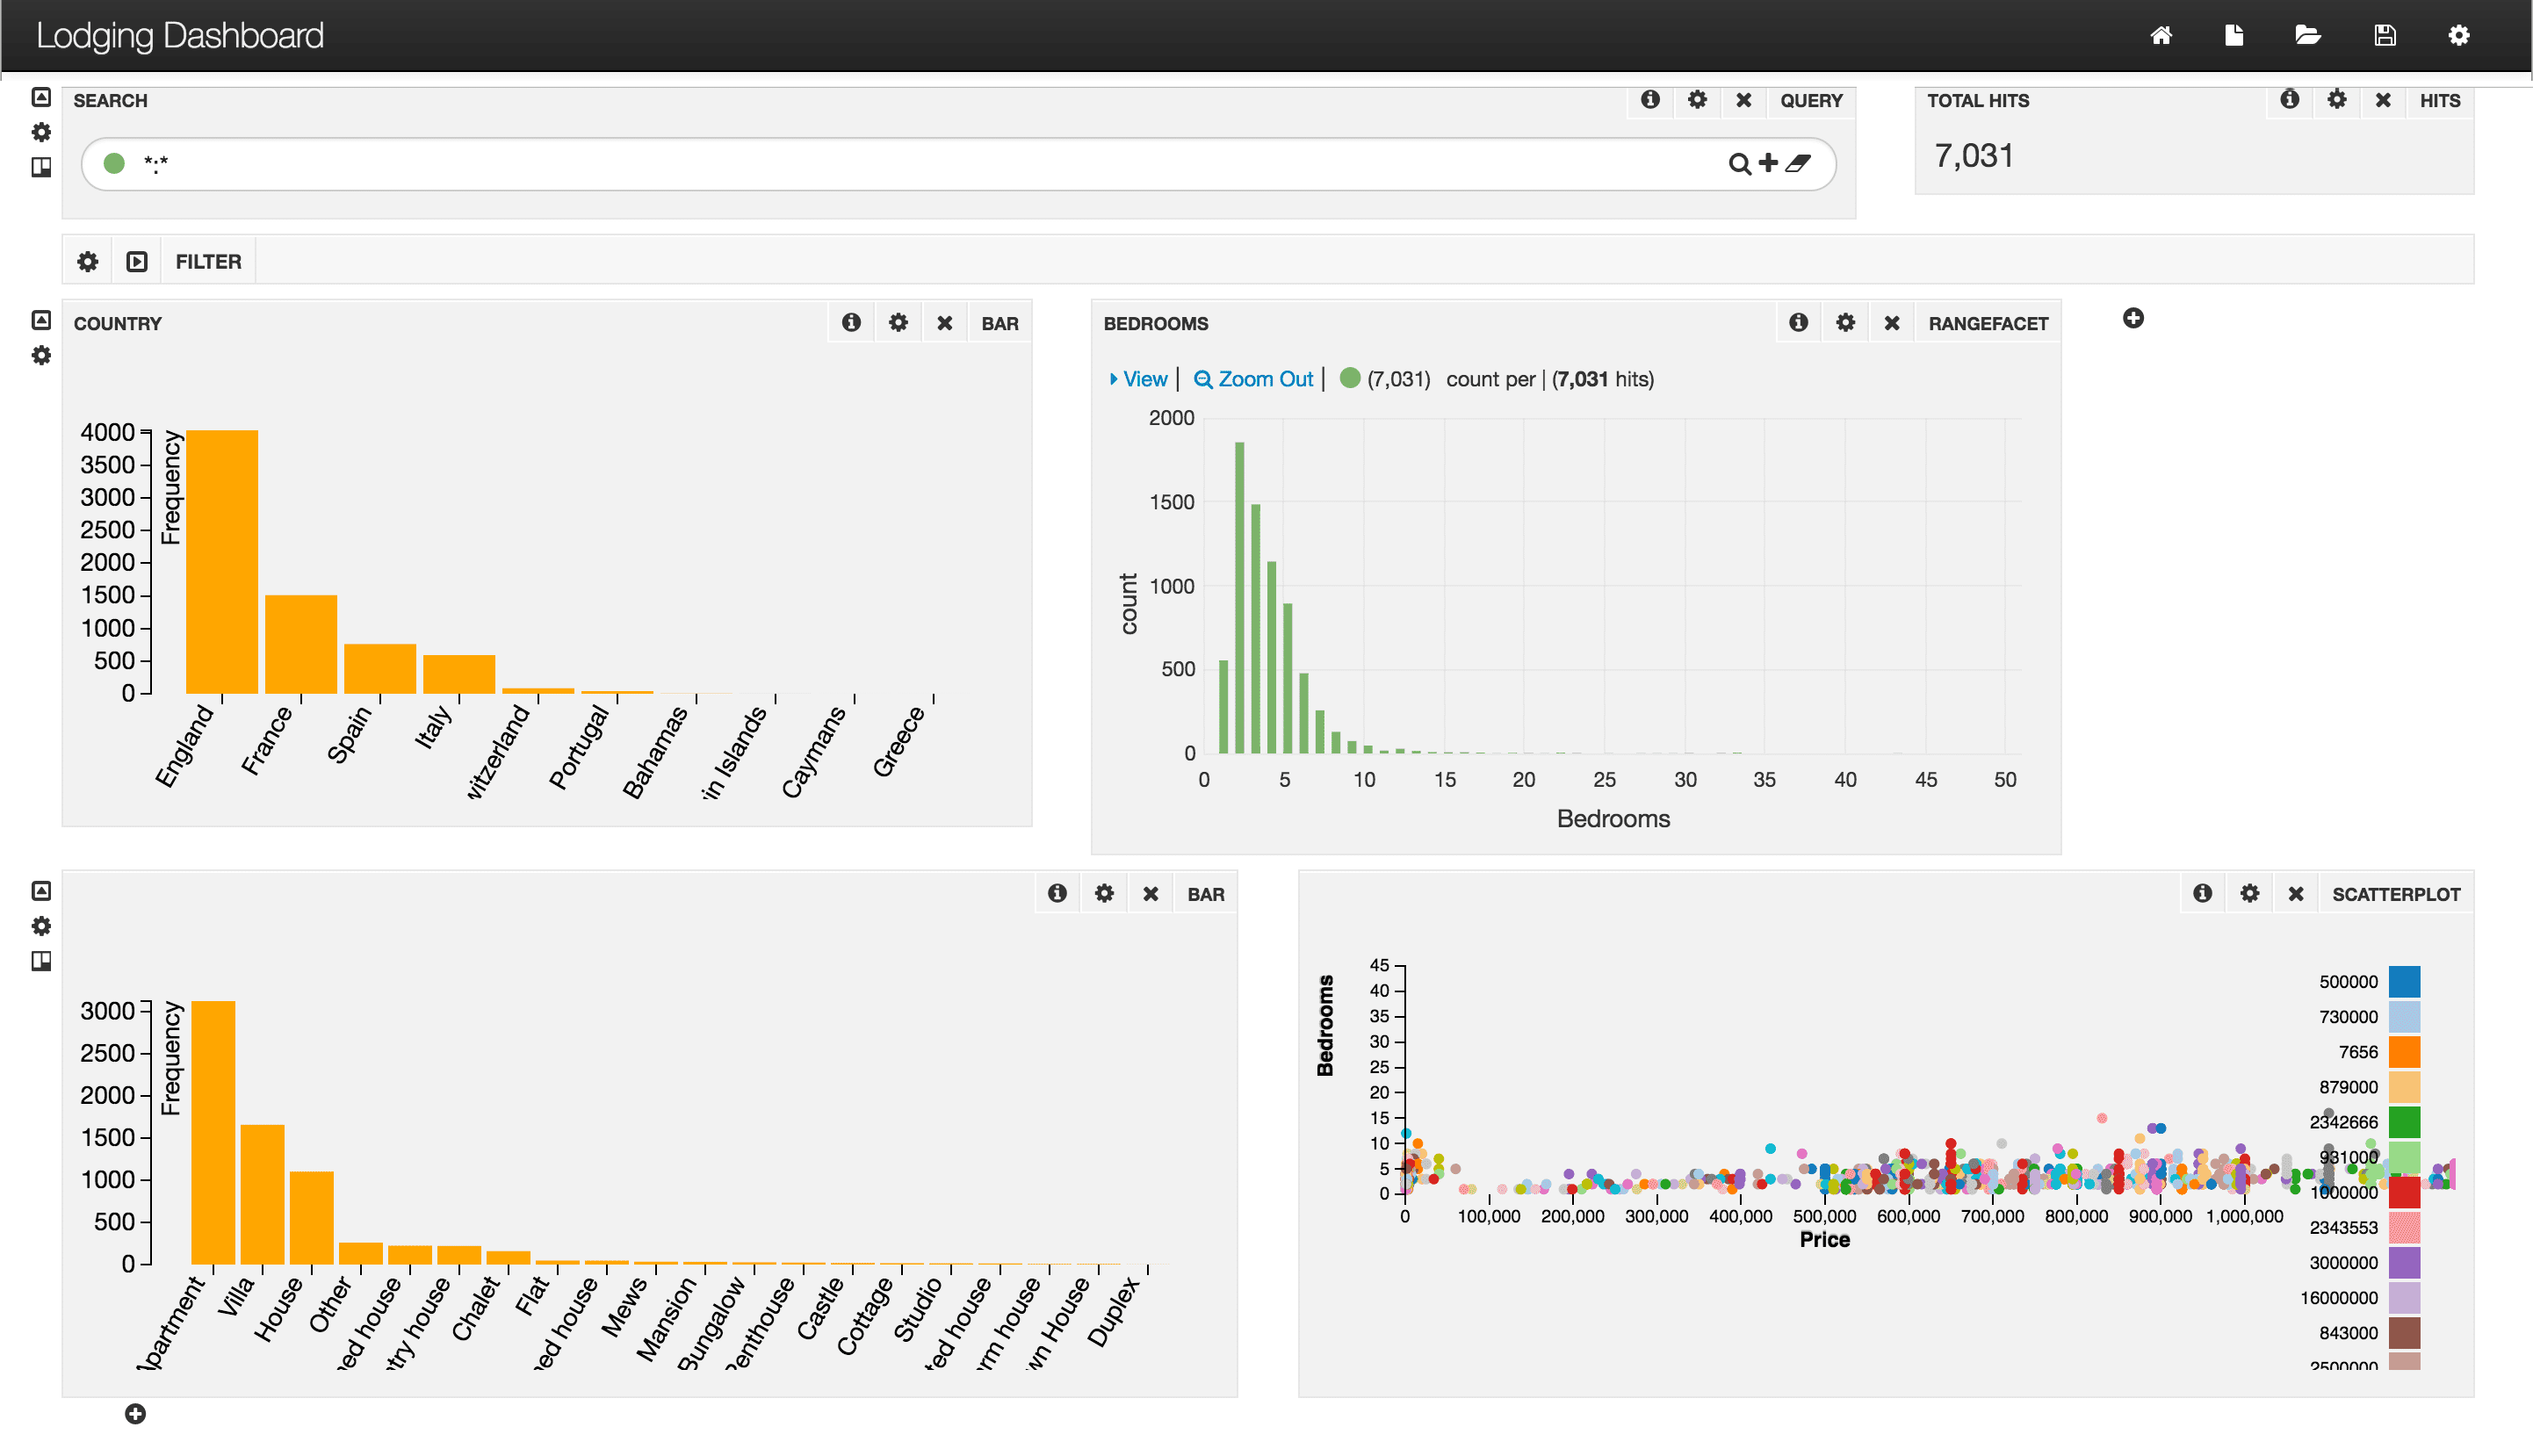
## Default Non-Time-Series dashboard
Fusion includes a default non-time-series dashboard (`default-nts.json`). This is an example:
To open the default non-time-series dashboard, at the top right of any dashboard, click **New > Non-time-series dashboard**.
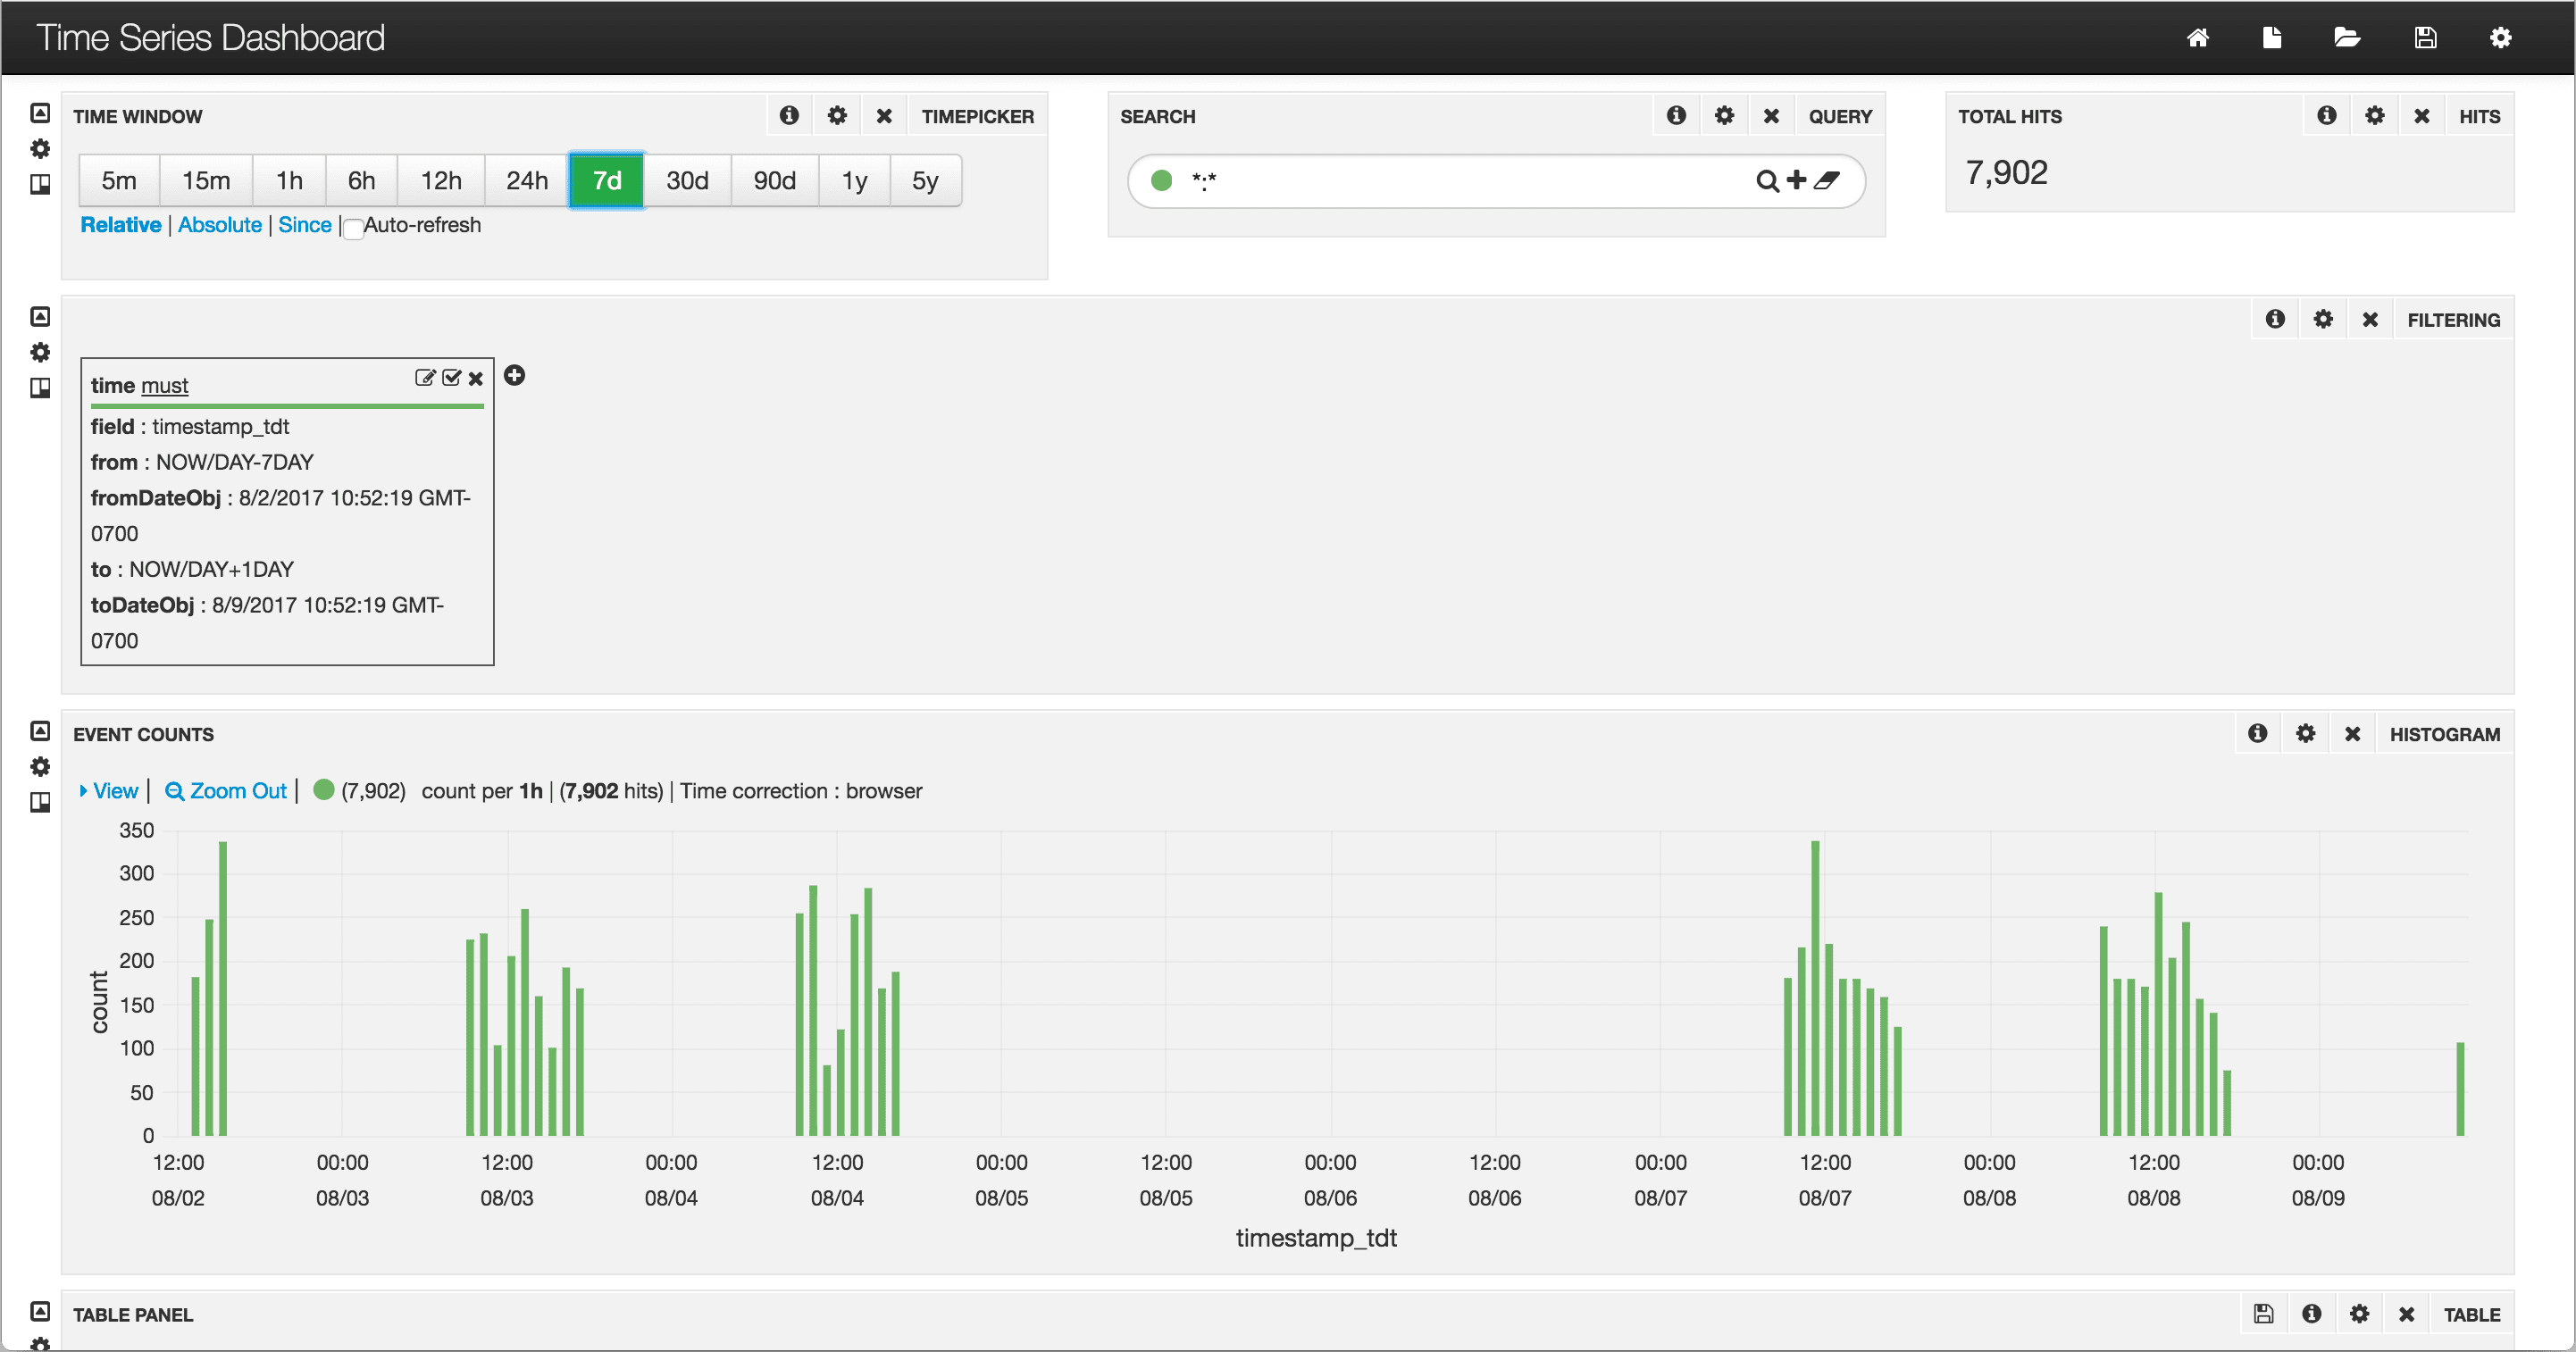
## Default Time-Series dashboard
Fusion includes a default time-series dashboard (`default-ts.json`). This is an example:
To open the default time-series dashboard, at the top right of any dashboard, click **New > Time-series dashboard**.
 You can modify the default dashboard to suit your needs. To set a different dashboard as the browser default, click the dashboard you want to set as the default, then click **Save > Set as Browser Default**.
To open the default dashboard from the Fusion workspace, click Analytics
You can modify the default dashboard to suit your needs. To set a different dashboard as the browser default, click the dashboard you want to set as the default, then click **Save > Set as Browser Default**.
To open the default dashboard from the Fusion workspace, click Analytics 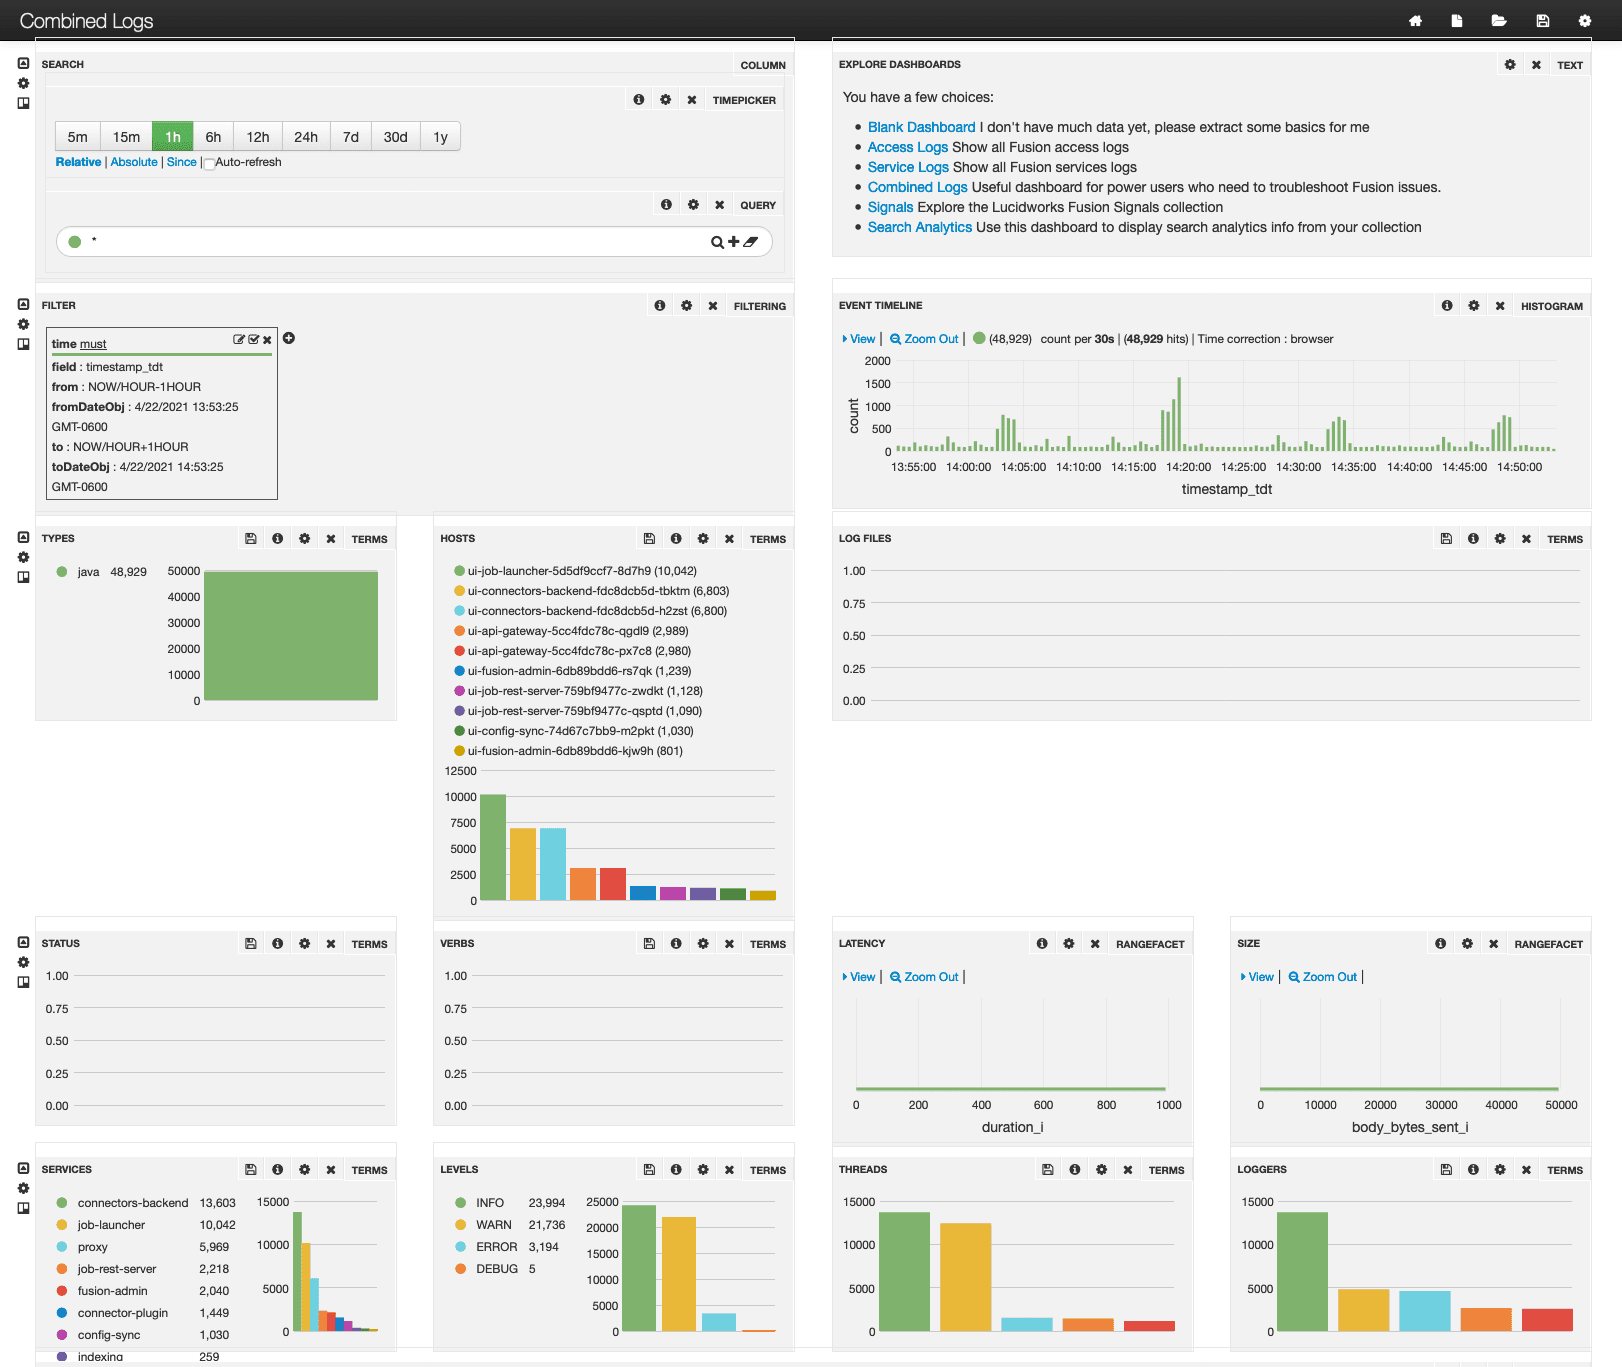 ## Blank dashboard
An entirely blank dashboard (`blank.json`) is available. To open this dashboard from the default dashboard, click **Blank Dashboard** at the top right.
## Search Analytics dashboard
The Fusion Search Analytics dashboard (`lucidworks-searchanalytics.json`) displays search analytics derived from collection logs and from queries to Solr (`/api/solr`).
## Blank dashboard
An entirely blank dashboard (`blank.json`) is available. To open this dashboard from the default dashboard, click **Blank Dashboard** at the top right.
## Search Analytics dashboard
The Fusion Search Analytics dashboard (`lucidworks-searchanalytics.json`) displays search analytics derived from collection logs and from queries to Solr (`/api/solr`).
 To open the Search Analytics dashboard from the default dashboard, click **Search Analytics** at the top right.
## Fusion Signals dashboard
The Fusion Signals dashboard (`lucidworks-signals.json`) is a time-series dashboard that you can use to monitor signals collections. It uses the signal timestamp as the time field.
To open the Search Analytics dashboard from the default dashboard, click **Search Analytics** at the top right.
## Fusion Signals dashboard
The Fusion Signals dashboard (`lucidworks-signals.json`) is a time-series dashboard that you can use to monitor signals collections. It uses the signal timestamp as the time field.
 To open the Fusion Signals dashboard from the default dashboard, click **Lucidworks Fusion Signals** at the top right.
## Default Non-Time-Series dashboard
Fusion includes a default non-time-series dashboard (`default-nts.json`). This is an example:
To open the Fusion Signals dashboard from the default dashboard, click **Lucidworks Fusion Signals** at the top right.
## Default Non-Time-Series dashboard
Fusion includes a default non-time-series dashboard (`default-nts.json`). This is an example:
 To open the default non-time-series dashboard, at the top right of any dashboard, click **New > Non-time-series dashboard**.
## Default Time-Series dashboard
Fusion includes a default time-series dashboard (`default-ts.json`). This is an example:
To open the default non-time-series dashboard, at the top right of any dashboard, click **New > Non-time-series dashboard**.
## Default Time-Series dashboard
Fusion includes a default time-series dashboard (`default-ts.json`). This is an example:
 To open the default time-series dashboard, at the top right of any dashboard, click **New > Time-series dashboard**.