> ## Documentation Index
> Fetch the complete documentation index at: https://doc.lucidworks.com/llms.txt
> Use this file to discover all available pages before exploring further.
# QQPlot
export const LwTemplate = ({title = "Key questions to get you started", icon = "sparkles", cta = "Powered by Agent Studio", linkHref = "https://lucidworks.com/demo/?utm_source=docs&utm_medium=referral&utm_campaign=docs_cta_ai"}) => {
const [isLoaded, setIsLoaded] = useState(false);
useEffect(() => {
const timer = setTimeout(() => {
setIsLoaded(true);
}, 500);
return () => clearTimeout(timer);
}, []);
return
{isLoaded && `
}} />}
Powered by Lucidworks Agent Studio
;
};
[localhost link]: http://localhost:3000/docs/4/fusion-server/reference/fusion-sql/qqplot
[mintlify link]: https://doc.lucidworks.com/docs/4/fusion-server/reference/fusion-sql/qqplot
[old doc.lw link]: https://doc.lucidworks.com/fusion-server/4.2/3268
The `qqplot` function calculates percentiles (1-99) for two sample sets, based on queries, so they can be compared visually. The `qqplot` function takes four parameters:
1. The numeric field for which to calculate the percentiles
2. The Lucene/Solr query for the sample set A
3. The Lucene/Solr query for the sample set B
4. The sample size for both sample sets
## Sample syntax
```sql wrap theme={"dark"}
select qqplot(sepal_width_d, "species_s:versicolor", "species_s:virginica", 150) as quantiles,
quantiles_estimate_a,
quantiles_estimate_b
from iris
```
## Result set
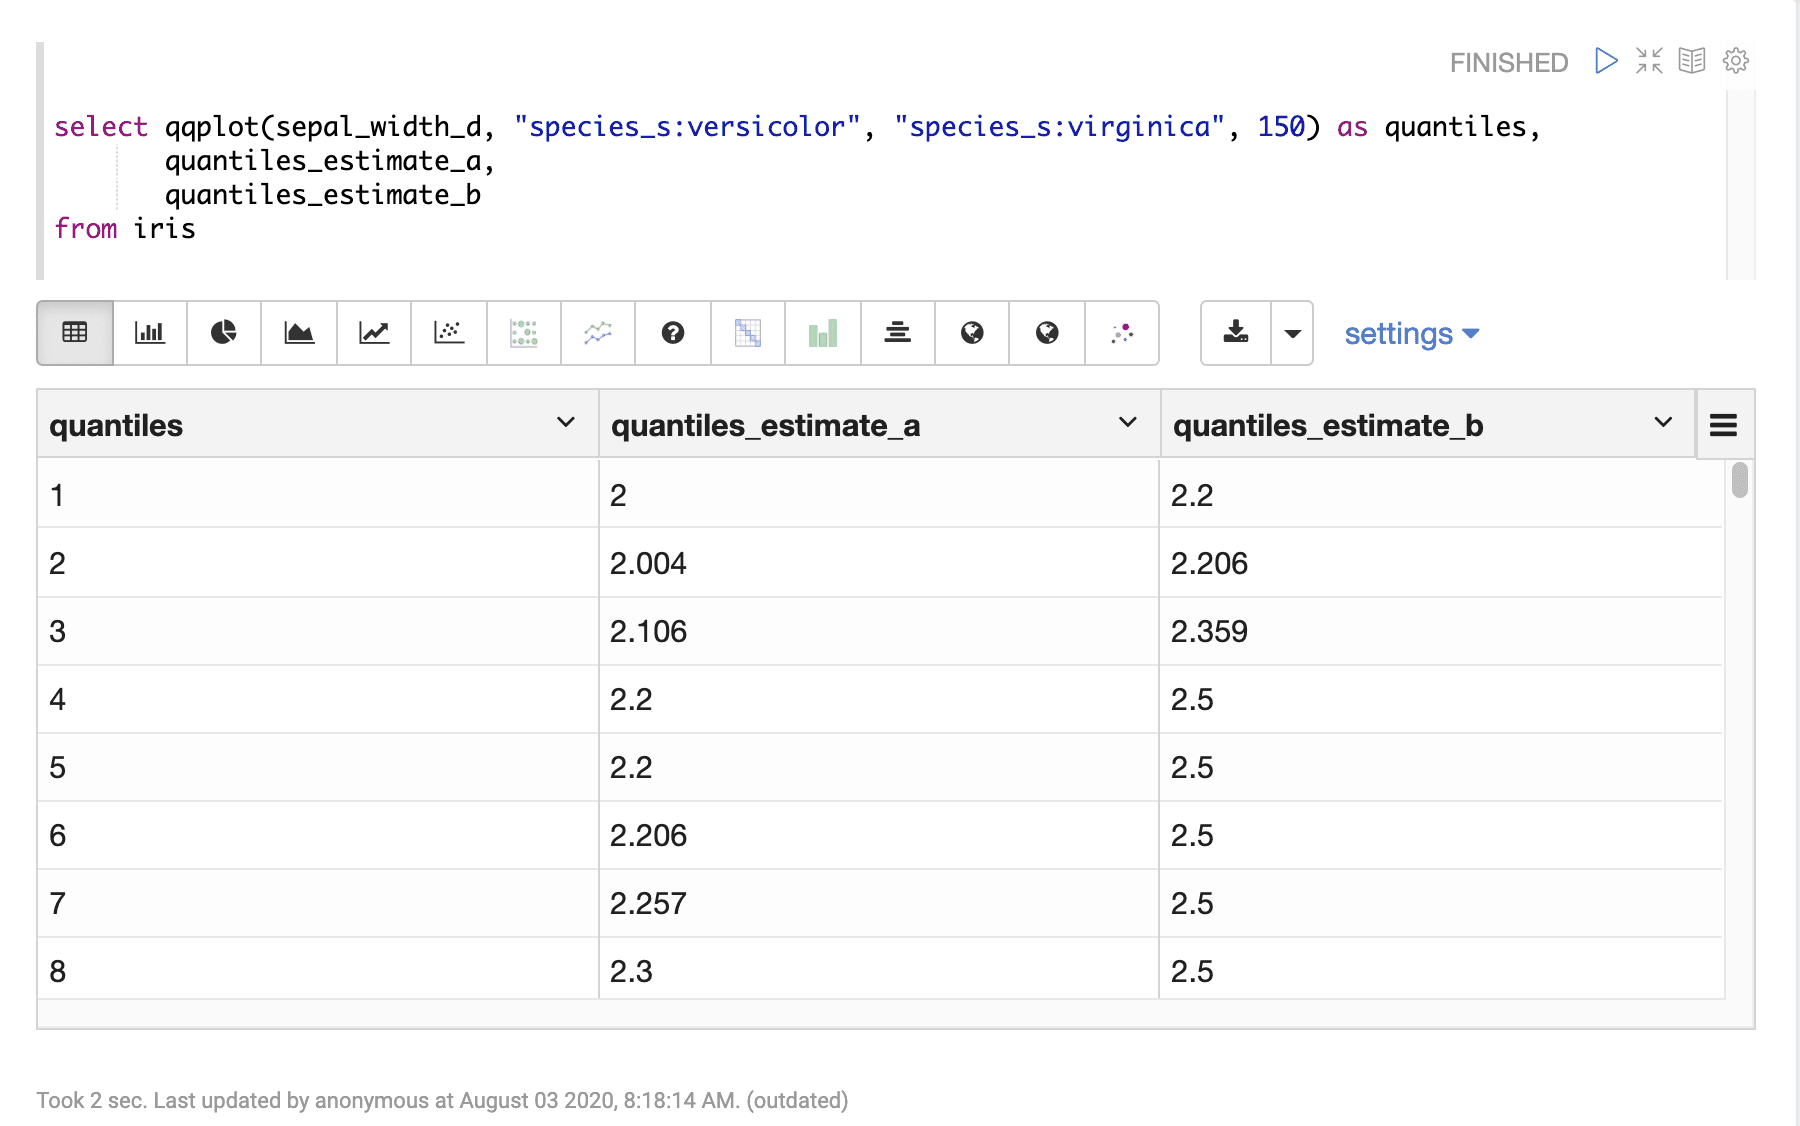
The result set for the `qqplot` function contains one row for each percentile 1-99. The `qqplot` function returns the percentile (1-99). The `quantiles_estimate_a` and `quantiles_estimate_b` fields contain the estimated percentile value, for sample sets A and B, at each percentile.
Sample result set in Apache Zeppelin
## Visualization
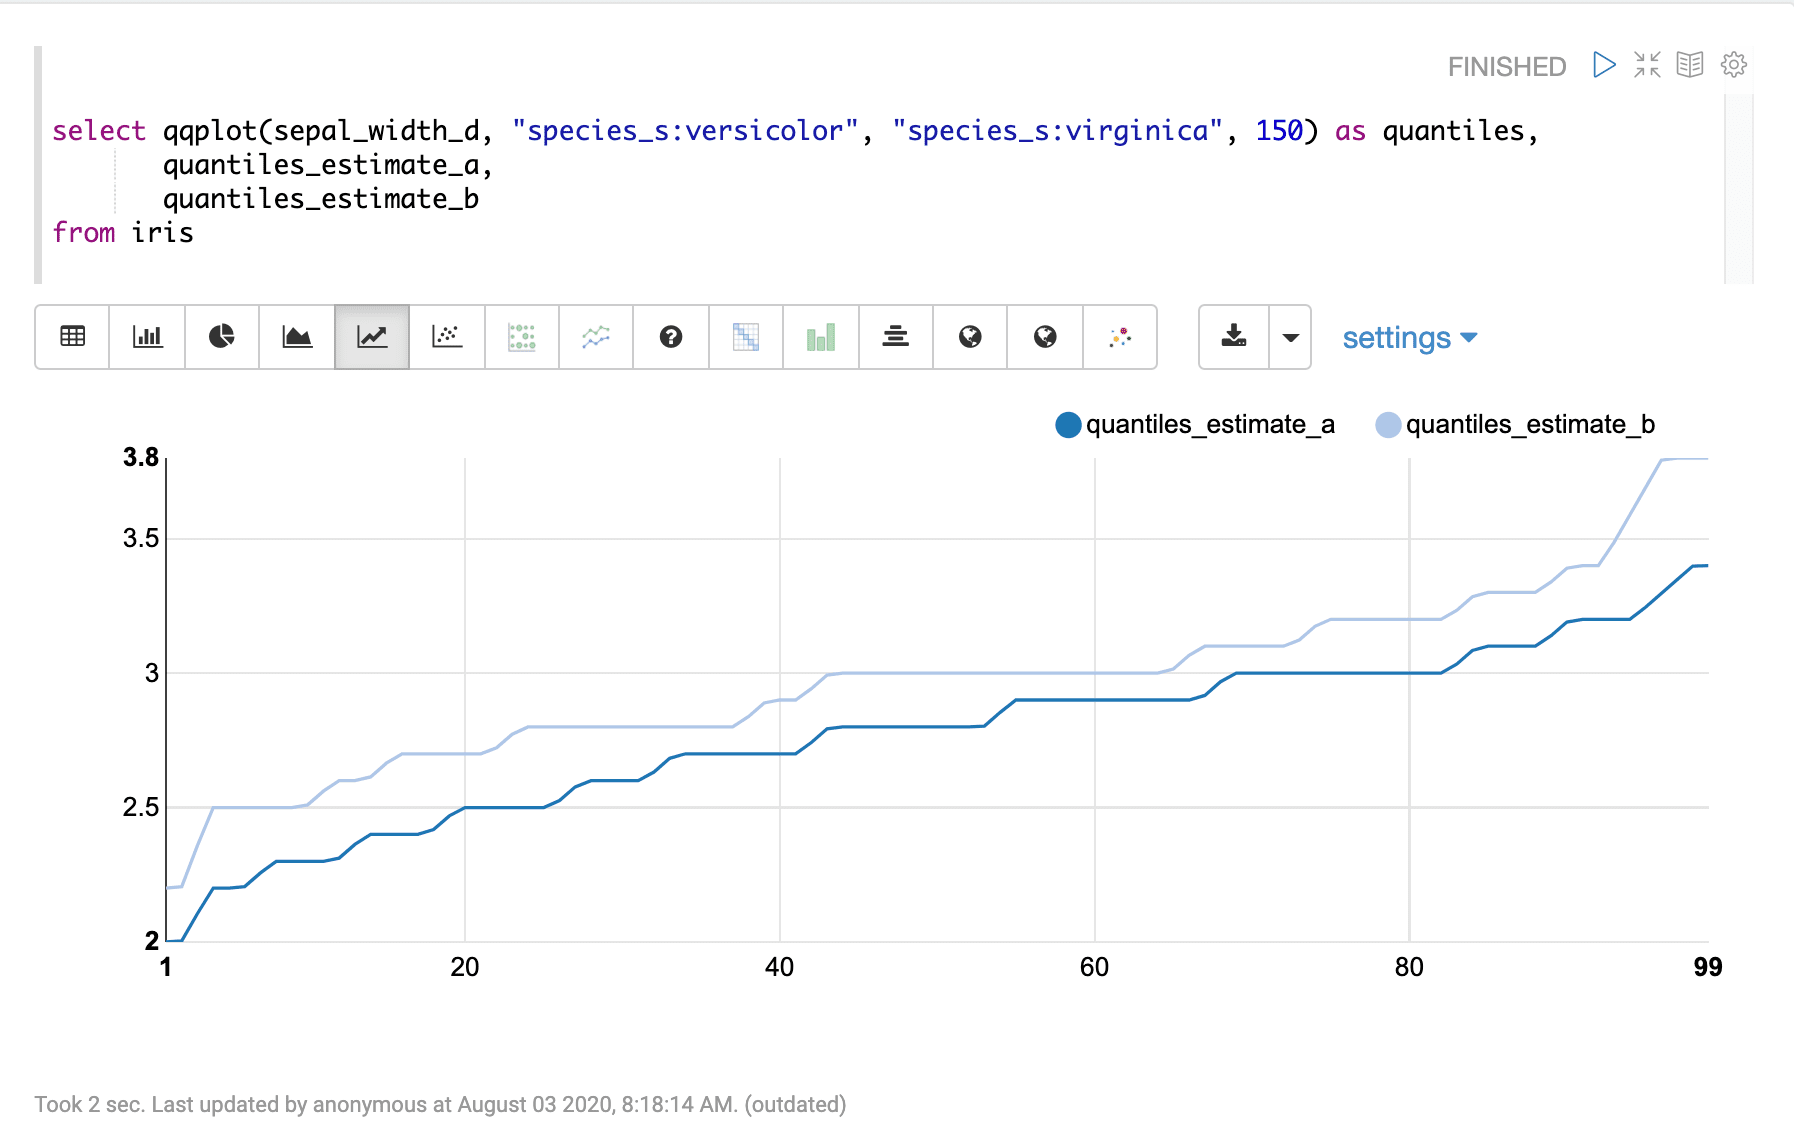
The qqplot function can be visualized by plotting the percentile (1-99) on the x-axis and the quantiles\_estimate\_a and quantiles\_estimate\_b columns on the y-axis.
Sample visualization of percentiles in Apache Zeppelin
 ## Visualization
The qqplot function can be visualized by plotting the percentile (1-99) on the x-axis and the quantiles\_estimate\_a and quantiles\_estimate\_b columns on the y-axis.
Sample visualization of percentiles in Apache Zeppelin
## Visualization
The qqplot function can be visualized by plotting the percentile (1-99) on the x-axis and the quantiles\_estimate\_a and quantiles\_estimate\_b columns on the y-axis.
Sample visualization of percentiles in Apache Zeppelin