> ## Documentation Index
> Fetch the complete documentation index at: https://doc.lucidworks.com/llms.txt
> Use this file to discover all available pages before exploring further.
# The DevOps Center
export const LwTemplate = ({title = "Key questions to get you started", icon = "sparkles", cta = "Powered by Agent Studio", linkHref = "https://lucidworks.com/demo/?utm_source=docs&utm_medium=referral&utm_campaign=docs_cta_ai"}) => {
const [isLoaded, setIsLoaded] = useState(false);
useEffect(() => {
const timer = setTimeout(() => {
setIsLoaded(true);
}, 500);
return () => clearTimeout(timer);
}, []);
return
{isLoaded && `
}} />}
Powered by Lucidworks Agent Studio
;
};
[localhost link]: http://localhost:3000/docs/4/fusion-server/concepts/system/devops-center
[mintlify link]: https://doc.lucidworks.com/docs/4/fusion-server/concepts/system/devops-center
[old doc.lw link]: https://doc.lucidworks.com/fusion/5.9/130
The DevOps Center is a suite of tools for monitoring, troubleshooting, and incident investigation. It consists of a set of dashboards and an interactive log viewer, providing views into this Fusion cluster’s hosts and services using metrics and events.
* Metrics come from the `system_monitor` collection.\
See [System Metrics](/docs/4/fusion-server/reference/system-metrics) for details about this collection.
* Events come from the `system_logs` collection.
You can **Export Data from the DevOps Center** all metrics and events for any selected time period.
The DevOps Center can export metrics and events in CSV format for the currently-selected time period. Exported metrics and events are useful for collaborating with other Fusion administrators, using third-party analysis tools, or sending troubleshooting data to the Lucidworks support team.
1. How to export data from the DevOps Center
2. In the Fusion UI, navigate to **System** > **DevOps Center** > **Log Viewer**.
3. Select the time period that is relevant to the incident you are interested in.
Log files will be exported according to the tab you are viewing.
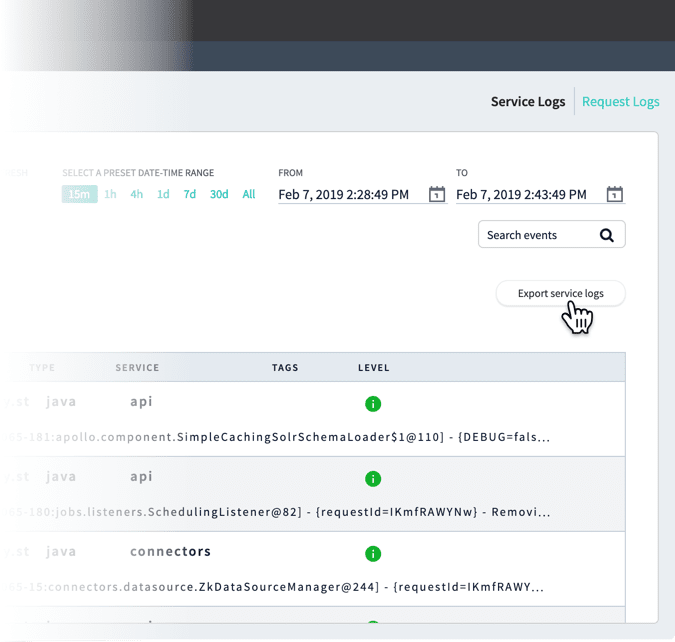
Click **Export service logs** in the Service Logs tab or **Export request logs** in the Request Logs tab to download a `.csv` file containing the logs (shown here with example timestamps):
* `serviceLogs[2019-02-07T22:28:49.000Z-2019-02-07T22:43:49.695Z].csv`
* `requestLogs[2019-02-07T22:28:49.000Z-2019-02-07T22:43:49.695Z].csv`
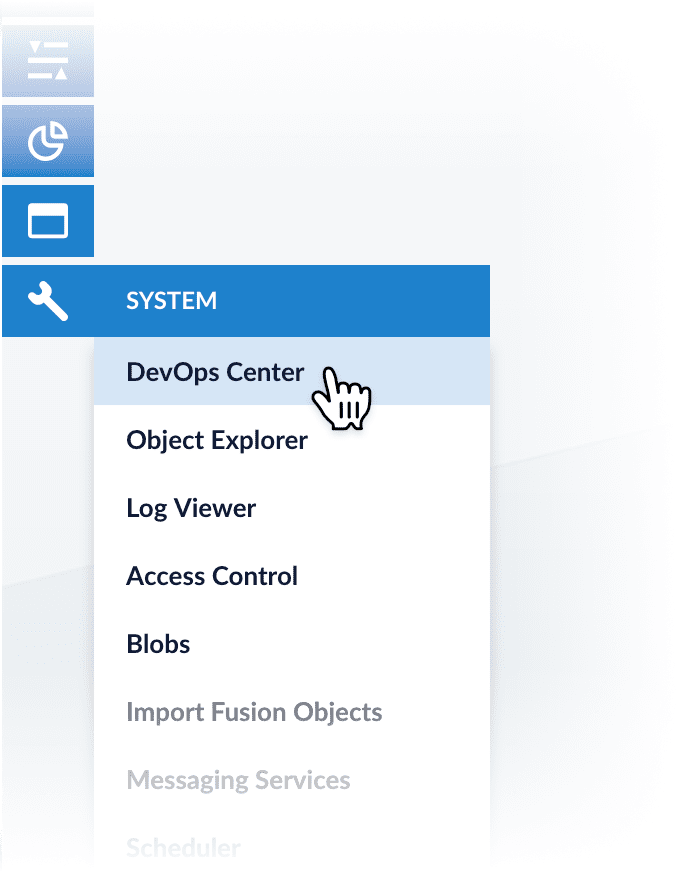
In any Fusion app, you can open the DevOps Center by navigating to **System** > **DevOps Center**:
In the DevOps Center, dates and times are local, as determined by your browser. In the [Log Viewer](#the-log-viewer), you can toggle between local time and UTC.
## System requirements
The DevOps Center is included as part of Fusion Server 4.2 and later. It requires the following:
* Your Web browser must support HTML5.
* Every node that you want to monitor must be running Fusion Server version 4.2.0 or later.
* Every node that you want to monitor must be running the `agent` and `log-shipper` services.
The DevOps Center is enabled by Fusion’s default configuration. If you find that the DevOps Center is not correctly populated with data, see [Troubleshooting](/docs/4/fusion-server/concepts/system/monitoring/cluster-monitoring).
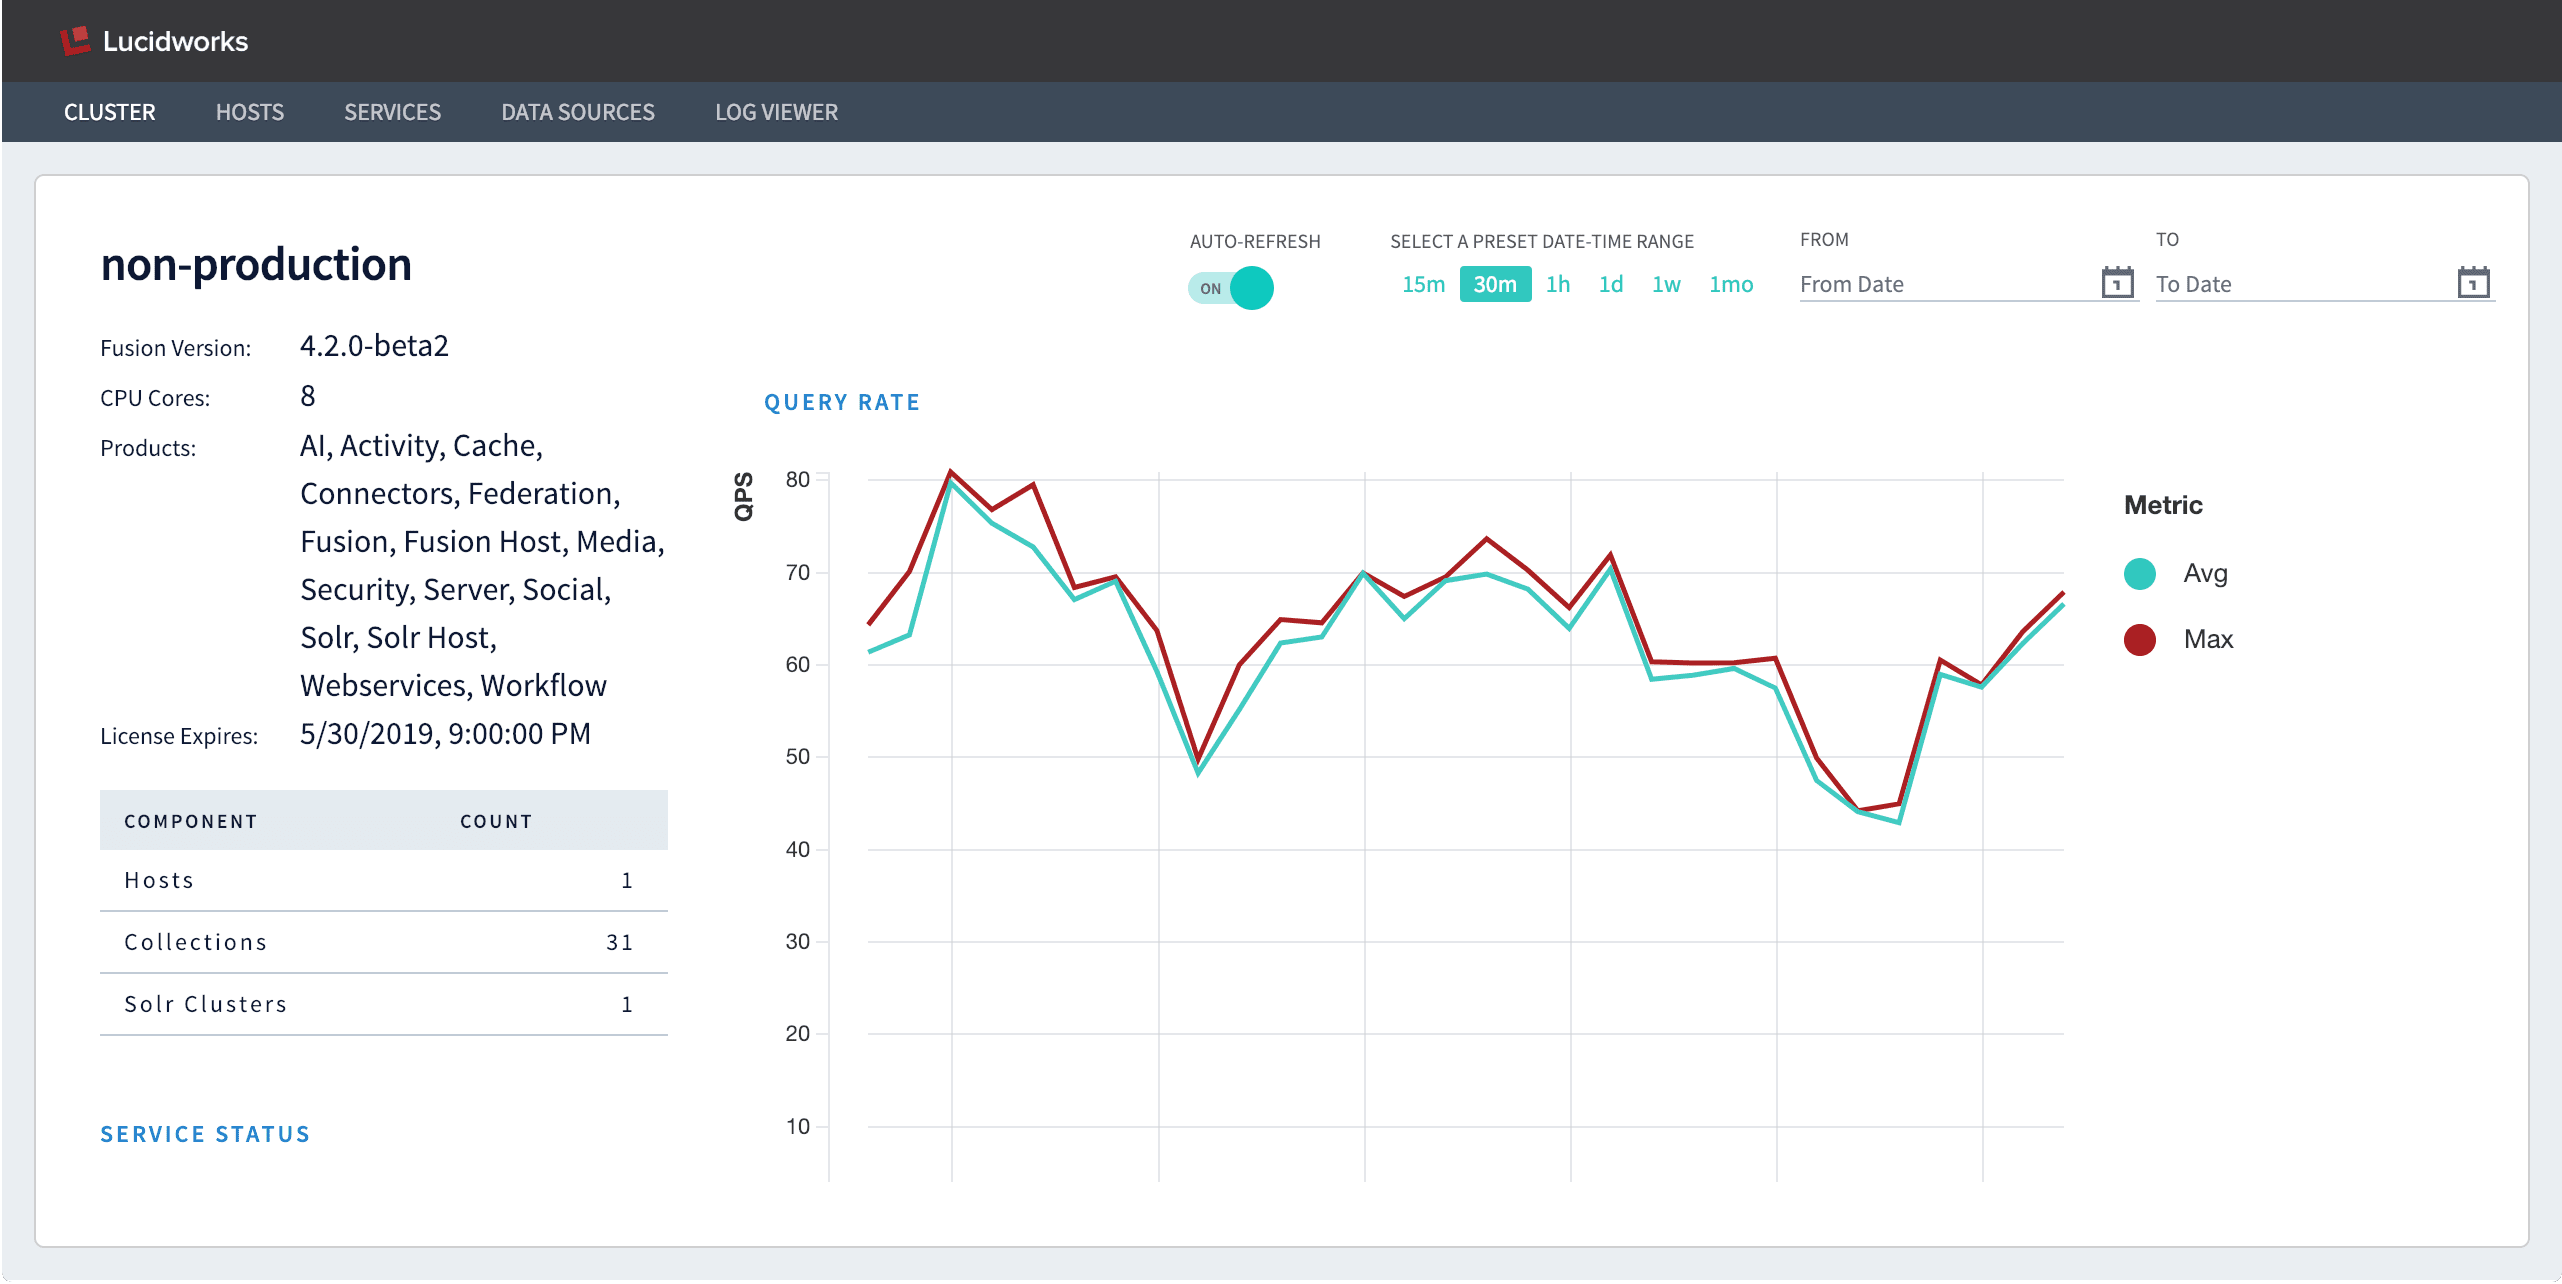
## Cluster dashboard
The first screen that displays is a high-level dashboard showing indicators of general health of your Fusion cluster.
The Cluster dashboard includes this data:
* Fusion [license](/docs/4/fusion-server/concepts/licensing) information
* The number of hosts, collections, and Solr clusters in this cluster
* The cluster’s service status
* Average and max values during the selected time interval for the following metrics:
* Query rate
* Response time
* Index size
* Indexing rate
* Active sessions
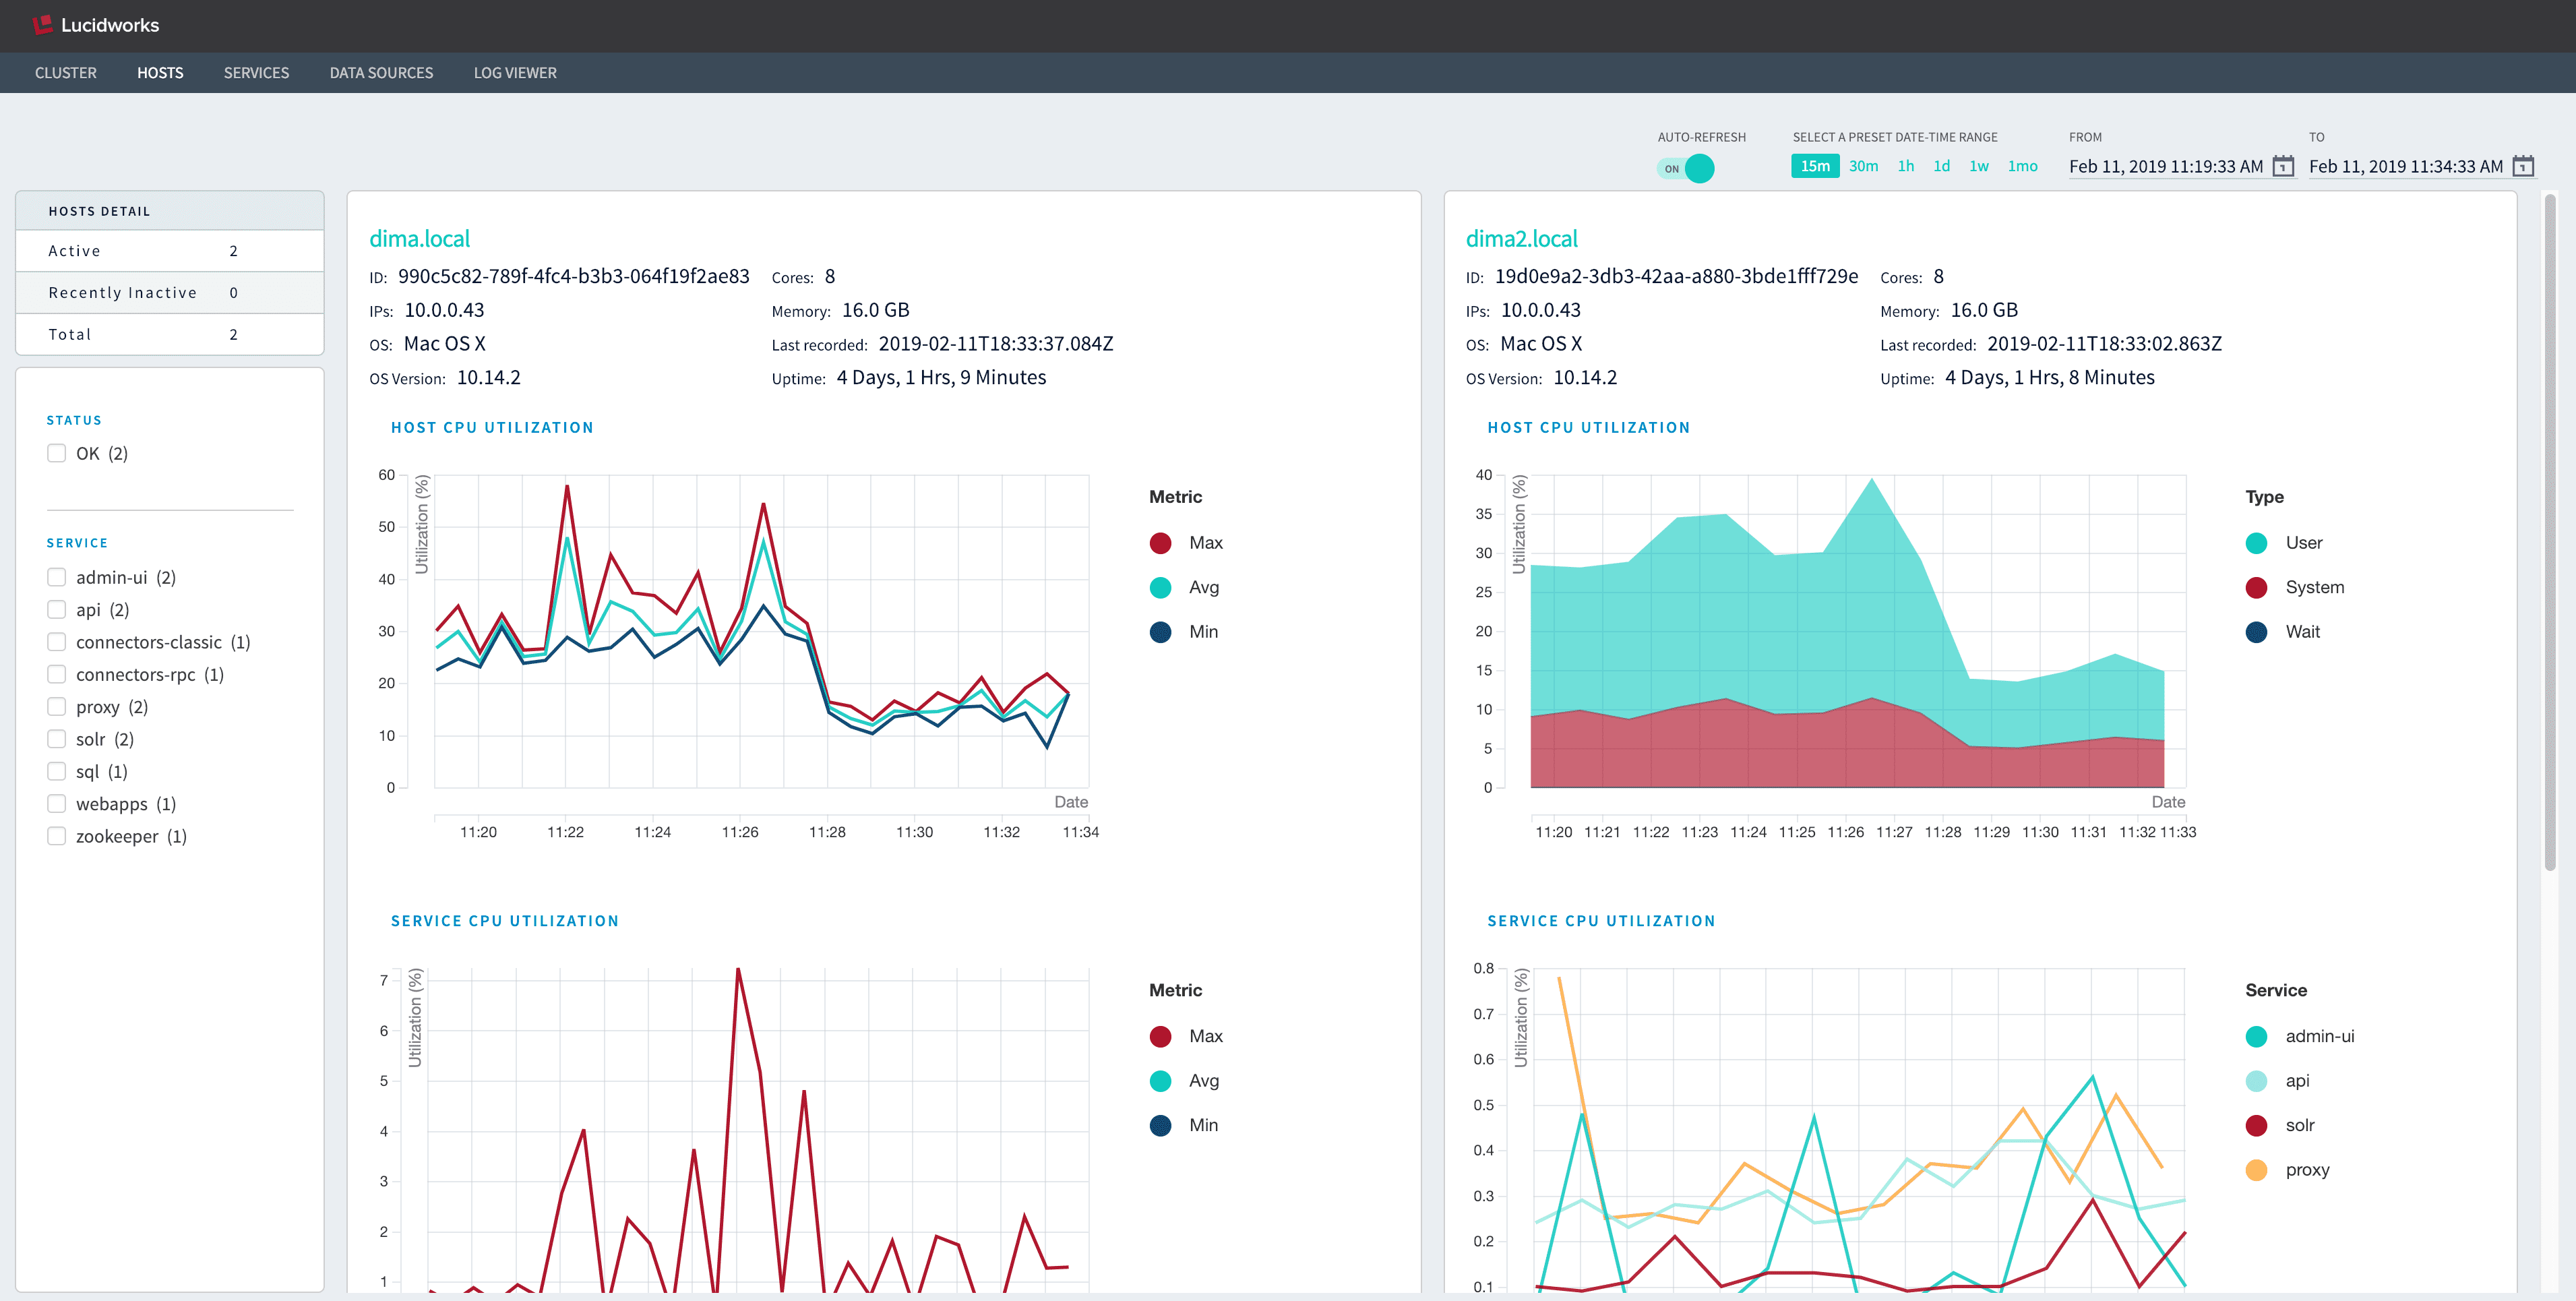
## Hosts dashboard
Data about individual hosts is available in the Hosts dashboard. The initial view includes all hosts.
From here you can filter the set of hosts displayed:
* Select one or more status codes to display only the hosts with those statuses.
* Select one or more services to display only the hosts on which they are running.
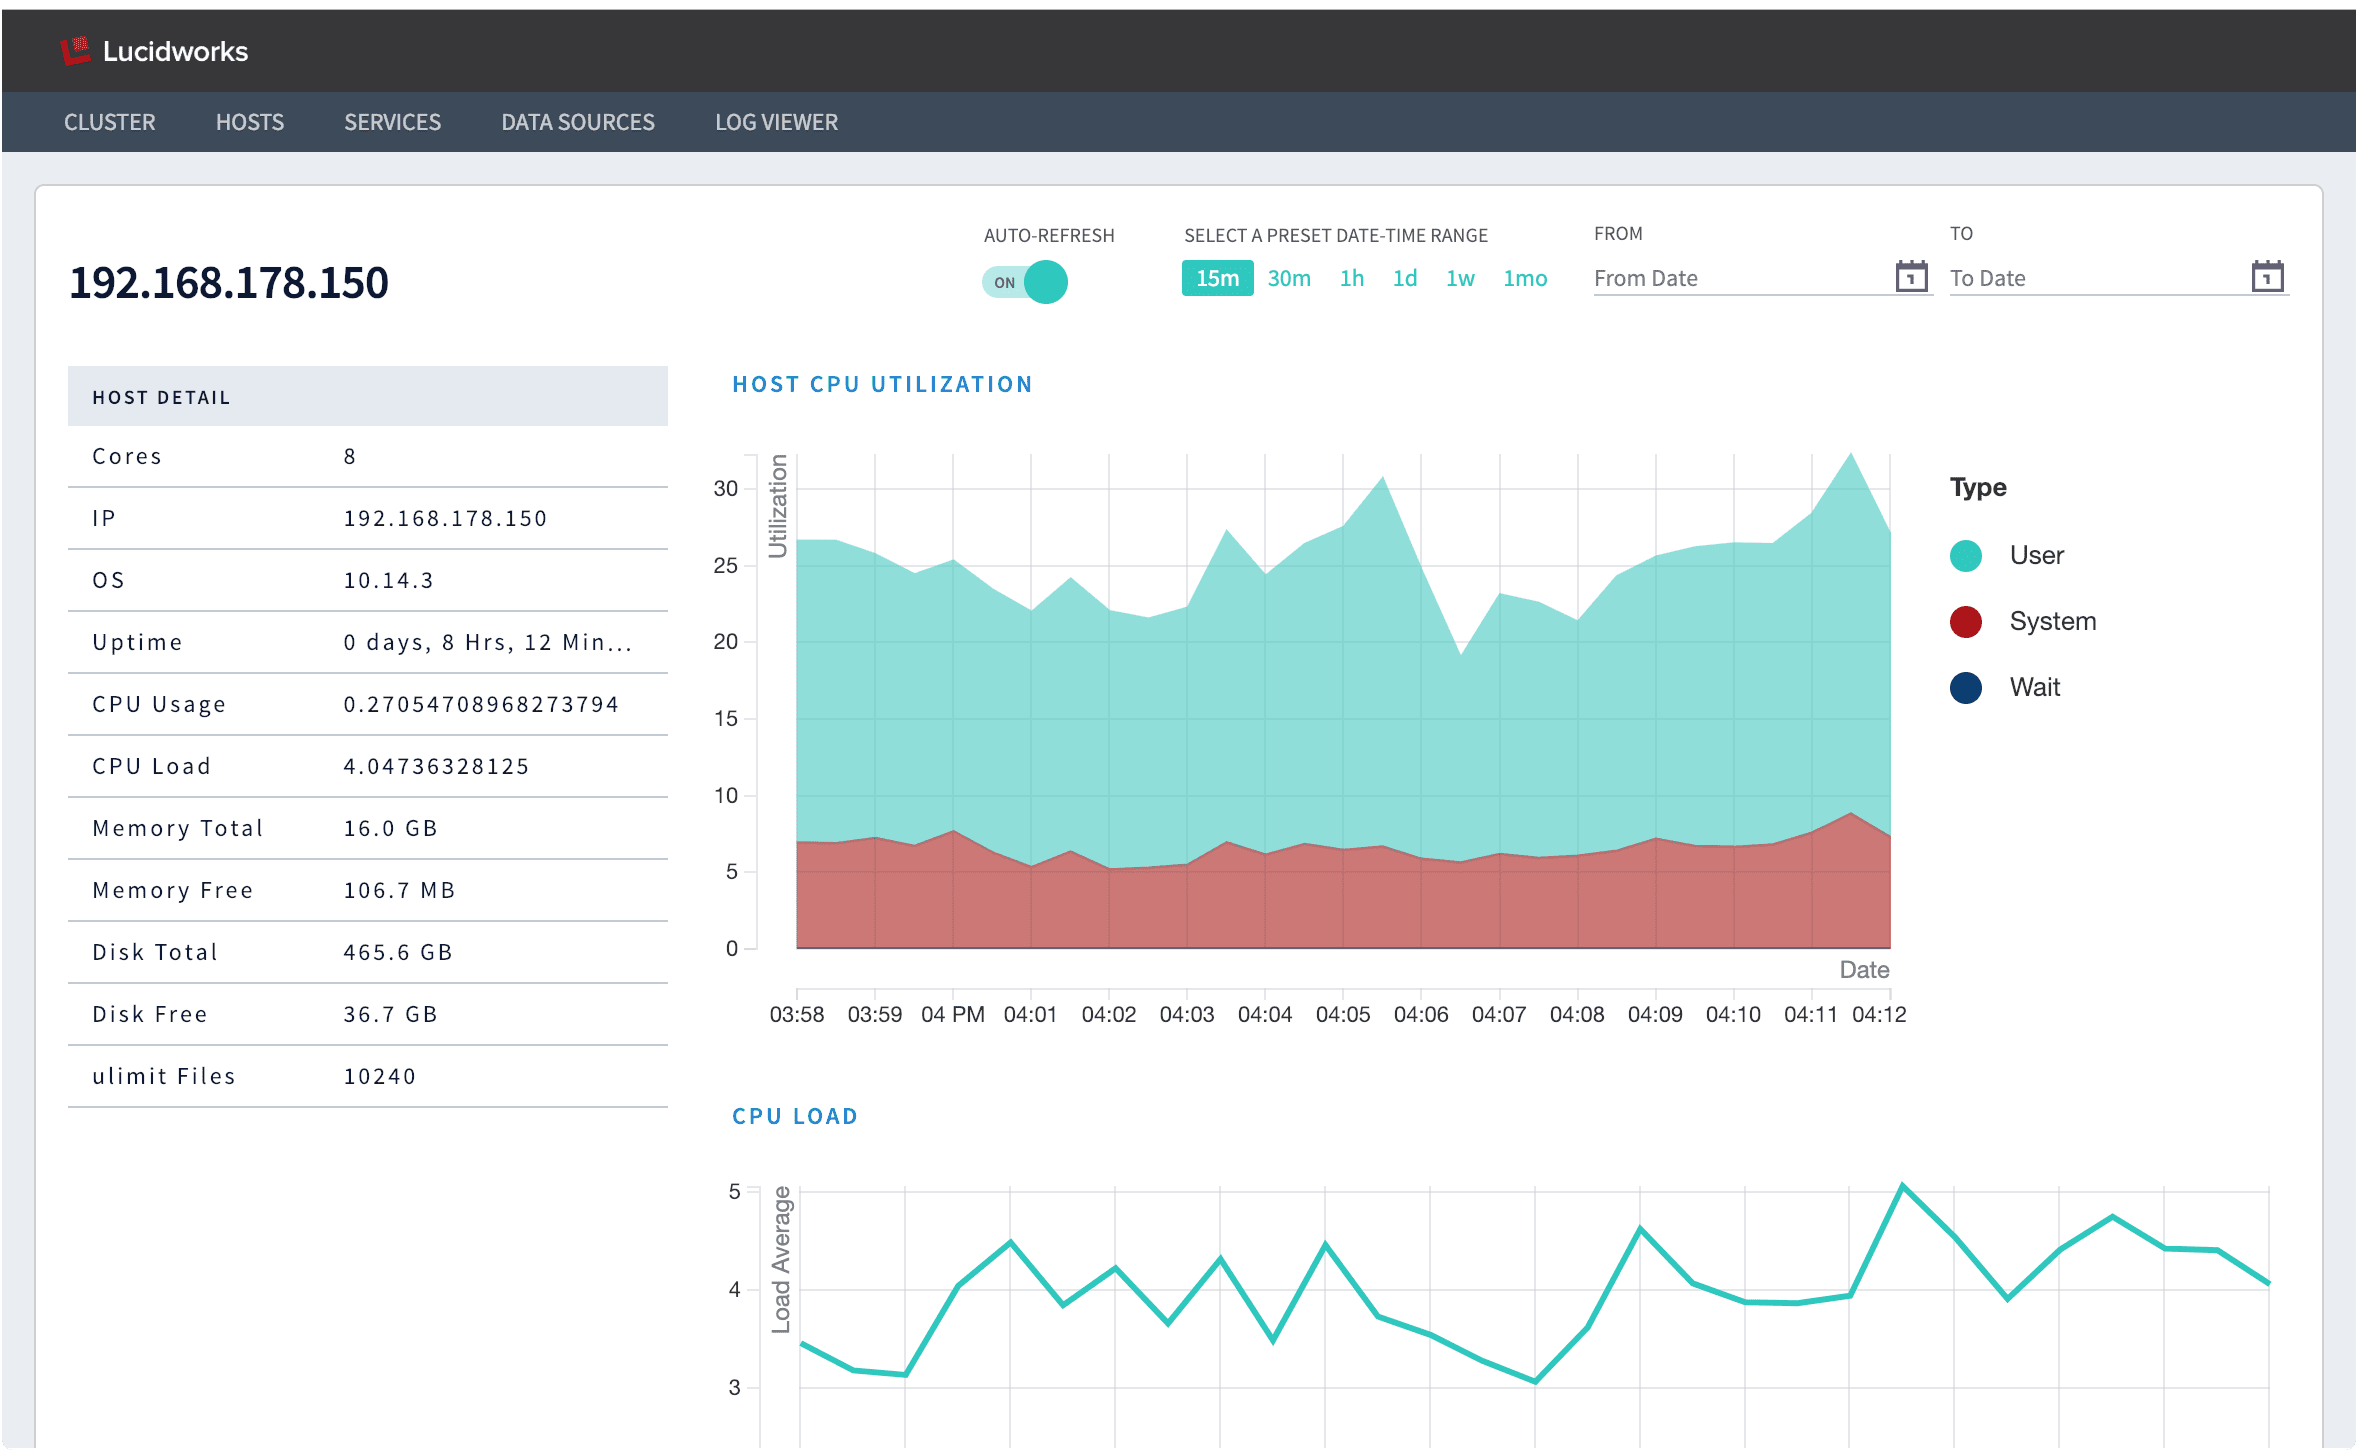
Click on any host’s IP address to drill down to additional visualizations about that host:
In this single-host view, you can see the following:
**Host details**
* Cores
* IP address
* Operating system
* Uptime
* CPU usage
* CPU load
* Memory total
* Memory free
* Disk total
* Disk free
* ulimit files
**Host graphs and tables**
* CPU utilization
* CPU load
* Per-service CPU utilization
* Time spent in garbage collection (GC)
* Free memory
* Free disk space
* Overview of services running on the host
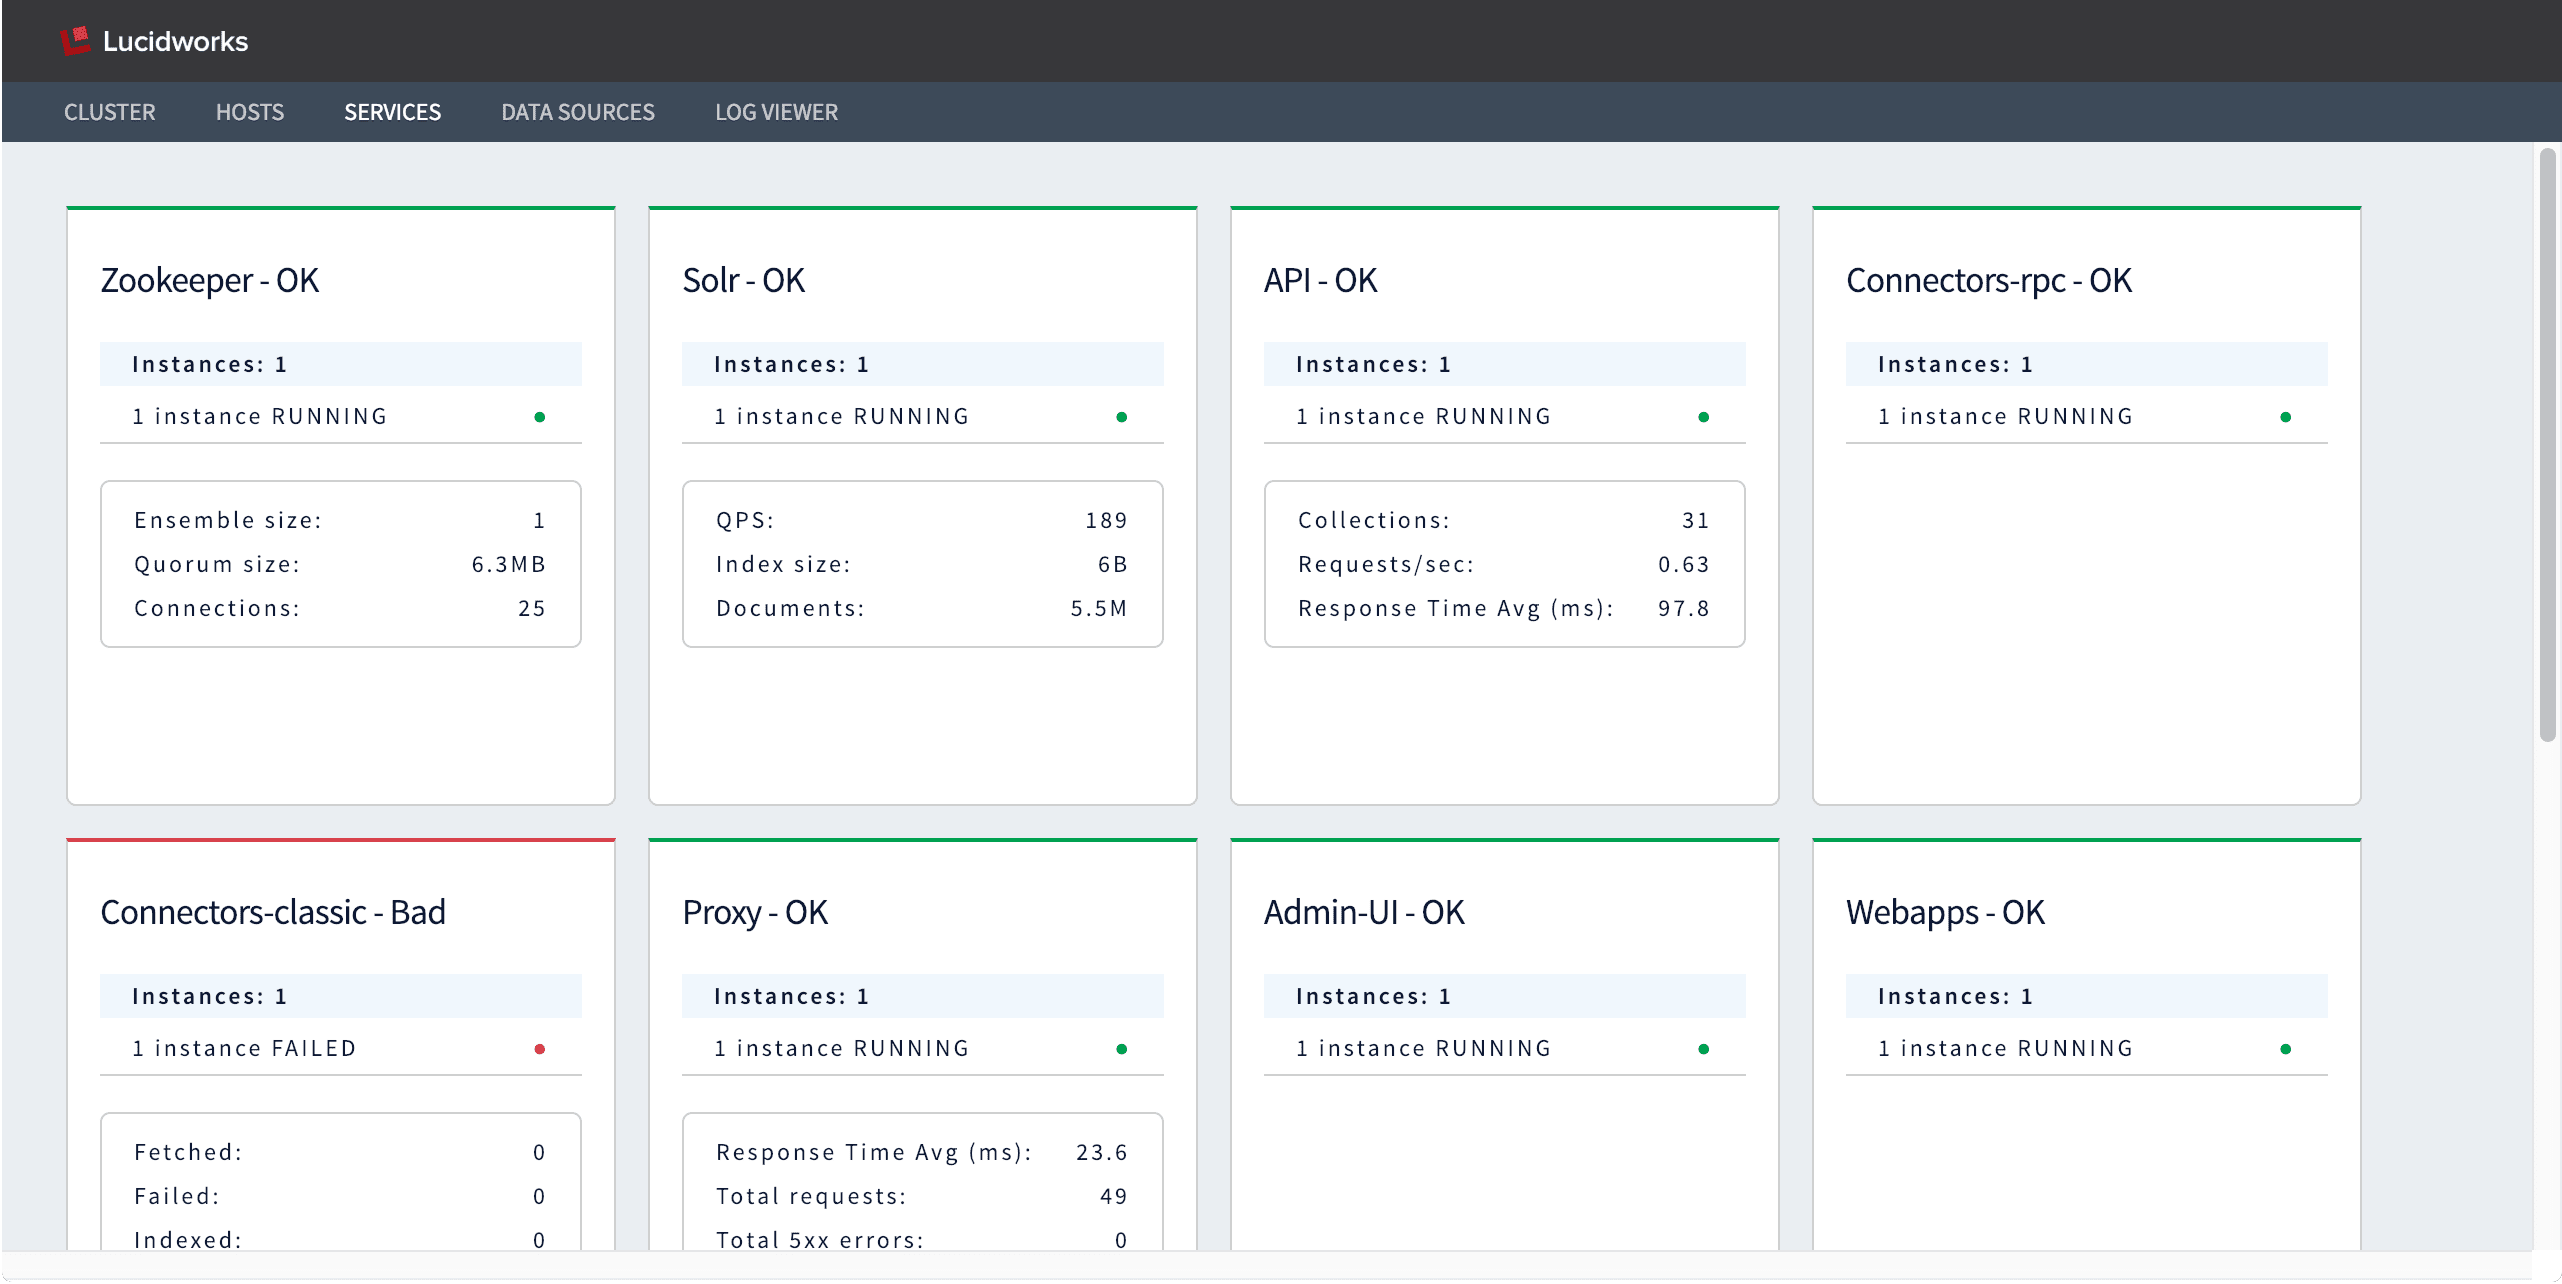
## Services dashboard
The Services dashboard displays the status of each of the Fusion services: "OK" for services that are running and "Bad" for services that are unreachable. Metrics are also displayed for each service, and these vary depending on the service. A service is marked "Bad" if it does not return metrics after several expected reporting intervals, that is, after a few minutes.
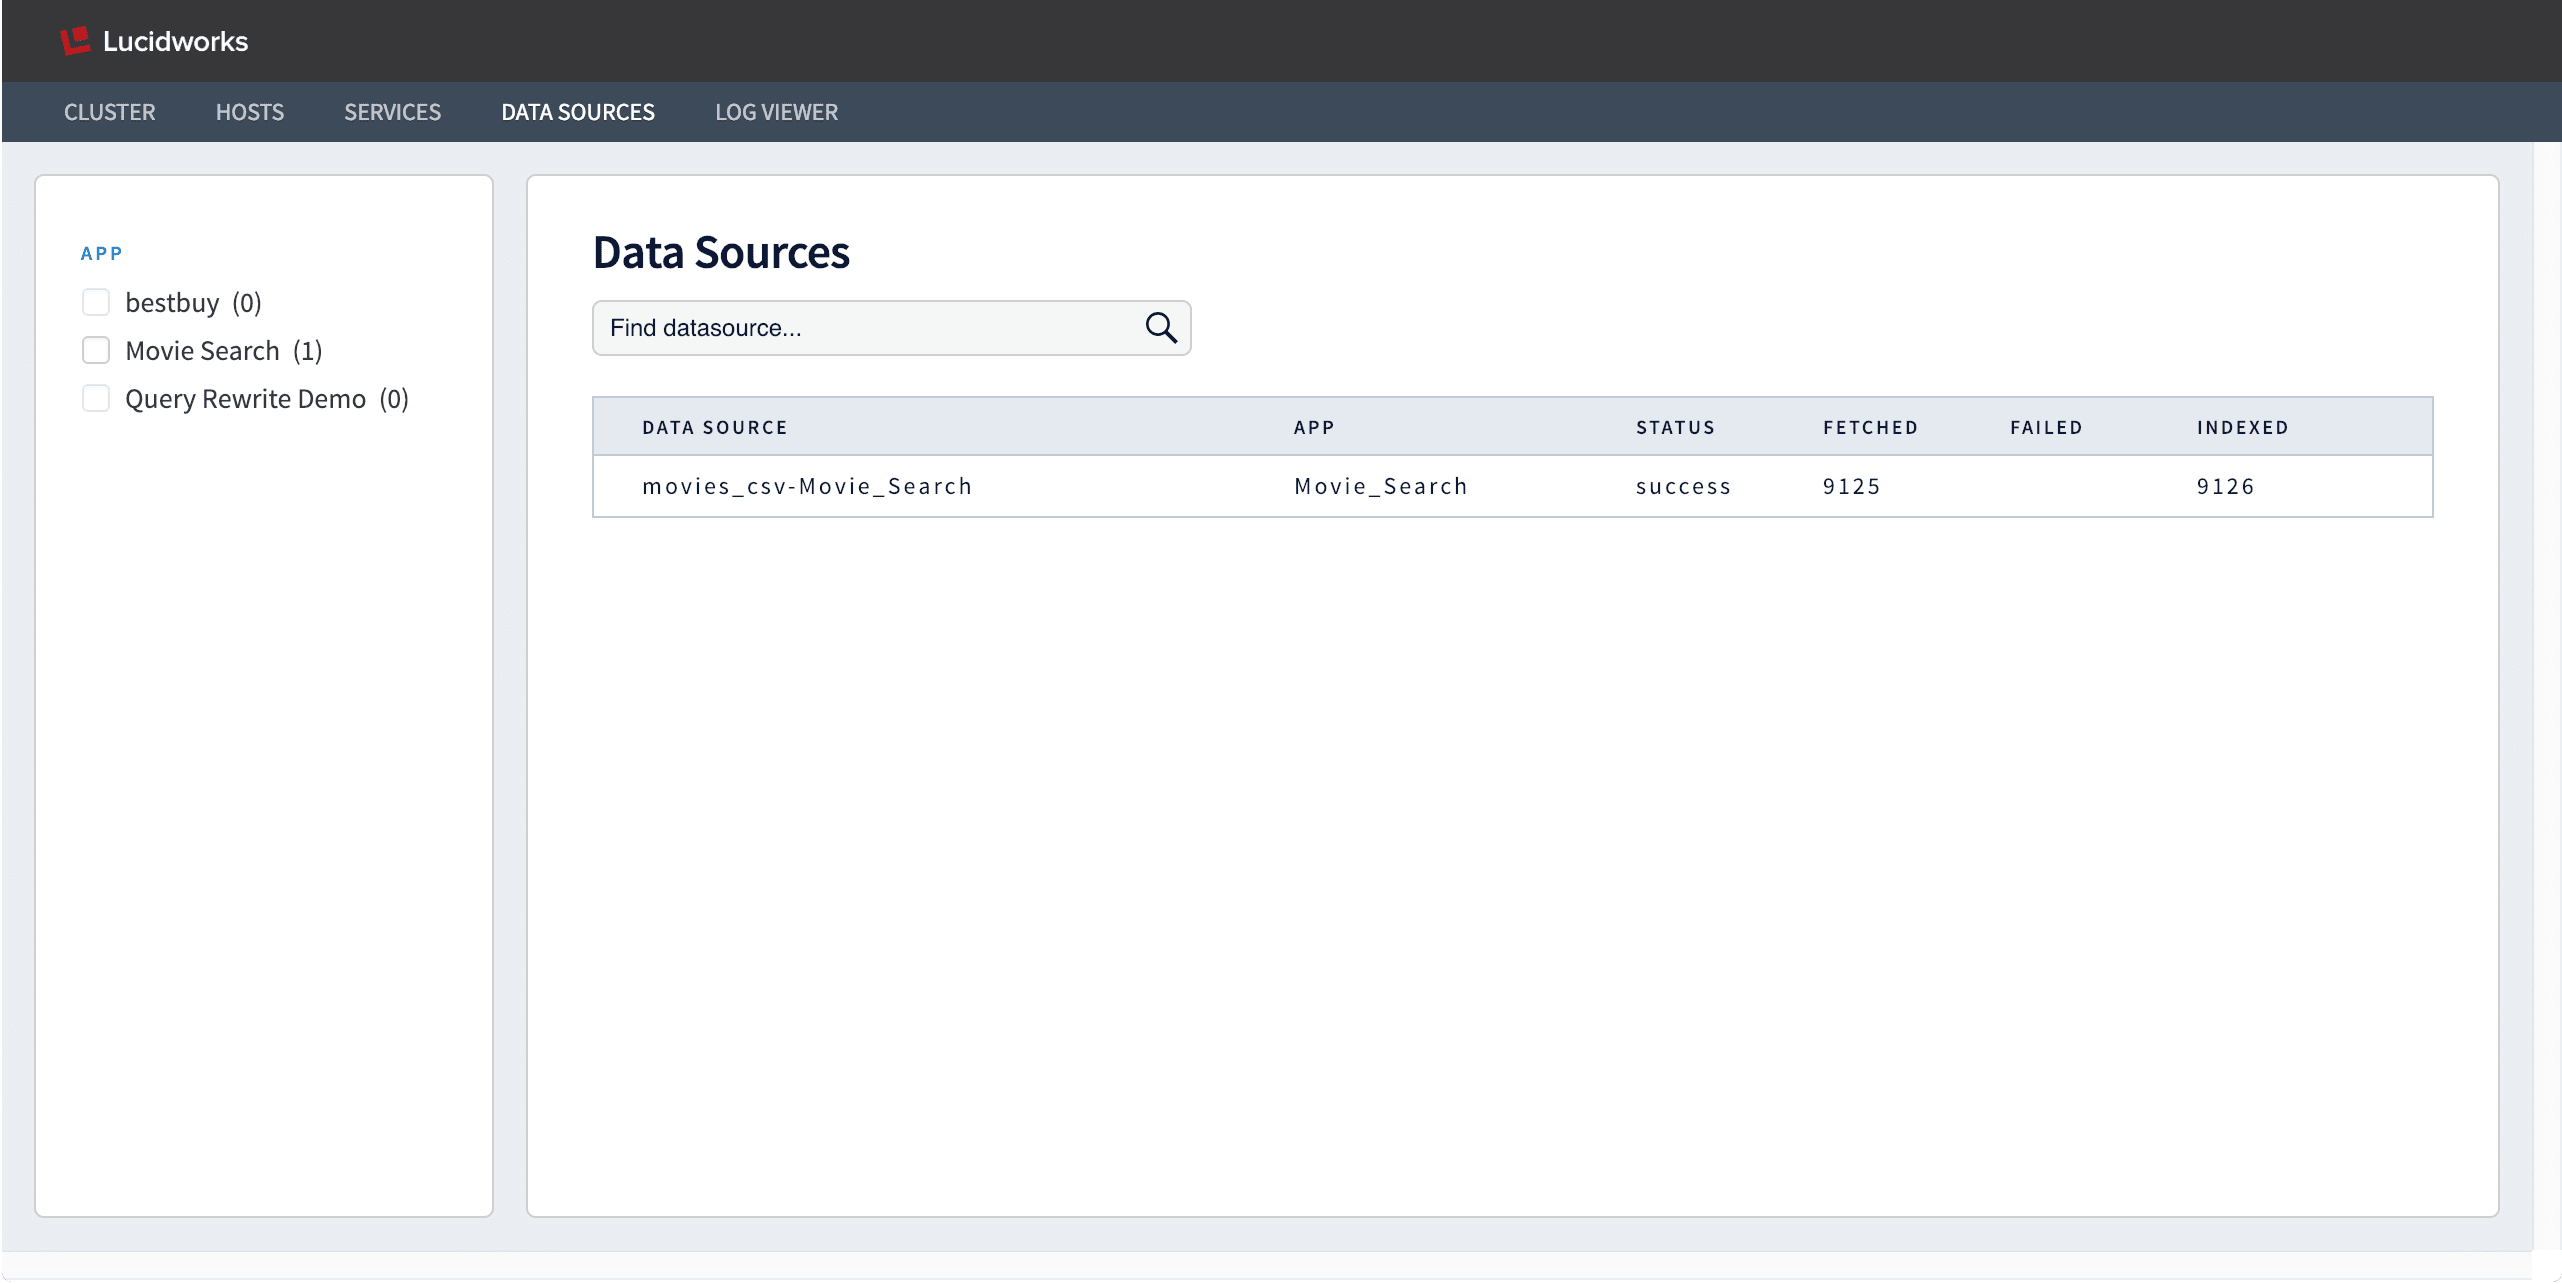
## Datasources dashboard
The Datasources dashboard displays the status, number of fetched documents, number of failed documents, and number of indexed documents for each Fusion datasource. By default, the dashboard displays only the datasources for the currently-selected app. Select one or more apps on the left to view all of the datasources in those apps.
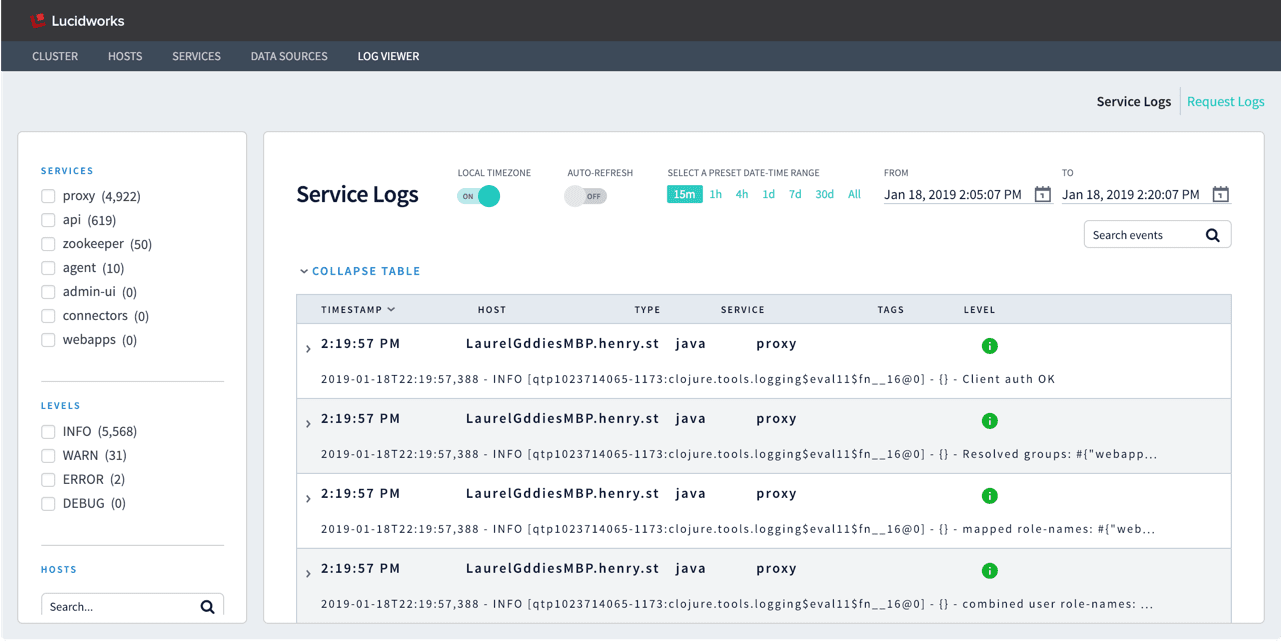
## The Log Viewer
The Log Viewer displays service logs and request logs from Fusion’s `system_logs` collection.
By default, timestamps are displayed in local time, as determined by your browser. To view timestamps in UTC (unless `default.timezone` is set to another time zone in `fusion.properties`), set **LOCAL TIMEZONE** to "Off".
**Auto-Refesh** is off by default, to display static log data. To display real-time logs, set this to "On".
See [Export Data from the DevOps Center](#export-data-from-the-devops-center) to learn how to export log data.
### Service logs
Service log files are written to the filesystem by each running service, such as `var/log/api/api.log`, `var/log/proxy/proxy.log`, and so on. Fusion indexes them in the `system_logs` collection with `type=java`.
In the DevOps Center, you can filter service logs by:
* Service
* Log level
* Host
### Request logs
HTTP request log files are written to the filesystem by Jetty, at `var/log/proxy/jetty_request_.log`. Fusion indexes them in the `system_logs` collection with `type=http`.
In the DevOps Center, you can filter request logs by:
* HTTP status code
* HTTP method
* Host
## Learn more
The DevOps Center is enabled by Fusion’s default configuration. If you find that the DevOps Center is not correctly populated with data, check the following:
* Check for browser extensions that block HTML5 autoplay.
* Check that the Fusion `log-shipper` service is enabled, as it is by default:
```bash theme={"dark"}
fusion/latest.x/bin/log-shipper status
```
If it is not enabled, make sure it is included in the list of default services in `fusion.cors` (`fusion.properties` in Fusion 4.x), as in this example:
```java theme={"dark"}
group.default = zookeeper, solr, api, connectors-classic, connectors-rpc, proxy, webapps, admin-ui, sql, log-shipper
```
If you are running some services on separate nodes, make sure those nodes are also running Fusion’s `agent` and `log-shipper`.
* In `fusion.cors` (`fusion.properties` in Fusion 4.x), check that `collectMetrics` is "true" and `collectMetricsIntervalSecs` is set to a reasonable interval:
```bash theme={"dark"}
# capture host and services metrics
# and ship them to system_monitor Solr collection
default.collectMetrics = true
default.collectMetricsIntervalSecs = 30
```
 Click **Export service logs** in the Service Logs tab or **Export request logs** in the Request Logs tab to download a `.csv` file containing the logs (shown here with example timestamps):
* `serviceLogs[2019-02-07T22:28:49.000Z-2019-02-07T22:43:49.695Z].csv`
* `requestLogs[2019-02-07T22:28:49.000Z-2019-02-07T22:43:49.695Z].csv`
Click **Export service logs** in the Service Logs tab or **Export request logs** in the Request Logs tab to download a `.csv` file containing the logs (shown here with example timestamps):
* `serviceLogs[2019-02-07T22:28:49.000Z-2019-02-07T22:43:49.695Z].csv`
* `requestLogs[2019-02-07T22:28:49.000Z-2019-02-07T22:43:49.695Z].csv`
 The Cluster dashboard includes this data:
* Fusion [license](/docs/4/fusion-server/concepts/licensing) information
* The number of hosts, collections, and Solr clusters in this cluster
* The cluster’s service status
* Average and max values during the selected time interval for the following metrics:
* Query rate
* Response time
* Index size
* Indexing rate
* Active sessions
## Hosts dashboard
Data about individual hosts is available in the Hosts dashboard. The initial view includes all hosts.
The Cluster dashboard includes this data:
* Fusion [license](/docs/4/fusion-server/concepts/licensing) information
* The number of hosts, collections, and Solr clusters in this cluster
* The cluster’s service status
* Average and max values during the selected time interval for the following metrics:
* Query rate
* Response time
* Index size
* Indexing rate
* Active sessions
## Hosts dashboard
Data about individual hosts is available in the Hosts dashboard. The initial view includes all hosts.
 From here you can filter the set of hosts displayed:
* Select one or more status codes to display only the hosts with those statuses.
* Select one or more services to display only the hosts on which they are running.
Click on any host’s IP address to drill down to additional visualizations about that host:
From here you can filter the set of hosts displayed:
* Select one or more status codes to display only the hosts with those statuses.
* Select one or more services to display only the hosts on which they are running.
Click on any host’s IP address to drill down to additional visualizations about that host:
 In this single-host view, you can see the following:
**Host details**
* Cores
* IP address
* Operating system
* Uptime
* CPU usage
* CPU load
* Memory total
* Memory free
* Disk total
* Disk free
* ulimit files
**Host graphs and tables**
* CPU utilization
* CPU load
* Per-service CPU utilization
* Time spent in garbage collection (GC)
* Free memory
* Free disk space
* Overview of services running on the host
## Services dashboard
The Services dashboard displays the status of each of the Fusion services: "OK" for services that are running and "Bad" for services that are unreachable. Metrics are also displayed for each service, and these vary depending on the service. A service is marked "Bad" if it does not return metrics after several expected reporting intervals, that is, after a few minutes.
In this single-host view, you can see the following:
**Host details**
* Cores
* IP address
* Operating system
* Uptime
* CPU usage
* CPU load
* Memory total
* Memory free
* Disk total
* Disk free
* ulimit files
**Host graphs and tables**
* CPU utilization
* CPU load
* Per-service CPU utilization
* Time spent in garbage collection (GC)
* Free memory
* Free disk space
* Overview of services running on the host
## Services dashboard
The Services dashboard displays the status of each of the Fusion services: "OK" for services that are running and "Bad" for services that are unreachable. Metrics are also displayed for each service, and these vary depending on the service. A service is marked "Bad" if it does not return metrics after several expected reporting intervals, that is, after a few minutes.
 ## Datasources dashboard
The Datasources dashboard displays the status, number of fetched documents, number of failed documents, and number of indexed documents for each Fusion datasource. By default, the dashboard displays only the datasources for the currently-selected app. Select one or more apps on the left to view all of the datasources in those apps.
## Datasources dashboard
The Datasources dashboard displays the status, number of fetched documents, number of failed documents, and number of indexed documents for each Fusion datasource. By default, the dashboard displays only the datasources for the currently-selected app. Select one or more apps on the left to view all of the datasources in those apps.
 ## The Log Viewer
The Log Viewer displays service logs and request logs from Fusion’s `system_logs` collection.
## The Log Viewer
The Log Viewer displays service logs and request logs from Fusion’s `system_logs` collection.
 By default, timestamps are displayed in local time, as determined by your browser. To view timestamps in UTC (unless `default.timezone` is set to another time zone in `fusion.properties`), set **LOCAL TIMEZONE** to "Off".
**Auto-Refesh** is off by default, to display static log data. To display real-time logs, set this to "On".
See [Export Data from the DevOps Center](#export-data-from-the-devops-center) to learn how to export log data.
### Service logs
Service log files are written to the filesystem by each running service, such as `var/log/api/api.log`, `var/log/proxy/proxy.log`, and so on. Fusion indexes them in the `system_logs` collection with `type=java`.
In the DevOps Center, you can filter service logs by:
* Service
* Log level
* Host
### Request logs
HTTP request log files are written to the filesystem by Jetty, at `var/log/proxy/jetty_request_
By default, timestamps are displayed in local time, as determined by your browser. To view timestamps in UTC (unless `default.timezone` is set to another time zone in `fusion.properties`), set **LOCAL TIMEZONE** to "Off".
**Auto-Refesh** is off by default, to display static log data. To display real-time logs, set this to "On".
See [Export Data from the DevOps Center](#export-data-from-the-devops-center) to learn how to export log data.
### Service logs
Service log files are written to the filesystem by each running service, such as `var/log/api/api.log`, `var/log/proxy/proxy.log`, and so on. Fusion indexes them in the `system_logs` collection with `type=java`.
In the DevOps Center, you can filter service logs by:
* Service
* Log level
* Host
### Request logs
HTTP request log files are written to the filesystem by Jetty, at `var/log/proxy/jetty_request_