> ## Documentation Index
> Fetch the complete documentation index at: https://doc.lucidworks.com/llms.txt
> Use this file to discover all available pages before exploring further.
# App Insights Dashboards
export const LwTemplate = ({title = "Key questions to get you started", icon = "sparkles", cta = "Powered by Agent Studio", linkHref = "https://lucidworks.com/demo/?utm_source=docs&utm_medium=referral&utm_campaign=docs_cta_ai"}) => {
const [isLoaded, setIsLoaded] = useState(false);
useEffect(() => {
const timer = setTimeout(() => {
setIsLoaded(true);
}, 500);
return () => clearTimeout(timer);
}, []);
return
{isLoaded && `
}} />}
Powered by Lucidworks Agent Studio
;
};
[localhost link]: http://localhost:3000/docs/4/fusion-ai/concepts/insights/dashboards
[mintlify link]: https://doc.lucidworks.com/docs/4/fusion-ai/concepts/insights/dashboards
[old doc.lw link]: https://doc.lucidworks.com/fusion/5.9/458
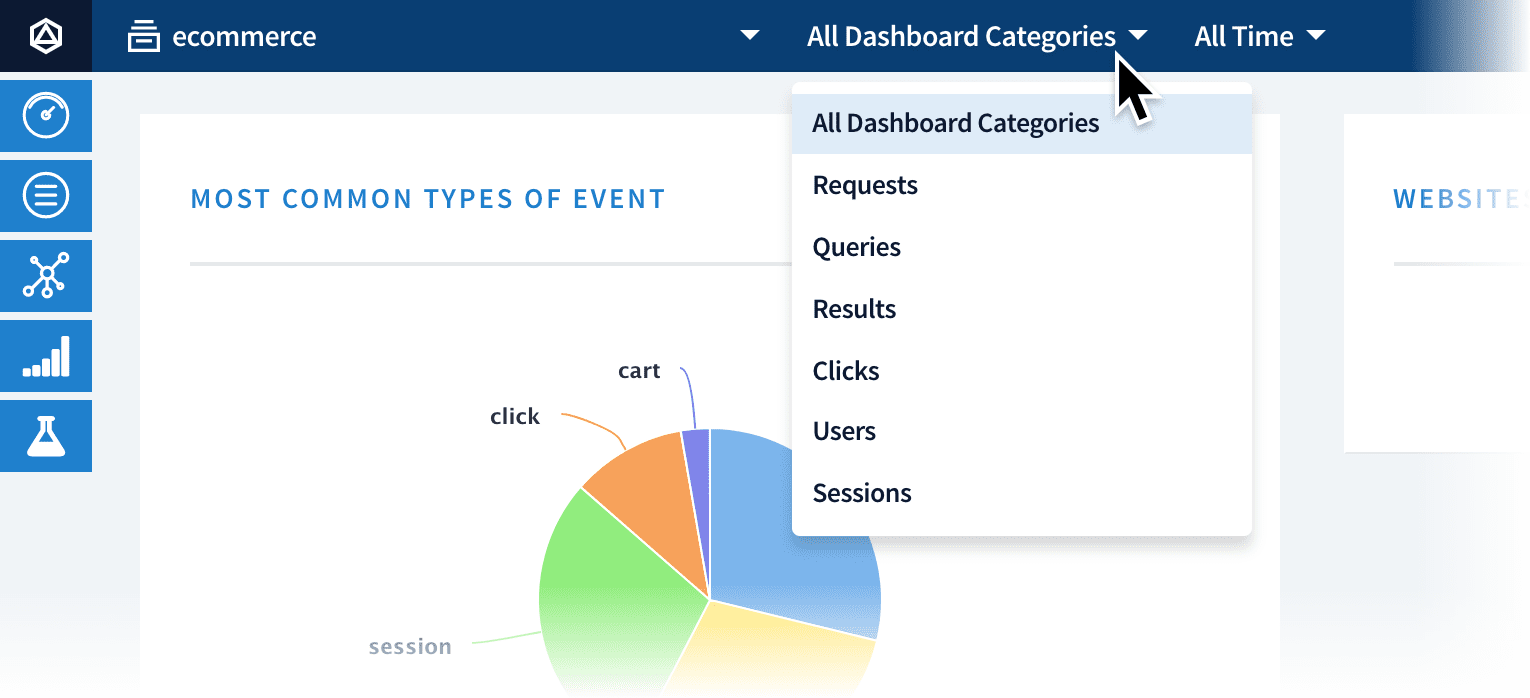
When you open the Dashboards page, it displays graphs and tables for attributes that are common to all signals. For more specific charts, you can open the **All Dashboard Categories** menu at the top and select a category:
## Dashboard filtering
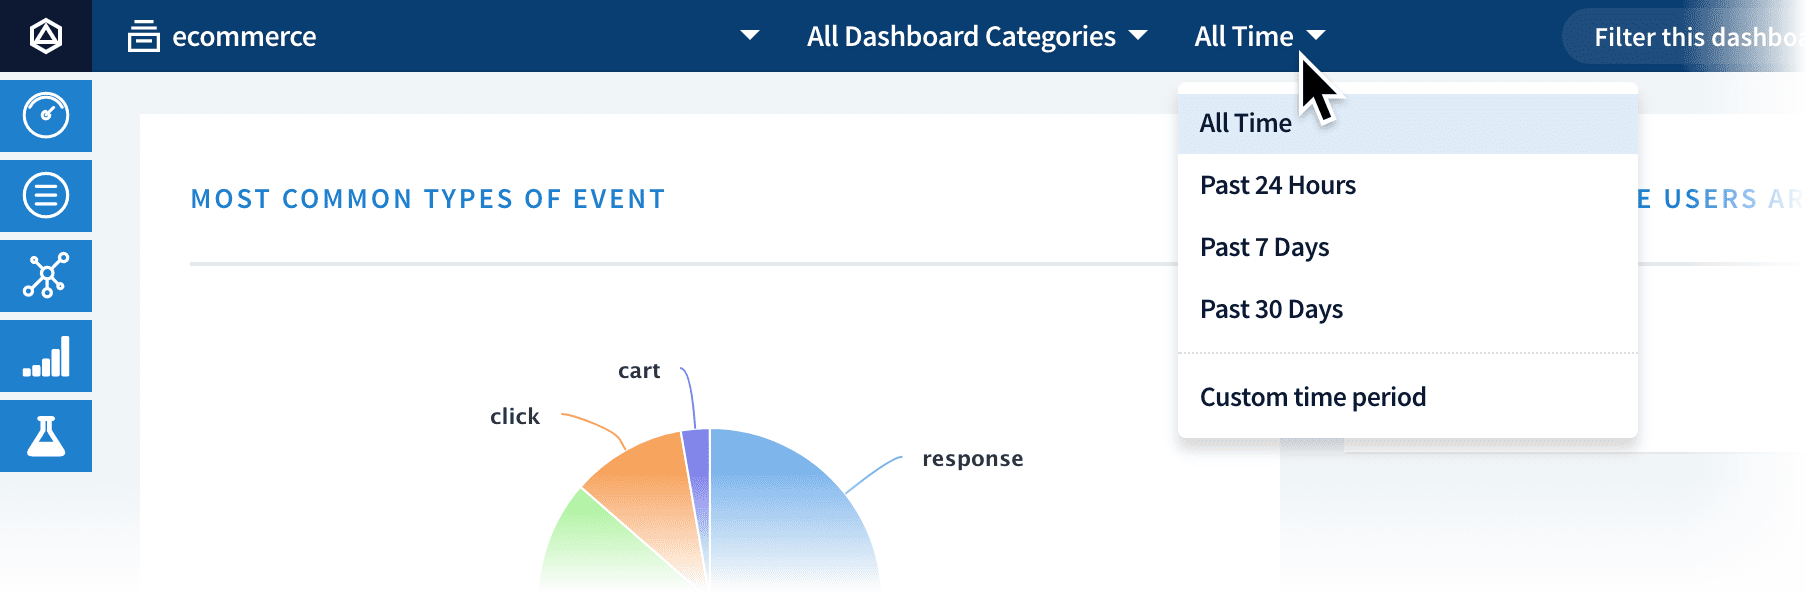
You can filter by timeframe using the **All Time** menu:
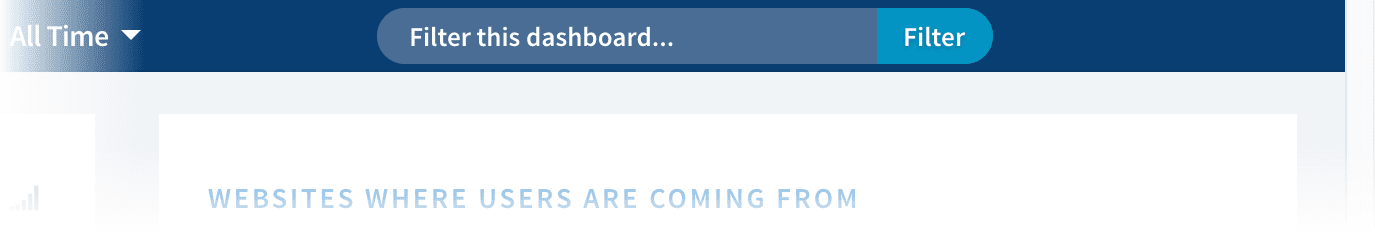
To filter by the content of the data, enter a string in the **Filter this dashboard…** text box:
 To filter by the content of the data, enter a string in the **Filter this dashboard…** text box: