> ## Documentation Index
> Fetch the complete documentation index at: https://doc.lucidworks.com/llms.txt
> Use this file to discover all available pages before exploring further.

# chart:legend

export const LwTemplate = ({title = "Key questions to get you started", icon = "sparkles", cta = "Powered by Agent Studio", linkHref = "https://lucidworks.com/demo/?utm_source=docs&utm_medium=referral&utm_campaign=docs_cta_ai"}) => {
  const [isLoaded, setIsLoaded] = useState(false);
  useEffect(() => {
    const timer = setTimeout(() => {
      setIsLoaded(true);
    }, 500);
    return () => clearTimeout(timer);
  }, []);
  return <div className="lw-template-container">
      <Card title={title} icon={icon}>
        {isLoaded && <span dangerouslySetInnerHTML={{
    __html: `<lw-template id="a029c1a9-28be-427e-b0e1-5d918920246a"></lw-template
            >`
  }} />}
        <Link href={linkHref} className="agent-studio-link text-left text-gray-600 gap-2 dark:text-gray-400 text-sm font-medium flex flex-row items-center hover:text-primary dark:hover:text-primary-light group-hover:text-primary group-hover:dark:text-primary-light">Powered by Lucidworks Agent Studio</Link>
      </Card>
    </div>;
};

[localhost link]: http://localhost:3000/docs/4/app-studio/reference/tags/lightning.directive.chartLegend

[mintlify link]: https://doc.lucidworks.com/docs/4/app-studio/reference/tags/lightning.directive.chartLegend

[old doc.lw link]: https://doc.lucidworks.com/app-studio/4.2/1112

<LwTemplate />

## Description

A legend is displayed when the chart has multiple series, with the Chart
Legend tag you can customise the legend with a title, border and
location on the chart along with other things. This tag must be nested
in the [Chart Display tag](/docs/4/app-studio/reference/tags/lightning.directive.chartDisplay).

## Usage

as element:

```xml wrap  theme={"dark"}
<chart:legend
       [title="{string}"]
       [align="{string}"]
       [vertical-align="{string}"]
       [layout="{string}"]
       [x="{string}"]
       [y="{string}"]>
</chart:legend>
```

### Directive info

* This directive creates new scope.

#### Parameters

| Param                        | Type       | Details                                                                                                                                     |
| ---------------------------- | ---------- | ------------------------------------------------------------------------------------------------------------------------------------------- |
| title  *(optional)*          | **string** | The title of the legend.                                                                                                                    |
| align  *(optional)*          | **string** | The horizontal alignment of the legend box within the chart area. Valid values are 'left', 'center' and 'right'.                            |
| vertical-align  *(optional)* | **string** | The vertical alignment of the legend box. Valid values are 'top', 'middle' or 'bottom'.                                                     |
| layout  *(optional)*         | **string** | The layout of the legend items. Can be one of 'horizontal' or 'vertical'.                                                                   |
| x  *(optional)*              | **string** | The x offset of the legend relative to its horizontal alignment 'align'. Negative x moves it to the left, positive x moves it to the right. |
| y  *(optional)*              | **string** | The vertical offset of the legend relative to it’s vertical alignment 'verticalAlign'. Negative y moves it up, positive y moves it down.    |

## Example

#### Source

```xml wrap  expandable  theme={"dark"}
<div ng-controller="ExampleController">
    <h3 id="example_legend">Legend</h3>
    <h4 id="example_legend_legend-on-the-right">Legend on the Right</h4>
    <tk-example>
        <chart:display response="response" title="Files Indexed" subtitle="Per Day">
            <series:facet name="test1" type="column" title="First Pass"></series:facet>
            <series:facet name="test2" type="column" title="Second Pass"></series:facet>
            <chart:legend title="Legend Title"  align="right" vertical-align="top" layout="vertical" y="100"></chart:legend>
        </chart:display>
    </tk-example>
    <tk-code-wrapper>
        <code hljs>
<chart:display response="response" title="Files Indexed" subtitle="Per Day">
    <series:facet name="test1" type="column" title="First Pass"></series:facet>
    <series:facet name="test2" type="column" title="Second Pass"></series:facet>
    <chart:legend title="Legend Title"  align="right" vertical-align="top" layout="vertical" y="100"></chart:legend>
</chart:display>
        </code>
    </tk-code-wrapper>

    <hr/>

    <h4 id="example_legend_legend-on-the-left">Legend on the Left</h4>
    <tk-example>
        <chart:display response="response" title="Files Indexed" subtitle="Per Day">
            <series:facet name="test1" type="column" title="First Pass"></series:facet>
            <series:facet name="test2" type="column" title="Second Pass"></series:facet>
            <chart:legend title="Legend Title"  align="left" vertical-align="top" layout="vertical" y="100"></chart:legend>
            <chart:legend title="Legend Title"  align="left" vertical-align="top" layout="vertical" y="100"></chart:legend>
        </chart:display>
    </tk-example>
    <tk-code-wrapper>
        <code hljs>
<chart:display response="response" title="Files Indexed" subtitle="Per Day">
    <series:facet name="test1" type="column" title="First Pass"></series:facet>
    <series:facet name="test2" type="column" title="Second Pass"></series:facet>
    <chart:legend title="Legend Title"  align="right" vertical-align="top" layout="vertical" y="100"></chart:legend>
</chart:display>
        </code>
    </tk-code-wrapper>

    <hr/>

    <h4 id="example_legend_legend-on-the-bottom">Legend on the Bottom
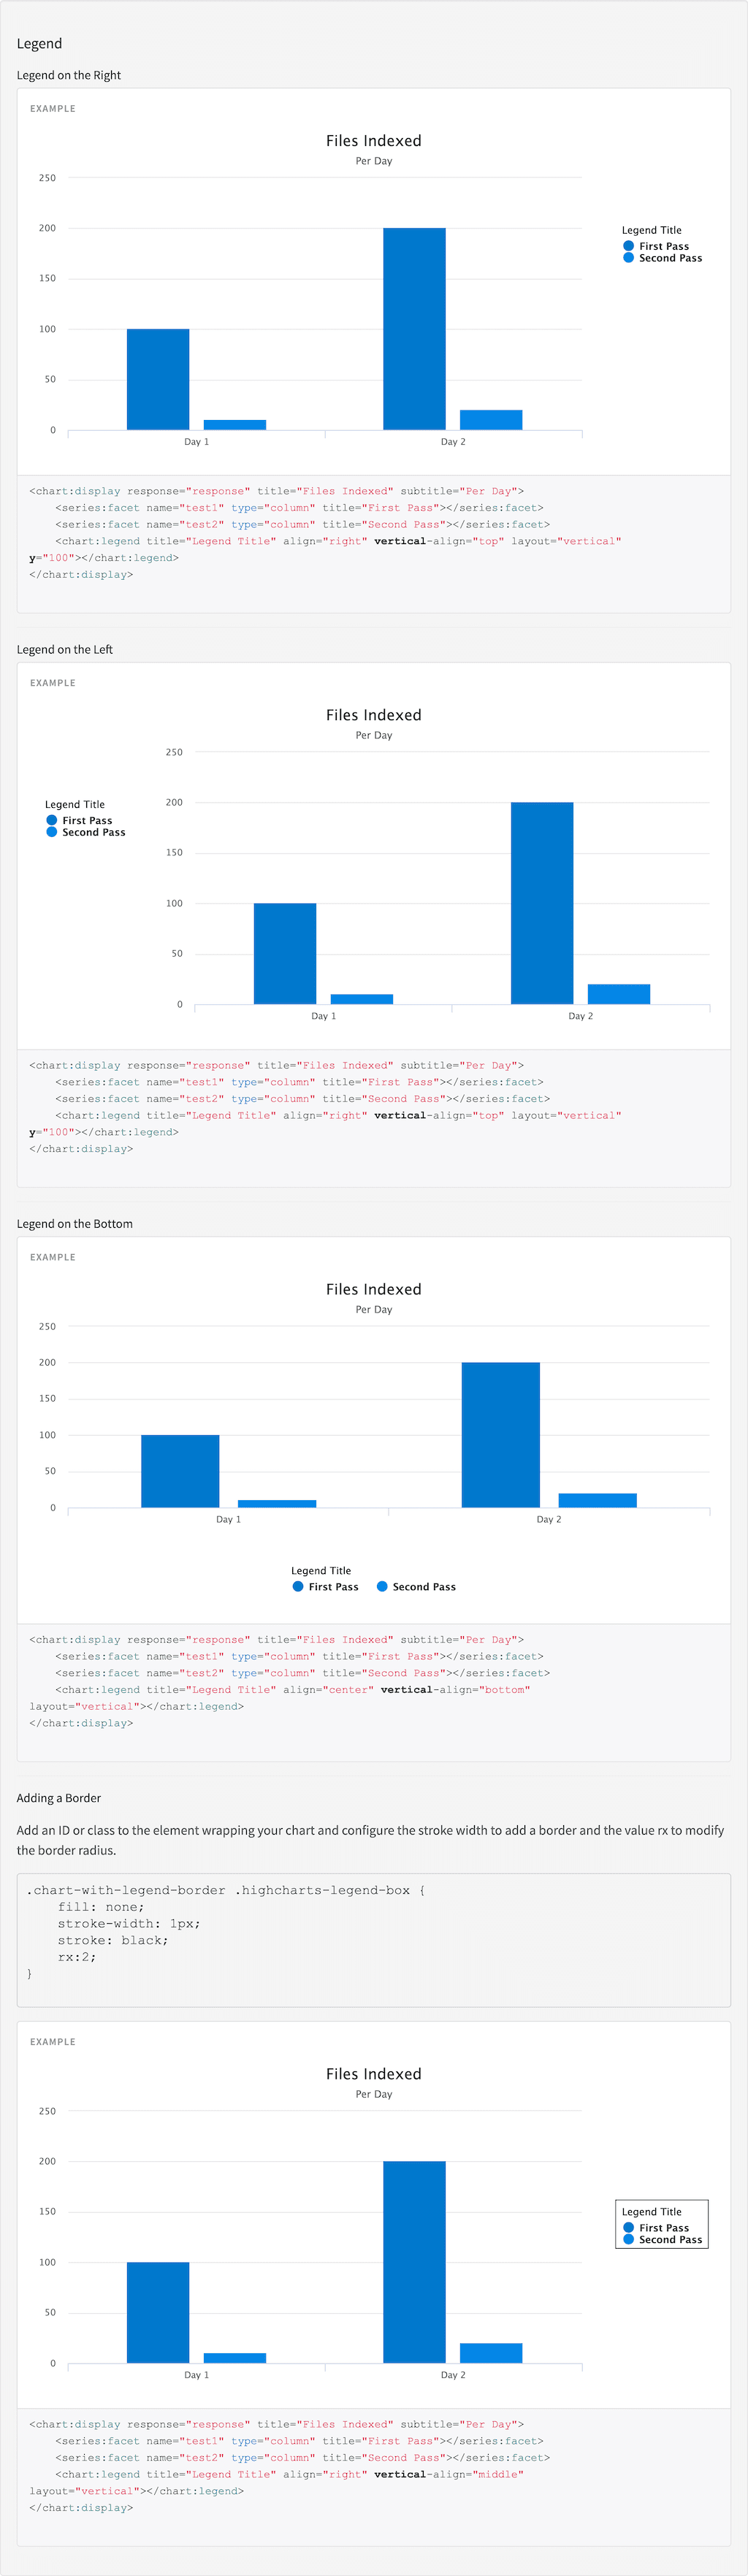
</h4>
    <tk-example>
        <chart:display response="response" title="Files Indexed" subtitle="Per Day">
            <series:facet name="test1" type="column" title="First Pass"></series:facet>
            <series:facet name="test2" type="column" title="Second Pass"></series:facet>
            <chart:legend title="Legend Title"  align="center" vertical-align="bottom" layout="horizontal"</chart:legend>
        </chart:display>
    </tk-example>
    <tk-code-wrapper>
        <code hljs>
<chart:display response="response" title="Files Indexed" subtitle="Per Day">
    <series:facet name="test1" type="column" title="First Pass"></series:facet>
    <series:facet name="test2" type="column" title="Second Pass"></series:facet>
    <chart:legend title="Legend Title"  align="center" vertical-align="bottom" layout="vertical"></chart:legend>
</chart:display>
        </code>
    </tk-code-wrapper>

    <hr/>

    <h4 id="example_legend_adding-a-border">Adding a Border</h4>
    <p>Add an ID or class to the element wrapping your chart and configure the stroke width to add a border and the value rx to modify the border radius.</p>
    <pre>
.chart-with-legend-border .highcharts-legend-box {
    fill: none;
    stroke-width: 1px;
    stroke: black;
    rx:2;
}
    </pre>
    <div class="chart-with-legend-border">
        <tk-example>
            <chart:display response="response" title="Files Indexed" subtitle="Per Day">
                <series:facet name="test1" type="column" title="First Pass"></series:facet>
                <series:facet name="test2" type="column" title="Second Pass"></series:facet>
                <chart:legend title="Legend Title"  align="right" vertical-align="middle" layout="vertical""></chart:legend>
            </chart:display>
        </tk-example>
        <tk-code-wrapper>
            <code hljs>
<chart:display response="response" title="Files Indexed" subtitle="Per Day">
    <series:facet name="test1" type="column" title="First Pass"></series:facet>
    <series:facet name="test2" type="column" title="Second Pass"></series:facet>
    <chart:legend title="Legend Title"  align="right" vertical-align="middle" layout="vertical"></chart:legend>
</chart:display>
            </code>
        </tk-code-wrapper>
    </div>
</div>
```

```css wrap  theme={"dark"}
.chart-with-legend-border .highcharts-legend-box {
        fill: none;
        stroke-width: 1px;
        stroke: black;
        rx:2;
    }
```

```js wrap  expandable  theme={"dark"}
angular.module('lightning')
.controller('ExampleController', ['$scope','$timeout','ResponseService', function($scope,$timeout, ResponseService) {
            $scope.response = {
                page: 2,
                query: {
                    rpp: 50
                },
                facets: {
                    test1: {
                        filters: [
                            {

                                val: {
                                    dsp: 'Day 1',
                                    act: 'Day 1',

                                },
                                count: 100,

                            },
                            {

                                val: {
                                    dsp: 'Day 2',
                                    act: 'Day 2',
                                },
                                count: 200,
                            }

                        ]
                    },
                    test2: {
                        filters: [
                            {

                                val: {
                                    dsp: 'Day 1',
                                    act: 'Day 1',
                                },
                                count: 10,

                            },
                            {

                                val: {
                                    dsp: 'Day 2',
                                    act: 'Day 2',
                                },
                                count: 20,
                            }

                        ]
                    },
                },
                results: [
                    {
                        result: {
                            fields: {
                                label: 'label1',
                                value: 1
                            }
                        },

                    },
                    {
                        result: {
                            fields: {
                                label: 'label2',
                                value: 2
                            }
                        },

                        hits: {
                            act: ['Hits', 264]
                        }
                    }]
            }

            ResponseService.setResponse('response',$scope.response);
        }]);
```

#### Result

<img src="https://mintcdn.com/lucidworks/_JCWsGwGCZxJia7w/assets/images/app-studio/as-examples/tags/chartLegend.png?fit=max&auto=format&n=_JCWsGwGCZxJia7w&q=85&s=ce1f89a7fb9759fef31de636c9c3be67" alt="Result" width="1024" height="3527" data-path="assets/images/app-studio/as-examples/tags/chartLegend.png" />
