> ## Documentation Index
> Fetch the complete documentation index at: https://doc.lucidworks.com/llms.txt
> Use this file to discover all available pages before exploring further.
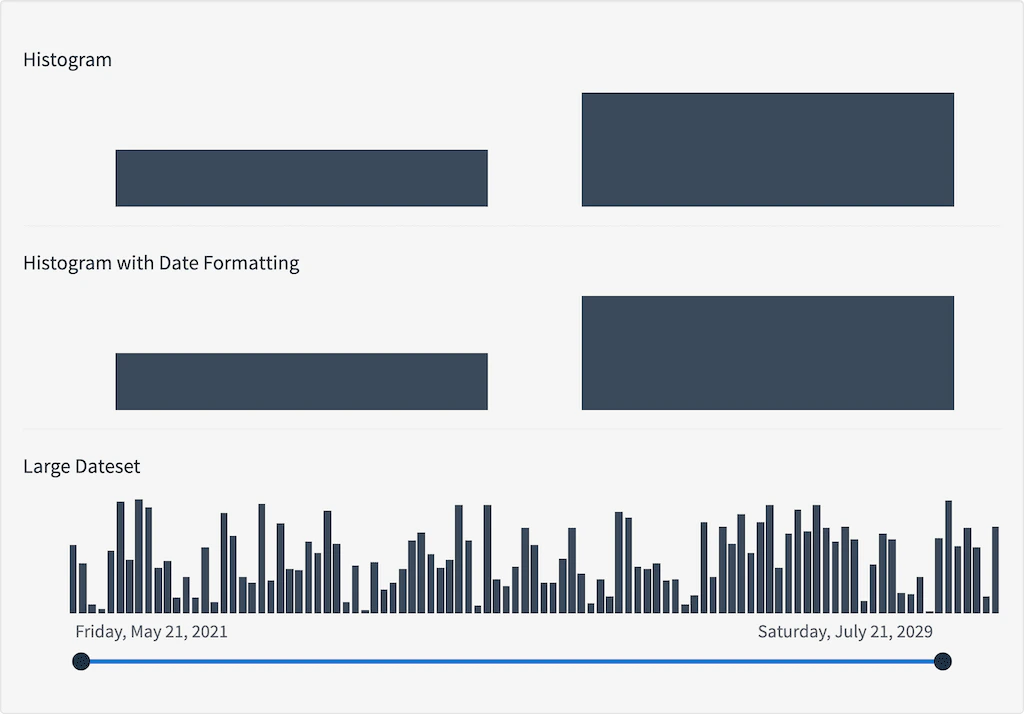
# chart:histogram

export const LwTemplate = ({title = "Key questions to get you started", icon = "sparkles", cta = "Powered by Agent Studio", linkHref = "https://lucidworks.com/demo/?utm_source=docs&utm_medium=referral&utm_campaign=docs_cta_ai"}) => {
  const [isLoaded, setIsLoaded] = useState(false);
  useEffect(() => {
    const timer = setTimeout(() => {
      setIsLoaded(true);
    }, 500);
    return () => clearTimeout(timer);
  }, []);
  return <div className="lw-template-container">
      <Card title={title} icon={icon}>
        {isLoaded && <span dangerouslySetInnerHTML={{
    __html: `<lw-template id="a029c1a9-28be-427e-b0e1-5d918920246a"></lw-template
            >`
  }} />}
        <Link href={linkHref} className="agent-studio-link text-left text-gray-600 gap-2 dark:text-gray-400 text-sm font-medium flex flex-row items-center hover:text-primary dark:hover:text-primary-light group-hover:text-primary group-hover:dark:text-primary-light">Powered by Lucidworks Agent Studio</Link>
      </Card>
    </div>;
};

[localhost link]: http://localhost:3000/docs/4/app-studio/reference/tags/lightning.directive.chartHistogram

[mintlify link]: https://doc.lucidworks.com/docs/4/app-studio/reference/tags/lightning.directive.chartHistogram

[old doc.lw link]: https://doc.lucidworks.com/app-studio/4.2/1179

<LwTemplate />

## Description

The Chart Histogram Directive

## Usage

as element:

```xml wrap  theme={"dark"}
<chart:histogram
       [response="{object}"]
       [facet-name="{string}"]
       [query="{string}"]
       [title="{string}"]
       [show="{number}"]
       [height="{string}"]
       [show-count="{boolean}"]
       [max-characters="{number}"]
       [action="{string}"]
       [date-format="{string}"]>
</chart:histogram>
```

### Directive info

* This directive creates new scope.

#### Parameters

| Param                        | Type        | Details                                                                                                      |
| ---------------------------- | ----------- | ------------------------------------------------------------------------------------------------------------ |
| response  *(optional)*       | **object**  | A response object                                                                                            |
| facet-name  *(optional)*     | **string**  | Facet name to use from the response object                                                                   |
| query  *(optional)*          | **string**  | The name of the query to build links from.                                                                   |
| title  *(optional)*          | **string**  | The title that should be displayed above the histogram.                                                      |
| show  *(optional)*           | **number**  | The maximum number of bars to show in the histogram. Defaults to 20.                                         |
| height  *(optional)*         | **string**  | Height of the chart specified by a valid CSS height style value (e.g. '100px' or '7em'). Defaults to '100px' |
| show-count  *(optional)*     | **boolean** | Whether to display the count in the label for each bar                                                       |
| max-characters  *(optional)* | **number**  | The number of characters to show before truncating the label. Default: 20.                                   |
| action  *(optional)*         | **string**  | The target resource to which the histogram query should submit.                                              |
| date-format  *(optional)*    | **string**  | How to format the date. See #/api/lightning.filter:dateFormat\[date format filter] for valid formats.        |

## Example

#### Source

```xml wrap  theme={"dark"}
<div ng-controller="ExampleController">
    <h3 id="example_histogram">Histogram</h3>
    <chart:histogram response="response" facet-name="test1"></chart:histogram>
    <hr />
    <h3 id="example_histogram-with-date-formatting">Histogram with Date Formatting</h3>
    <chart:histogram response="response" facet-name="test3" date-format="fullDate"></chart:histogram>
    <hr />
    <h3 id="example_large-dateset">Large Dateset</h3>
    <chart:histogram response="response" facet-name="date" date-format="fullDate" show="99" show-count="true"></chart:histogram>
    <widget:slider response="response" facet-name="date" date-format="fullDate" sort="false"></widget:slider>
</div>
```

```js wrap  expandable  theme={"dark"}
angular.module('lightning')
.controller('ExampleController', ['$scope','$timeout','ResponseService', function($scope,$timeout,ResponseService) {
            $scope.response = {
                page: 2,
                query: {
                    rpp: 50,
                    filters:[]
                },
                facets: {
                    test1: {
                        filters: [
                            {

                                val: {
                                    dsp: 'Day 1',
                                    act: 'Day 1',

                                },
                                count: 100,

                            },
                            {

                                val: {
                                    dsp: 'Day 2',
                                    act: 'Day 2',
                                },
                                count: 200,
                            }

                        ],
                        'max-count':'200'
                    },
                    test2: {
                        filters: [
                            {

                                val: {
                                    dsp: 'Day 1',
                                    act: 'Day 1',
                                },
                                count: 10,

                            },
                            {

                                val: {
                                    dsp: 'Day 2',
                                    act: 'Day 2',
                                },
                                count: 20,
                            }

                        ],
                        'max-count':20
                    },
                    test3: {
                        filters: [
                            {

                                val: {
                                    dsp: 1288323623006,
                                    act: 1288323623006,
                                },
                                count: 10,

                            },
                            {

                                val: {
                                    dsp: 1288323723006,
                                    act: 1288323723006,
                                },
                                count: 20,
                            }

                        ],
                        'max-count':20
                    },
                    date:{
                        filters:[],
                        'max-count':100
                    }
                },
                results: []
            }

            var i = 0;

            while(i < 99){
                var CurrentDate = new Date();
                CurrentDate.setMonth(CurrentDate.getMonth() + i);
                $scope.response.facets.date.filters.push(
                    {
                        val : {
                            dsp:CurrentDate,
                            act:CurrentDate
                        },
                        count:Math.floor(Math.random()*(100-1+1)+1),
                    }
                )
                i++
            }

            console.log($scope.response.facets.date);
            ResponseService.setResponse('response', $scope.response);
        }]);
```

#### Result

<img src="https://mintcdn.com/lucidworks/_JCWsGwGCZxJia7w/assets/images/app-studio/as-examples/tags/chartHistogram.png?fit=max&auto=format&n=_JCWsGwGCZxJia7w&q=85&s=4b393618ec4b3b0da8fda544d69b53c2" alt="Result" width="1024" height="714" data-path="assets/images/app-studio/as-examples/tags/chartHistogram.png" />
