> ## Documentation Index
> Fetch the complete documentation index at: https://doc.lucidworks.com/llms.txt
> Use this file to discover all available pages before exploring further.

# chart:display

export const LwTemplate = ({title = "Key questions to get you started", icon = "sparkles", cta = "Powered by Agent Studio", linkHref = "https://lucidworks.com/demo/?utm_source=docs&utm_medium=referral&utm_campaign=docs_cta_ai"}) => {
  const [isLoaded, setIsLoaded] = useState(false);
  useEffect(() => {
    const timer = setTimeout(() => {
      setIsLoaded(true);
    }, 500);
    return () => clearTimeout(timer);
  }, []);
  return <div className="lw-template-container">
      <Card title={title} icon={icon}>
        {isLoaded && <span dangerouslySetInnerHTML={{
    __html: `<lw-template id="a029c1a9-28be-427e-b0e1-5d918920246a"></lw-template
            >`
  }} />}
        <Link href={linkHref} className="agent-studio-link text-left text-gray-600 gap-2 dark:text-gray-400 text-sm font-medium flex flex-row items-center hover:text-primary dark:hover:text-primary-light group-hover:text-primary group-hover:dark:text-primary-light">Powered by Lucidworks Agent Studio</Link>
      </Card>
    </div>;
};

[localhost link]: http://localhost:3000/docs/4/app-studio/reference/tags/lightning.directive.chartDisplay

[mintlify link]: https://doc.lucidworks.com/docs/4/app-studio/reference/tags/lightning.directive.chartDisplay

[old doc.lw link]: https://doc.lucidworks.com/app-studio/4.2/1056

<LwTemplate />

## Description

The Chart Display Tag displays the facet provided in a chart. The body
of the Chart Display tag can contain a
[Series Facet Tag](/docs/4/app-studio/reference/tags/lightning.directive.seriesFacet) for rendering
multiple series using facets and also a
[Series Result List Tag](/docs/4/app-studio/reference/tags/lightning.directive.seriesResultList) for
rendering multiple series using results. Along with this there are other
tags to customise the chart, these include the
[Chart Tooltip Tag](/docs/4/app-studio/reference/tags/lightning.directive.chartTooltip) for
modifying the tooltip,
[Chart Legend Tag](/docs/4/app-studio/reference/tags/lightning.directive.chartLegend) for
modifying the legend, [Chart Credit Tag](/docs/4/app-studio/reference/tags/lightning.directive.chartCredit) for adding a credit to the chart and the
[Chart Export Tag](/docs/4/app-studio/reference/tags/lightning.directive.chartExport) for exporting
the chart.

For detail on how to change the color and background color see the demo
below, for more detail on what you can change and set using CSS see
[here.](http://www.highcharts.com/docs/chart-design-and-style/style-by-css)

The following tags can be nested within the chart display tag.

* [Series Facet Tag](/docs/4/app-studio/reference/tags/lightning.directive.seriesFacet)
* [Series Result List Tag](/docs/4/app-studio/reference/tags/lightning.directive.seriesResultList)
* [Series Time Tag](/docs/4/app-studio/reference/tags/lightning.directive.seriesTime)
* [Chart Credit Tag](/docs/4/app-studio/reference/tags/lightning.directive.chartCredit)
* [Chart Export Tag](/docs/4/app-studio/reference/tags/lightning.directive.chartExport)
* [Chart Legend Tag](/docs/4/app-studio/reference/tags/lightning.directive.chartLegend)
* [Chart Tooltip Tag](/docs/4/app-studio/reference/tags/lightning.directive.chartTooltip)

## Usage

as element:

```xml wrap  expandable  theme={"dark"}
<chart:display
       response="{string}"
       facet-name="{string}"
       type="{string}"
       [title="{string}"]
       [subtitle="{string}"]
       [height="{string}"]
       [xtitle="{string}"]
       [ytitle="{string}"]
       [stacking="{string}"]
       [radar-or-polar="{string}"]
       [xlabel-rotation="{number}"]
       [max-characters="{number}"]
       [inner-size="{number}"]
       [invert-axes="{boolean}"]
       [show-tooltips="{boolean}"]
       [query="{object}"]
       [options="{object}"]
       [max-labels="{number}"]
       [show-labels="{boolean}"]
       [show-count="{boolean}"]
       [show-data-labels="{boolean}"]
       [three-d="{boolean}"]
       [websocket="{string}"]
       [show-value="{boolean}"]
       [select-series="{boolean}"]
       [select="{string}"]
       [single-filter-mode="{boolean}"]>
</chart:display>
```

### Directive info

* This directive creates new scope.

#### Parameters

| Param                            | Type        | Details                                                                                                                                                                                                                                                                                                                                                                                                                                                                                                                                           |
| -------------------------------- | ----------- | ------------------------------------------------------------------------------------------------------------------------------------------------------------------------------------------------------------------------------------------------------------------------------------------------------------------------------------------------------------------------------------------------------------------------------------------------------------------------------------------------------------------------------------------------- |
| response                         | **string**  | The name of the response.                                                                                                                                                                                                                                                                                                                                                                                                                                                                                                                         |
| facet-name                       | **string**  | Name of facet.                                                                                                                                                                                                                                                                                                                                                                                                                                                                                                                                    |
| type                             | **string**  | Chart type (use type of 'time' when using the series time tag).                                                                                                                                                                                                                                                                                                                                                                                                                                                                                   |
| title  *(optional)*              | **string**  | Chart title                                                                                                                                                                                                                                                                                                                                                                                                                                                                                                                                       |
| subtitle  *(optional)*           | **string**  | Chart sub title                                                                                                                                                                                                                                                                                                                                                                                                                                                                                                                                   |
| height  *(optional)*             | **string**  | Chart height. Default:400 (400px but px is not required!)                                                                                                                                                                                                                                                                                                                                                                                                                                                                                         |
| xtitle  *(optional)*             | **string**  | x axis title                                                                                                                                                                                                                                                                                                                                                                                                                                                                                                                                      |
| ytitle  *(optional)*             | **string**  | y axis title                                                                                                                                                                                                                                                                                                                                                                                                                                                                                                                                      |
| stacking  *(optional)*           | **string**  | Whether to stack the values of each series on top of each other when using multiple series. 'normal' to stack by value or 'percent'.                                                                                                                                                                                                                                                                                                                                                                                                              |
| radar-or-polar  *(optional)*     | **string**  | Set as 'radar' or 'polar' to turn your series into a radar/polar chart.                                                                                                                                                                                                                                                                                                                                                                                                                                                                           |
| xlabel-rotation  *(optional)*    | **number**  | Rotation of the labels in degrees                                                                                                                                                                                                                                                                                                                                                                                                                                                                                                                 |
| max-characters  *(optional)*     | **number**  | Number of characters to show in labels. default:250. (Cannot be used with a time series)                                                                                                                                                                                                                                                                                                                                                                                                                                                          |
| inner-size  *(optional)*         | **number**  | The of size of the inner diameter of a pie chart. A size greater than 0 renders a donut chart.                                                                                                                                                                                                                                                                                                                                                                                                                                                    |
| invert-axes  *(optional)*        | **boolean** | Whether to invert the axes so that the x axis is vertical and y axis is horizontal. When true, the x axis is reversed by default. If a bar series is present in the chart, it will be inverted automatically. Defaults to false.                                                                                                                                                                                                                                                                                                                  |
| show-tooltips  *(optional)*      | **boolean** | Whether to display hover tooltips in the graph. Default:true                                                                                                                                                                                                                                                                                                                                                                                                                                                                                      |
| query  *(optional)*              | **object**  | The search query from which to build links.                                                                                                                                                                                                                                                                                                                                                                                                                                                                                                       |
| options  *(optional)*            | **object**  | Extend the current options. Options can be found [here.](http://api.highcharts.com/highcharts/)                                                                                                                                                                                                                                                                                                                                                                                                                                                   |
| max-labels  *(optional)*         | **number**  | Maximum number of labels to show                                                                                                                                                                                                                                                                                                                                                                                                                                                                                                                  |
| show-labels  *(optional)*        | **boolean** | Whether to show labels in the graph, does not affect hover tooltips, default:true                                                                                                                                                                                                                                                                                                                                                                                                                                                                 |
| show-count  *(optional)*         | **boolean** | Whether to show the count in the label. default:false                                                                                                                                                                                                                                                                                                                                                                                                                                                                                             |
| show-data-labels  *(optional)*   | **boolean** | Whether to show the count on the point of the series (Not applicable to pie charts) default:false                                                                                                                                                                                                                                                                                                                                                                                                                                                 |
| three-d  *(optional)*            | **boolean** | Renders the chart in 3d. Only works with column and pie charts.                                                                                                                                                                                                                                                                                                                                                                                                                                                                                   |
| websocket  *(optional)*          | **string**  | URL to receive updates from                                                                                                                                                                                                                                                                                                                                                                                                                                                                                                                       |
| show-value  *(optional)*         | **boolean** | Whether to show the value in the middle of the chart when hovered over. This will only work for pie charts with the `inner-size` attribute set greater then 0.                                                                                                                                                                                                                                                                                                                                                                                    |
| select-series  *(optional)*      | **boolean** | When set to `true` you will be able to select the series to show on the chart.                                                                                                                                                                                                                                                                                                                                                                                                                                                                    |
| select  *(optional)*             | **string**  | How the data should be filtered when clicking on a part of the chart, a valid query must be present. See [select example](/docs/4/app-studio/reference/tags/lightning.directive.chartDisplay)  <br />Valid values:<br />  <br />● **false**  User selects a filter by clicking the value;  **(default)** <br />● **multiselect**  Supports selecting multiple filters that get combined with an 'OR'. <br />● **multiselect-instant**  Supports selecting multiple filters that get combined with an 'OR', filters will be applied automatically. |
| single-filter-mode  *(optional)* | **boolean** | When in single-filter mode, a facet visualisation will be shown as a single number, in large print, when the facet being rendered has only a single filter value. This is to avoid showing a single bar, column or pie slice when rendering a visualisation over a single data bucket. See [single filter mode example](/docs/4/app-studio/reference/tags/lightning.directive.chartDisplay)                                                                                                                                                       |

## Example

#### Source

```xml wrap  expandable  theme={"dark"}
<div ng-controller="ExampleController">
    <div>
        <h3 id="example_chart-types">Chart Types</h3>
        <toggle:controls labels="Bar, Column, Pie, Donut, Donut 2, Line, Area, Area Spline" panes="panes"></toggle:controls>
        <toggle:panes id="panes">
            <toggle:pane>
                <chart:display response="response" facet-name="population" type="bar" title="Population of Countries" subtitle="Bar Chart">
                    <chart:credit text="twigkit.com" href="http://www.twigkit.com"></chart:credit>
                    <chart:export file-name="bar"></chart:export>
                </chart:display>
            </toggle:pane>
            <toggle:pane>
                <chart:display response="response" facet-name="population" type="column" title="Population of Countries" subtitle="Column Chart">
                    <chart:credit text="twigkit.com" href="http://www.twigkit.com"></chart:credit>
                    <chart:export file-name="column"></chart:export>
                </chart:display>
            </toggle:pane>
            <toggle:pane>
                <chart:display response="response" facet-name="population" type="pie" title="Population of Countries" subtitle="Pie Chart">
                    <chart:credit text="twigkit.com" href="http://www.twigkit.com"></chart:credit>
                    <chart:export file-name="pie"></chart:export>
                </chart:display>
            </toggle:pane>
            <toggle:pane>
                <chart:display response="response" facet-name="population" type="pie" inner-size="80%" show-tooltips="false" show-value="true" title="Population of Countries" subtitle="Donut Chart">
                    <chart:credit text="twigkit.com" href="http://www.twigkit.com"></chart:credit>
                    <chart:export file-name="donut"></chart:export>
                </chart:display>
            </toggle:pane>
            <toggle:pane>
                <chart:display response="response" facet-name="population" type="donut" title="Population of Countries" subtitle="Donut Chart 2">
                    <chart:credit text="twigkit.com" href="http://www.twigkit.com"></chart:credit>
                    <chart:export file-name="donut"></chart:export>
                </chart:display>
            </toggle:pane>
            <toggle:pane>
                <chart:display response="response" facet-name="population" type="line" title="Population of Countries" subtitle="Line Chart">
                    <chart:credit text="twigkit.com" href="http://www.twigkit.com"></chart:credit>
                    <chart:export file-name="line"></chart:export>
                </chart:display>
            </toggle:pane>
            <toggle:pane>
                <chart:display response="response" facet-name="population" type="area" title="Population of Countries" subtitle="Area Chart">
                    <chart:credit text="twigkit.com" href="http://www.twigkit.com"></chart:credit>
                    <chart:export file-name="area"></chart:export>
                </chart:display>
            </toggle:pane>
            <toggle:pane>
                <chart:display response="response" facet-name="population" type="areaspline" title="Population of Countries" subtitle="Area Spline Chart">
                    <chart:credit text="twigkit.com" href="http://www.twigkit.com"></chart:credit>
                    <chart:export file-name="areaspline"></chart:export>
                </chart:display>
            </toggle:pane>
        </toggle:panes>
    </div>
    <hr/>
    <div>
        <h3 id="example_radar-chart-type">Radar Chart Type</h3>
        <toggle:controls labels="Bar, Line, Area" panes="radar"></toggle:controls>
        <toggle:panes id="radar">
            <toggle:pane>
                <chart:display response="response" facet-name="population" type="bar" title="Population of Countries" subtitle="Bar Chart" radar-or-polar="radar">
                    <chart:credit text="twigkit.com" href="http://www.twigkit.com"></chart:credit>
                    <chart:export file-name="bar"></chart:export>
                </chart:display>
            </toggle:pane>
            <toggle:pane>
                <chart:display response="response" facet-name="population" type="line" title="Population of Countries" subtitle="Line Chart" radar-or-polar="radar">
                    <chart:credit text="twigkit.com" href="http://www.twigkit.com"></chart:credit>
                    <chart:export file-name="line"></chart:export>
                </chart:display>
            </toggle:pane>
            <toggle:pane>
                <chart:display response="response" facet-name="population" type="area" title="Population of Countries" subtitle="Area Chart" radar-or-polar="radar">
                    <chart:credit text="twigkit.com" href="http://www.twigkit.com"></chart:credit>
                    <chart:export file-name="area"></chart:export>
                </chart:display>
            </toggle:pane>
        </toggle:panes>
    </div>
    <hr/>
    <div>
        <h3 id="example_polar-chart-type">Polar Chart Type</h3>
        <toggle:controls labels="Bar, Line, Area" panes="polar"></toggle:controls>
        <toggle:panes id="polar">
            <toggle:pane>
                <chart:display response="response" facet-name="population" type="bar" title="Population of Countries" subtitle="Bar Chart" radar-or-polar="polar">
                    <chart:credit text="twigkit.com" href="http://www.twigkit.com"></chart:credit>
                    <chart:export file-name="bar"></chart:export>
                </chart:display>
            </toggle:pane>
            <toggle:pane>
                <chart:display response="response" facet-name="population" type="line" title="Population of Countries" subtitle="Line Chart" radar-or-polar="polar">
                    <chart:credit text="twigkit.com" href="http://www.twigkit.com"></chart:credit>
                    <chart:export file-name="line"></chart:export>
                </chart:display>
            </toggle:pane>
            <toggle:pane>
                <chart:display response="response" facet-name="population" type="area" title="Population of Countries" subtitle="Area Chart" radar-or-polar="polar">
                    <chart:credit text="twigkit.com" href="http://www.twigkit.com"></chart:credit>
                    <chart:export file-name="area"></chart:export>
                </chart:display>
            </toggle:pane>
        </toggle:panes>
    </div>
    <hr/>
    <div>
        <h3 id="example_axis-titles">Axis Titles</h3>
        <chart:display response="response" facet-name="population" type="bar" title="Population of Countries" xtitle="Country" ytitle="Population">
            <chart:credit text="twigkit.com" href="http://www.twigkit.com"></chart:credit>
            <chart:export file-name="column"></chart:export>
        </chart:display>
    </div>
    <hr/>
    <div>
        <h3 id="example_3d">3D</h3>
        <chart:display response="response" facet-name="population" type="pie" title="Population of Countries" three-d="true">
            <chart:credit text="twigkit.com" href="http://www.twigkit.com"></chart:credit>
        </chart:display>
        <hr/>
        <chart:display response="response" facet-name="population" type="column" title="Population of Countries" three-d="true">
            <chart:credit text="twigkit.com" href="http://www.twigkit.com"></chart:credit>
        </chart:display>
    </div>
    <hr/>
    <div>
        <h3 id="example_label-rotation">Label Rotation</h3>
        <chart:display response="response" facet-name="population" type="column" title="Population of Countries" xlabel-rotation="45">
            <chart:credit text="twigkit.com" href="http://www.twigkit.com"></chart:credit>
        </chart:display>
        <hr/>
        <chart:display response="response" facet-name="population" type="column" title="Population of Countries" xlabel-rotation="-45">
            <chart:credit text="twigkit.com" href="http://www.twigkit.com"></chart:credit>
        </chart:display>
    </div>
    <hr/>
    <div>
        <h3 id="example_show-labels">Show Labels (false)</h3>
        <chart:display response="response" facet-name="population" type="pie" title="Population of Countries" show-labels="false">
            <chart:credit text="twigkit.com" href="http://www.twigkit.com"></chart:credit>
        </chart:display>
        <hr/>
        <chart:display response="response" facet-name="population" type="pie" inner-size="80%" show-value="true" show-tooltips="false" title="Population of Countries" show-labels="false">
            <chart:credit text="twigkit.com" href="http://www.twigkit.com"></chart:credit>
        </chart:display>
    </div>
    <div>
        <h3 id="example_custom">Custom (<a href="http://api.highcharts.com/highcharts/" target="_blank">Options</a>)</h3>
        <chart:display response="response"  type="line" title="Population of Countries" xlabel-rotation="-45" options="custom">
            <series:facet response="response" name="population" title="Population Present Day"></series:facet>
            <series:facet response="response" name="population2000" title="Population 2000"></series:facet>
            <chart:credit text="twigkit.com" href="http://www.twigkit.com"></chart:credit>
        </chart:display>

        <h4 id="example_custom_zoom">Zoom (Custom)</h4>
        <p>Custom Object</p>
        <pre>{{zoomCustom | json}}</pre>
        <p>Use your mouse to select the area you wish to zoom in on</p>
        <chart:display response="response"  type="line" title="Population of Countries" options="zoomCustom">
            <series:facet response="response" name="population" title="Population Present Day"></series:facet>
            <series:facet response="response" name="population2000" title="Population 2000"></series:facet>
            <chart:credit text="twigkit.com" href="http://www.twigkit.com"></chart:credit>
        </chart:display>
    </div>
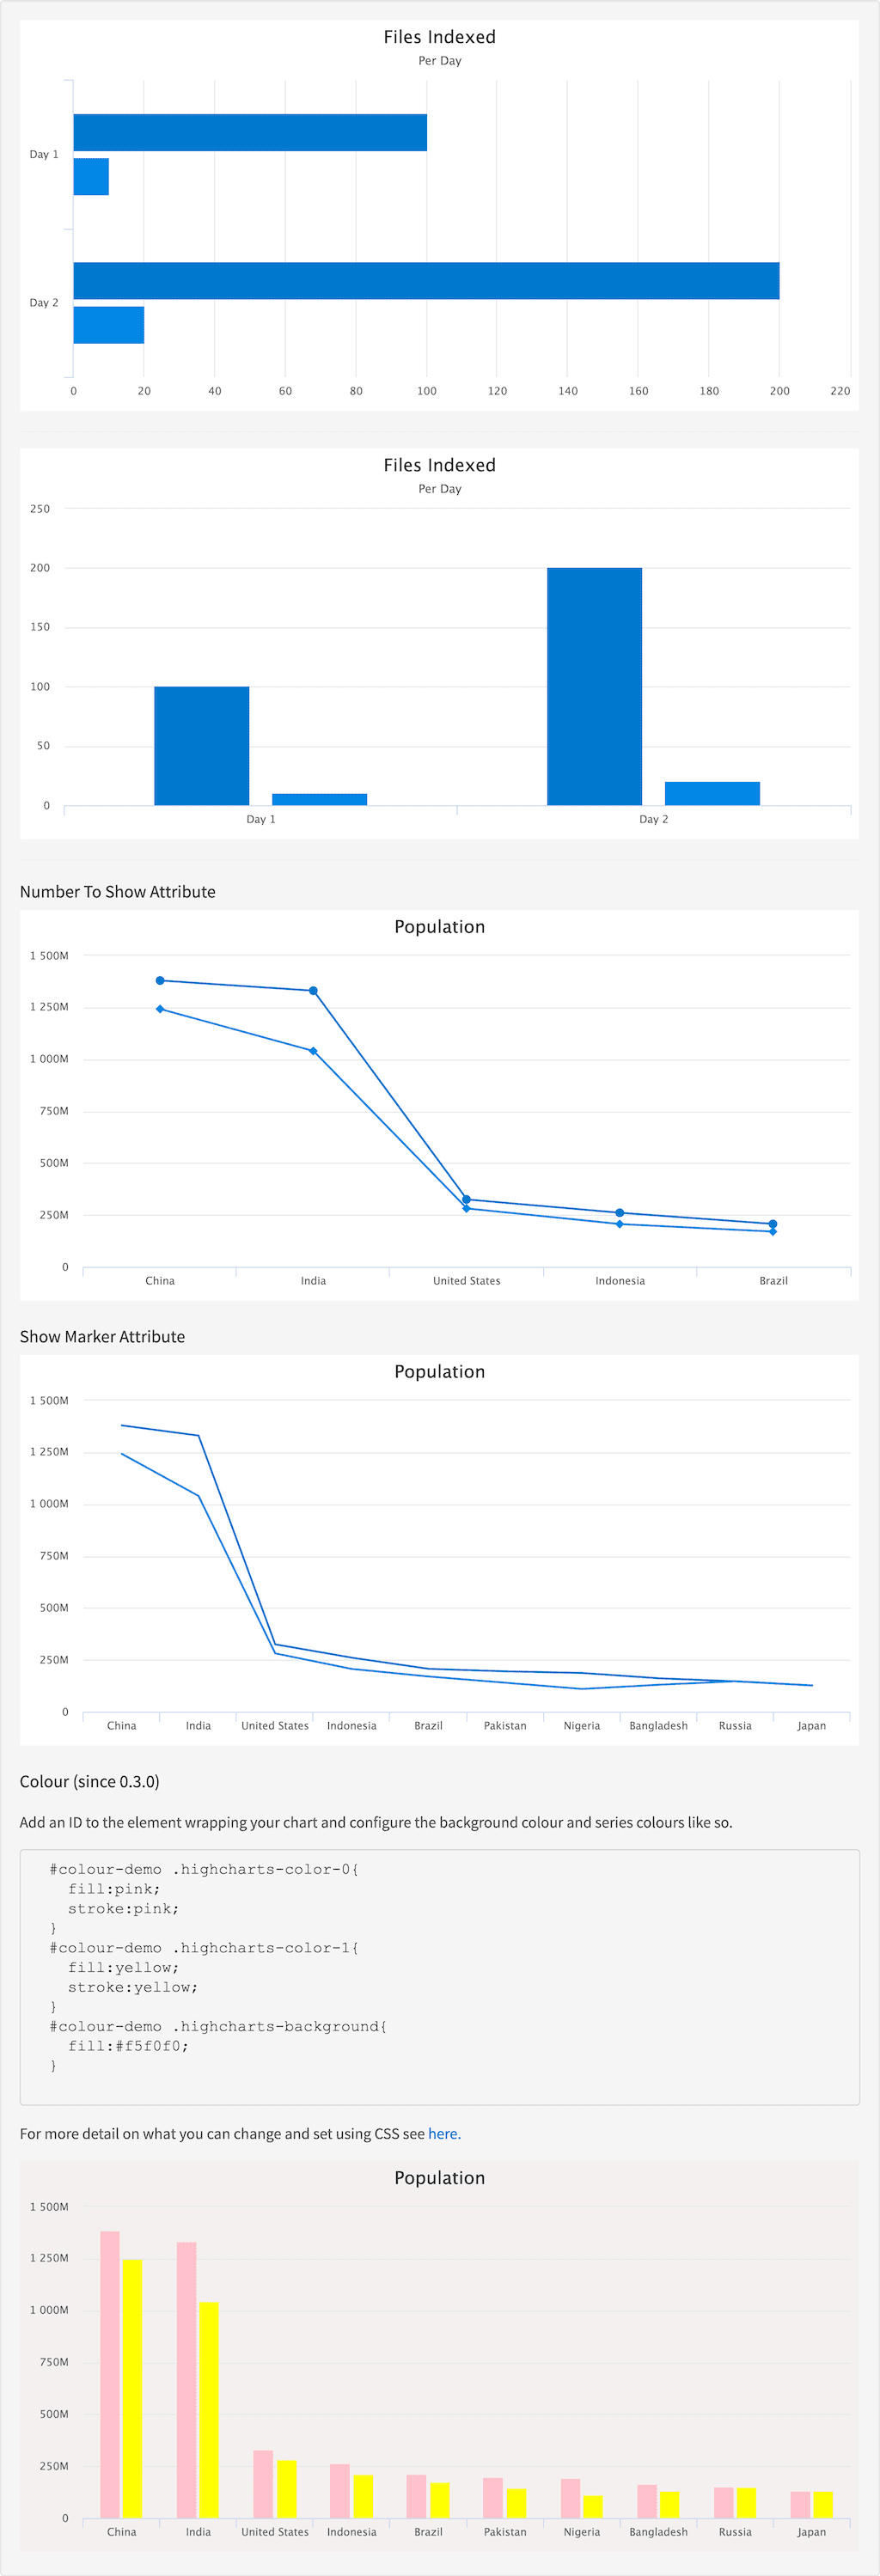
    <div id="colour-demo">
        <h3 id="example_colour">Colour (since 0.3.0)</h3>
    <p>Add an ID to the element wrapping your chart and configure the background colour and series colours like so.</p>
    <pre>
    #colour-demo .highcharts-color-0{
    fill:pink;
    stroke:pink;
    }
    #colour-demo .highcharts-color-1{
    fill:yellow;
    stroke:yellow;
    }
    #colour-demo .highcharts-background{
    fill:#f5f0f0;
    }
    </pre>
    <p>For more detail on what you can change and set using CSS see <a href="http://www.highcharts.com/docs/chart-design-and-style/style-by-css" target="_blank">here.</a></p>
        <chart:display response="response"  type="line" title="Population of Countries" xlabel-rotation="-45" options="custom">
            <series:facet response="response" name="population" title="Population Present Day"></series:facet>
            <series:facet response="response" name="population2000" title="Population 2000"></series:facet>
            <chart:credit text="twigkit.com" href="http://www.twigkit.com"></chart:credit>
        </chart:display>
    </div>

    <div>
        <h3 id="example_selectable-series">Selectable Series</h3>
        <chart:display response="response"  type="line" title="Population of Countries" xlabel-rotation="-45" select="checkbox">
            <series:facet response="response" name="population" title="Population Present Day" selected-by-default="false"></series:facet>
            <series:facet response="response" name="population2000" title="Population 2000"></series:facet>
            <chart:credit text="twigkit.com" href="http://www.twigkit.com"></chart:credit>
        </chart:display>
    </div>

</div>
```

```xml wrap  theme={"dark"}
#colour-demo .highcharts-color-0{
    fill:pink;
    stroke:pink;

colour-demo .highcharts-color-1{
    fill:yellow;
    stroke:yellow;

colour-demo .highcharts-background{
    fill:#f5f0f0;
```

```xml wrap  expandable  theme={"dark"}
angular.module('lightning')
.controller('ExampleController', ['$scope','$timeout', 'ResponseService', function($scope,$timeout, ResponseService) {
            $scope.custom = {
                    tooltip:{
                        shared:true,
                        split:true
                    },
                    xAxis: {
                        plotLines: [{
                        value: 3, // Value of where the line will appear
                        width: 1 // Width of the line
                        }]
                    }
                };

                $scope.zoomCustom = {
                    chart:{
                        zoomType:'xy'
                    }
                }

            $scope.response = {
                page: 2,
                query: {
                    rpp: 50
                },
                facets: {
                    test: {
                        filters: [
                            {

                                val: {
                                    dsp: 'dsp1',
                                    act: 1
                                },
                                count: 1,

                            },
                            {

                                val: {
                                    dsp: 'dsp2',
                                    act: 2
                                },
                                count: 2,
                            }

                        ]
                    },
                    population:{
                        filters: [
                            {
                                val: 'China',
                                count: 1379790000,
                            },
                            {
                                val: 'India',
                                count: 1330780000,
                            },
                            {
                                val: 'United States',
                                count: 324897000,
                            },
                            {
                                val: 'Indonesia',
                                count: 260581000,
                            },
                            {
                                val: 'Brazil',
                                count: 206927000,
                            },
                            {
                                val: 'Pakistan',
                                count: 194772000,
                            },
                            {
                                val: 'Nigeria',
                                count: 186987000,
                            },
                            {
                                val: 'Bangladesh',
                                count: 161401000,
                            },
                            {
                                val: 'Russia',
                                count: 146727405,
                            },
                            {
                                val: 'Japan',
                                count: 126693000,
                            },
                        ]
                    },
                    population2000:{
                        filters: [
                            {
                                val: 'China',
                                count: 1242612300,
                            },
                            {
                                val: 'India',
                                count: 1040000000,
                            },
                            {
                                val: 'United States',
                                count: 281421923,
                            },
                            {
                                val: 'Indonesia',
                                count: 206264595,
                            },
                            {
                                val: 'Brazil',
                                count: 170000000,
                            },
                            {
                                val: 'Pakistan',
                                count: 140000000,
                            },
                            {
                                val: 'Nigeria',
                                count: 110000000,
                            },
                            {
                                val: 'Bangladesh',
                                count: 130000000,
                            },
                            {
                                val: 'Russia',
                                count: 147000000,
                            },
                            {
                                val: 'Japan',
                                count: 127000000,
                            },
                        ]
                    },
                    donut: {
                        filters: [
                            {

                                val: {
                                    dsp: 'Short',
                                    act: 1
                                },
                                count: 1,

                            },
                            {

                                val: {
                                    dsp: 'Long Donut Name(15)',
                                    act: 2
                                },
                                count: 2,
                            },
                            {

                                val: {
                                    dsp: 'Long Long Donut Name',
                                    act: 10
                                },
                                count: 10,
                            },
                            {

                                val: {
                                    dsp: 'Long Long Long Donut Name',
                                    act: 20
                                },
                                count: 20,
                            },
                            {

                                val: {
                                    dsp: 'Long Long Long Long Donut Name',
                                    act: 20
                                },
                                count: 20,
                            },
                            {

                                val: {
                                    dsp: 'Long Long Long Long Long Donut Name',
                                    act: 20
                                },
                                count: 20,
                            },
                            {

                                val: {
                                    dsp: 'Long Long Long Long Long Long Donut Name',
                                    act: 20
                                },
                                count: 20,
                            }
                        ]
                    },
                },
                results: [
                    {
                        result: {
                            fields: {
                                label:{
                                    val:'label1',
                                } ,
                                value:{
                                    val:1,
                                },
                                anotherValue:{
                                    val:1,
                                },
                            }
                        },

                    },
                    {
                        result: {
                            fields: {
                                label:{
                                    val:'label2',
                                } ,
                                value:{
                                    val:2,
                                },
                                anotherValue:{
                                    val:100,
                                },
                            }
                        },

                        hits: {
                            act: ['Hits', 264]
                        }
                    }]
            }

            ResponseService.setResponse('response',$scope.response);
        }]);
```

#### Result

<img src="https://mintcdn.com/lucidworks/ENcE8K39c0iEpL8J/assets/images/app-studio/as-examples/tags/seriesFacet.png?fit=max&auto=format&n=ENcE8K39c0iEpL8J&q=85&s=38e8046e42125e89f2c2a499296091af" alt="Result" width="1024" height="2998" data-path="assets/images/app-studio/as-examples/tags/seriesFacet.png" />